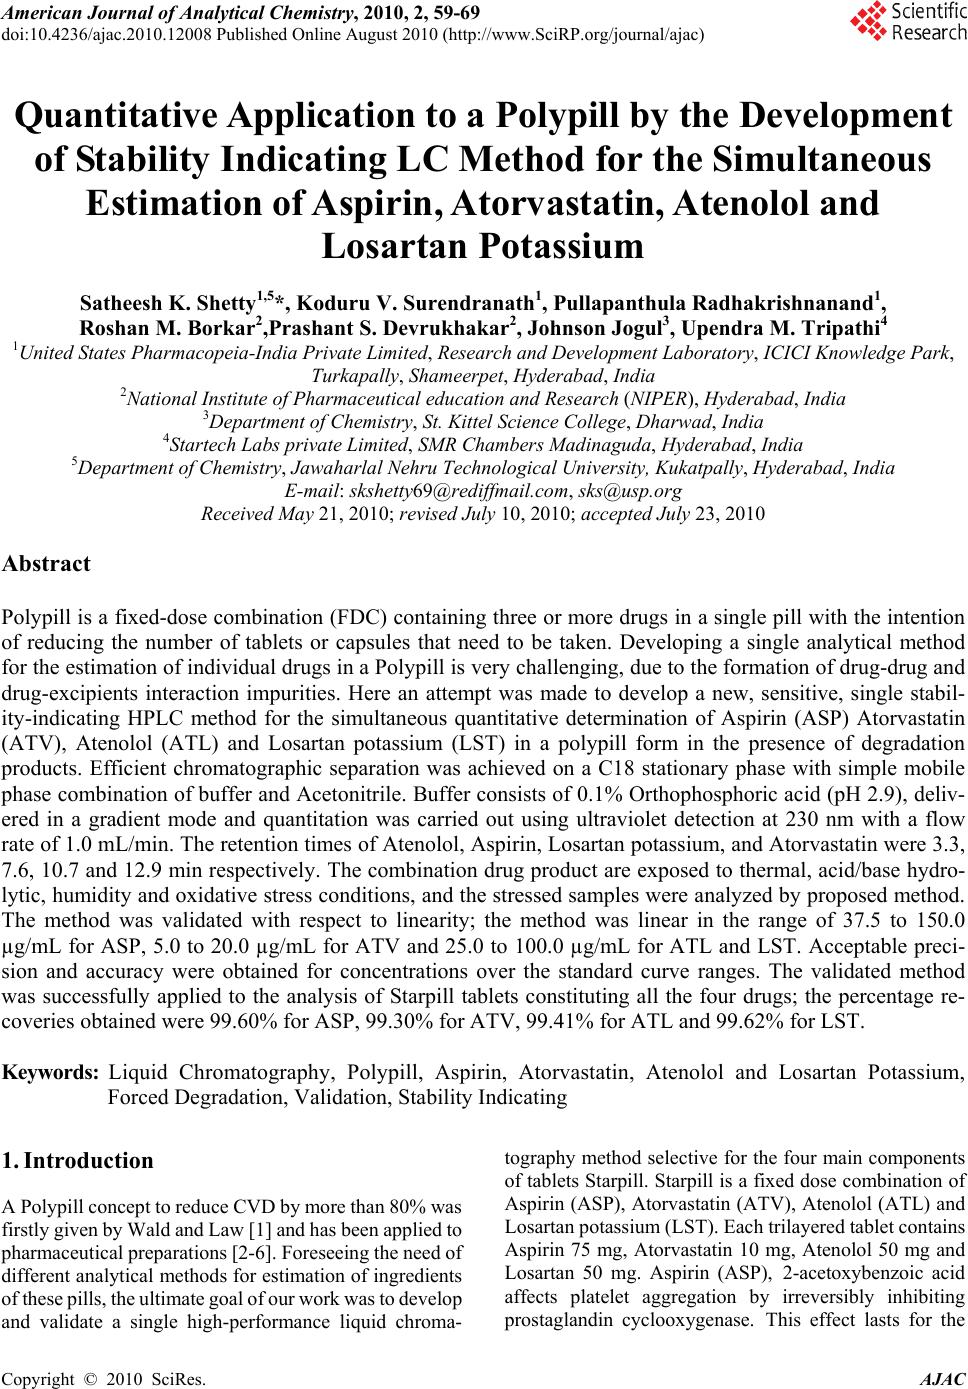
 American Journal of Analytical Chemistry, 2010, 2, 59-69 doi:10.4236/ajac.2010.12008 Published Online August 2010 (http://www.SciRP.org/journal/ajac) Copyright © 2010 SciRes. AJAC Quantitative Application to a Polypill by the Development of Stability Indicating LC Method for the Simultaneous Estimation of Aspirin, Atorvastatin, Atenolol and Losartan Potassium Satheesh K. Shetty1,5*, Koduru V. Surendranath1, Pullapanthula Radhakrishnanand1, Roshan M. Borkar2,Prashant S. Devrukhakar2, Johnson Jogul3, Upendra M. Tripathi4 1United States Pharmacopeia-India Private Limited, Research and Development Laboratory, ICICI Knowledge Park, Turkapally, Shameerpet, Hyderabad, India 2National Institute of Pharmaceutical education and Research (NIPER), Hyderabad, India 3Department of Chemistry, St. Kittel Science College, Dharwad, India 4Startech Labs private Limited, SMR Chambers Madinaguda, Hyderabad, India 5Department of Chemistry, Jawaharlal Nehru Technological University, Kukatpally, Hyderabad, India E-mail: skshetty69@rediffmail.com, sks@usp.org Received May 21, 2010; revised July 10, 2010; accepted July 23, 2010 Abstract Polypill is a fixed-dose combination (FDC) containing three or more drugs in a single pill with the intention of reducing the number of tablets or capsules that need to be taken. Developing a single analytical method for the estimation of individual drugs in a Polypill is very challenging, due to the formation of drug-drug and drug-excipients interaction impurities. Here an attempt was made to develop a new, sensitive, single stabil- ity-indicating HPLC method for the simultaneous quantitative determination of Aspirin (ASP) Atorvastatin (ATV), Atenolol (ATL) and Losartan potassium (LST) in a polypill form in the presence of degradation products. Efficient chromatographic separation was achieved on a C18 stationary phase with simple mobile phase combination of buffer and Acetonitrile. Buffer consists of 0.1% Orthophosphoric acid (pH 2.9), deliv- ered in a gradient mode and quantitation was carried out using ultraviolet detection at 230 nm with a flow rate of 1.0 mL/min. The retention times of Atenolol, Aspirin, Losartan potassium, and Atorvastatin were 3.3, 7.6, 10.7 and 12.9 min respectively. The combination drug product are exposed to thermal, acid/base hydro- lytic, humidity and oxidative stress conditions, and the stressed samples were analyzed by proposed method. The method was validated with respect to linearity; the method was linear in the range of 37.5 to 150.0 µg/mL for ASP, 5.0 to 20.0 µg/mL for ATV and 25.0 to 100.0 µg/mL for ATL and LST. Acceptable preci- sion and accuracy were obtained for concentrations over the standard curve ranges. The validated method was successfully applied to the analysis of Starpill tablets constituting all the four drugs; the percentage re- coveries obtained were 99.60% for ASP, 99.30% for ATV, 99.41% for ATL and 99.62% for LST. Keywords: Liquid Chromatography, Polypill, Aspirin, Atorvastatin, Atenolol and Losartan Potassium, Forced Degradation, Validation, Stability Indicating 1. Introduction A Polypill concept to reduce CVD by more than 80% was firstly given by Wald and Law [1] and has been applied to pharmaceutical preparations [2-6]. Foreseeing the need of different analytical methods for estimation of ingredients of these pills, the ultimate goal of our work was to develop and validate a single high-performance liquid chroma- tography method selective for the four main components of tablets Starpill. Starpill is a fixed dose combination of Aspirin (ASP), Atorvastatin (ATV), Atenolol (ATL) and Losartan potassium (LST). Each trilayered tablet contains Aspirin 75 mg, Atorvastatin 10 mg, Atenolol 50 mg and Losartan 50 mg. Aspirin (ASP), 2-acetoxybenzoic acid affects platelet aggregation by irreversibly inhibiting prostaglandin cyclooxygenase. This effect lasts for the 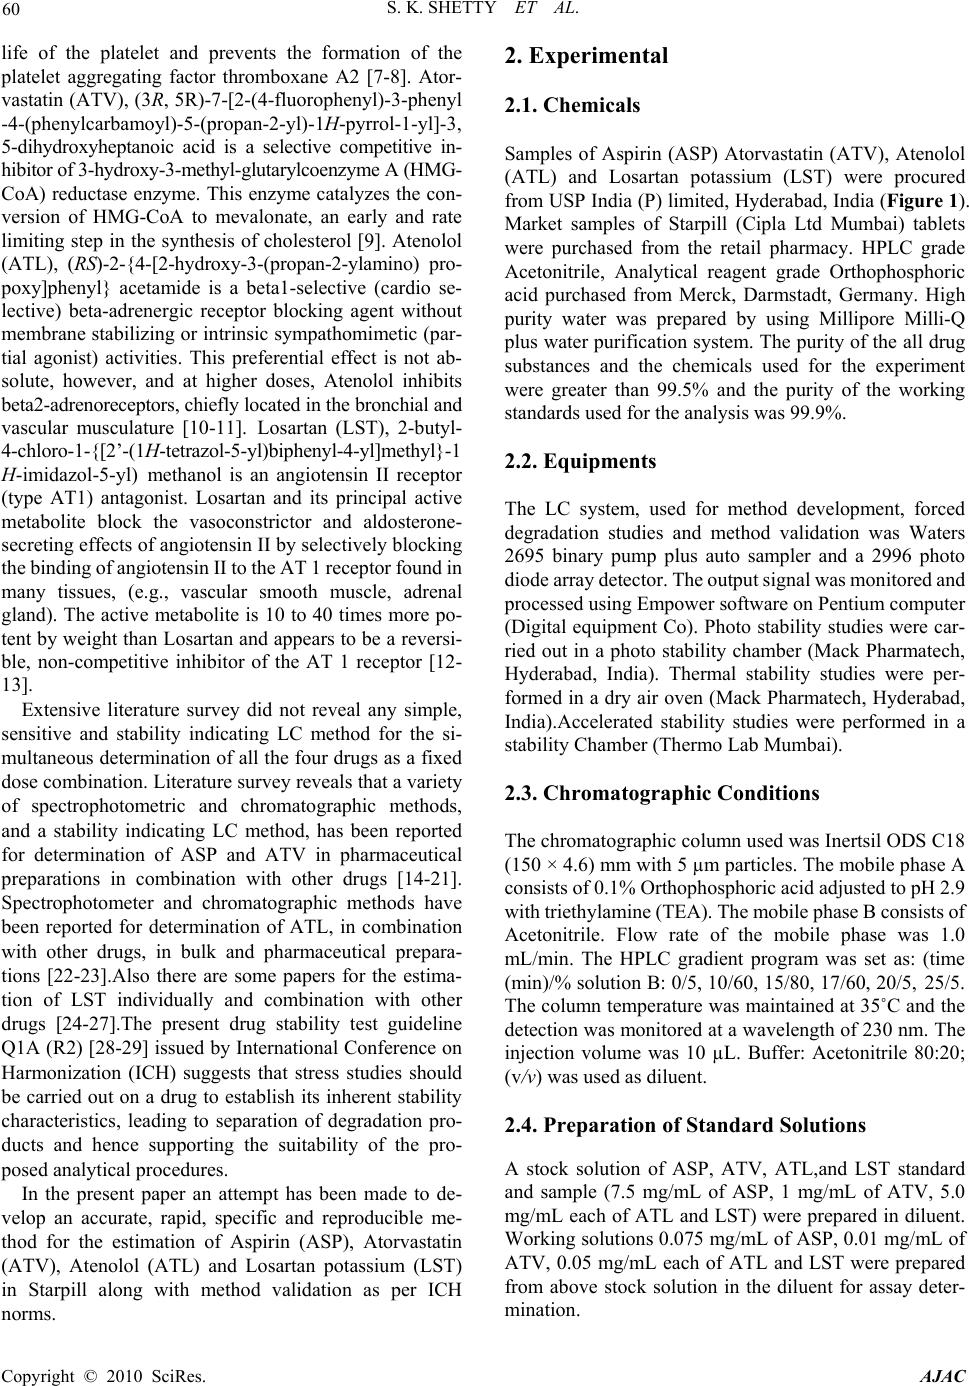 60 S. K. SHETTY ET AL. life of the platelet and prevents the formation of the platelet aggregating factor thromboxane A2 [7-8]. Ator- vastatin (ATV), (3R, 5R)-7-[2-(4-fluorophenyl)-3-phenyl -4-(phenylcarbamoyl)-5-(propan-2-yl)-1H-pyrrol-1-yl]-3, 5-dihydroxyheptanoic acid is a selective competitive in- hibitor of 3-hydroxy-3-methyl-glutarylcoenzyme A (HMG- CoA) reductase enzyme. This enzyme catalyzes the con- version of HMG-CoA to mevalonate, an early and rate limiting step in the synthesis of cholesterol [9]. Atenolol (ATL), (RS)-2-{4-[2-hydroxy-3-(propan-2-ylamino) pro- poxy]phenyl} acetamide is a beta1-selective (cardio se- lective) beta-adrenergic receptor blocking agent without membrane stabilizing or intrinsic sympathomimetic (par- tial agonist) activities. This preferential effect is not ab- solute, however, and at higher doses, Atenolol inhibits beta2-adrenoreceptors, chiefly located in the bronchial and vascular musculature [10-11]. Losartan (LST), 2-butyl- 4-chloro-1-{[2’-(1H-tetrazol-5-yl)biphenyl-4-yl]methyl}-1 H-imidazol-5-yl) methanol is an angiotensin II receptor (type AT1) antagonist. Losartan and its principal active metabolite block the vasoconstrictor and aldosterone- secreting effects of angiotensin II by selectively blocking the binding of angiotensin II to the AT 1 receptor found in many tissues, (e.g., vascular smooth muscle, adrenal gland). The active metabolite is 10 to 40 times more po- tent by weight than Losartan and appears to be a reversi- ble, non-competitive inhibitor of the AT 1 receptor [12- 13]. Extensive literature survey did not reveal any simple, sensitive and stability indicating LC method for the si- multaneous determination of all the four drugs as a fixed dose combination. Literature survey reveals that a variety of spectrophotometric and chromatographic methods, and a stability indicating LC method, has been reported for determination of ASP and ATV in pharmaceutical preparations in combination with other drugs [14-21]. Spectrophotometer and chromatographic methods have been reported for determination of ATL, in combination with other drugs, in bulk and pharmaceutical prepara- tions [22-23].Also there are some papers for the estima- tion of LST individually and combination with other drugs [24-27].The present drug stability test guideline Q1A (R2) [28-29] issued by International Conference on Harmonization (ICH) suggests that stress studies should be carried out on a drug to establish its inherent stability characteristics, leading to separation of degradation pro- ducts and hence supporting the suitability of the pro- posed analytical procedures. In the present paper an attempt has been made to de- velop an accurate, rapid, specific and reproducible me- thod for the estimation of Aspirin (ASP), Atorvastatin (ATV), Atenolol (ATL) and Losartan potassium (LST) in Starpill along with method validation as per ICH norms. 2. Experimental 2.1. Chemicals Samples of Aspirin (ASP) Atorvastatin (ATV), Atenolol (ATL) and Losartan potassium (LST) were procured from USP India (P) limited, Hyderabad, India (Figure 1). Market samples of Starpill (Cipla Ltd Mumbai) tablets were purchased from the retail pharmacy. HPLC grade Acetonitrile, Analytical reagent grade Orthophosphoric acid purchased from Merck, Darmstadt, Germany. High purity water was prepared by using Millipore Milli-Q plus water purification system. The purity of the all drug substances and the chemicals used for the experiment were greater than 99.5% and the purity of the working standards used for the analysis was 99.9%. 2.2. Equipments The LC system, used for method development, forced degradation studies and method validation was Waters 2695 binary pump plus auto sampler and a 2996 photo diode array detector. The output signal was monitored and processed using Empower software on Pentium computer (Digital equipment Co). Photo stability studies were car- ried out in a photo stability chamber (Mack Pharmatech, Hyderabad, India). Thermal stability studies were per- formed in a dry air oven (Mack Pharmatech, Hyderabad, India).Accelerated stability studies were performed in a stability Chamber (Thermo Lab Mumbai). 2.3. Chromatographic Conditions The chromatographic column used was Inertsil ODS C18 (150 × 4.6) mm with 5 µm particles. The mobile phase A consists of 0.1% Orthophosphoric acid adjusted to pH 2.9 with triethylamine (TEA). The mobile phase B consists of Acetonitrile. Flow rate of the mobile phase was 1.0 mL/min. The HPLC gradient program was set as: (time (min)/% solution B: 0/5, 10/60, 15/80, 17/60, 20/5, 25/5. The column temperature was maintained at 35˚C and the detection was monitored at a wavelength of 230 nm. The injection volume was 10 µL. Buffer: Acetonitrile 80:20; (v/v) was used as diluent. 2.4. Preparation of Standard Solutions A stock solution of ASP, ATV, ATL,and LST standard and sample (7.5 mg/mL of ASP, 1 mg/mL of ATV, 5.0 mg/mL each of ATL and LST) were prepared in diluent. Working solutions 0.075 mg/mL of ASP, 0.01 mg/mL of ATV, 0.05 mg/mL each of ATL and LST were prepared from above stock solution in the diluent for assay deter- mination. Copyright © 2010 SciRes. AJAC 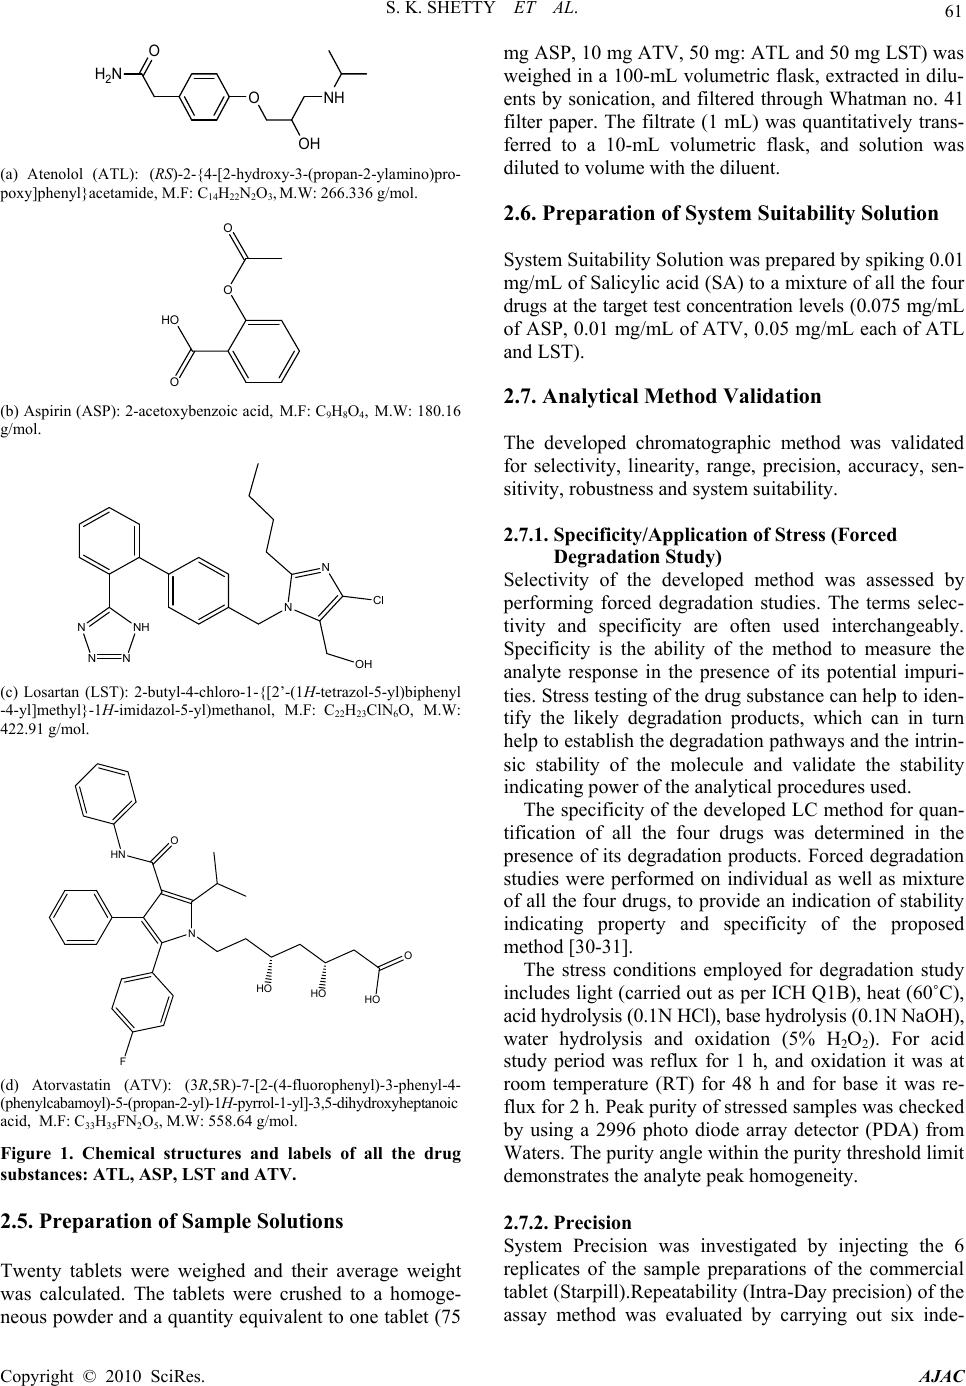 S. K. SHETTY ET AL. 61 O H 2 N ONH OH (a) Atenolol (ATL): (RS)-2-{4-[2-hydroxy-3-(propan-2-ylamino)pro- poxy]phenyl}acetamide, M.F: C14H22N2O3, M.W: 266.336 g/mol. O HO O O (b) Aspirin (ASP): 2-acetoxybenzoic acid, M.F: C9H8O4, M.W: 180.16 g/mol. OH N N NH NN N Cl (c) Losartan (LST): 2-butyl-4-chloro-1-{[2’-(1H-tetrazol-5-yl)biphenyl -4-yl]methyl}-1H-imidazol-5-yl)methanol, M.F: C22H23ClN6O, M.W: 422.91 g/mol. O HO HO HO N HN O F (d) Atorvastatin (ATV): (3R,5R)-7-[2 -(4-fluo rophenyl)-3-ph enyl-4- (phenylcabamoyl)-5-(propan-2-yl)-1H-pyrrol-1-yl]-3,5-dihydroxyheptanoic acid, M.F: C33H35FN2O5, M.W: 558.64 g/mol. Figure 1. Chemical structures and labels of all the drug substances: ATL, ASP, LST and ATV. 2.5. Preparation of Sample Solutions Twenty tablets were weighed and their average weight was calculated. The tablets were crushed to a homoge- neous powder and a quantity equivalent to one tablet (75 mg ASP, 10 mg ATV, 50 mg: ATL and 50 mg LST) was weighed in a 100-mL volumetric flask, extracted in dilu- ents by sonication, and filtered through Whatman no. 41 filter paper. The filtrate (1 mL) was quantitatively trans- ferred to a 10-mL volumetric flask, and solution was diluted to volume with the diluent. 2.6. Preparation of System Suitability Solution System Suitability Solution was prepared by spiking 0.01 mg/mL of Salicylic acid (SA) to a mixture of all the four drugs at the target test concentration levels (0.075 mg/mL of ASP, 0.01 mg/mL of ATV, 0.05 mg/mL each of ATL and LST). 2.7. Analytical Method Validation The developed chromatographic method was validated for selectivity, linearity, range, precision, accuracy, sen- sitivity, robustness and system suitability. 2.7.1. Specificity/Application of Stress (Forced Degradation Study) Selectivity of the developed method was assessed by performing forced degradation studies. The terms selec- tivity and specificity are often used interchangeably. Specificity is the ability of the method to measure the analyte response in the presence of its potential impuri- ties. Stress testing of the drug substance can help to iden- tify the likely degradation products, which can in turn help to establish the degradation pathways and the intrin- sic stability of the molecule and validate the stability indicating power of the analytical procedures used. The specificity of the developed LC method for quan- tification of all the four drugs was determined in the presence of its degradation products. Forced degradation studies were performed on individual as well as mixture of all the four drugs, to provide an indication of stability indicating property and specificity of the proposed method [30-31]. The stress conditions employed for degradation study includes light (carried out as per ICH Q1B), heat (60˚C), acid hydrolysis (0.1N HCl), base hydrolysis (0.1N NaOH), water hydrolysis and oxidation (5% H2O2). For acid study period was reflux for 1 h, and oxidation it was at room temperature (RT) for 48 h and for base it was re- flux for 2 h. Peak purity of stressed samples was checked by using a 2996 photo diode array detector (PDA) from Waters. The purity angle within the purity threshold limit demonstrates the analyte peak homogeneity. 2.7.2. Precision System Precision was investigated by injecting the 6 replicates of the sample preparations of the commercial tablet (Starpill).Repeatability (Intra-Day precision) of the assay method was evaluated by carrying out six inde- Copyright © 2010 SciRes. AJAC  62 S. K. SHETTY ET AL. pendent assays of the commercial tablets (0.075 mg/mL of ASP, 0.05 mg/mL of ATL and LST, 0.010 mg/mL of ATV test concentration) against qualified reference standard and calculating the % RSD of the assay results. Intermediate Precision (Inter-Day) was evaluated by carrying out the experiment with a different analyst, dif- ferent column on different day and estimating the % RSD of the result obtained. 2.7.3. Sensitivity Sensitivity was determined by establishing the Limit of detection (LOD) and Limit of quantitation (LOQ) for ASP, ATV, ATL, and LST estimated at a signal-to-noise ratio of 3:1 and 10:1 respectively, by injecting a series of dilute solutions with known concentration. The precision study was also carried out at the LOQ level by injecting six individual preparations of ASP, ATV, ATL, and LST, calculated the % RSD for the areas of each drug. 2.7.4. Linearity Linearity solutions were prepared from stock solution at five concentration levels from 50 to 200% of analyte concentrations (37.5 to 150 µg/mL for ASP, 5.0 to 20 µg/mL for ATV and 25.0 to 100 µg/ml for ATL and LST). The peak area versus concentration data was col- lected and performed regression analysis by the method of least squares. The Correlation coefficient, Slope & y-intercept values were calculated from the calibration plot obtained. 2.7.5. Accuracy The accuracy of the method was determined by measur- ing the recovery of the drugs by the method of standard additions. Known amounts of each drug corresponding to 50,100, and 150% of the target test concentrations (0.075 mg/mL of ASP, 0.01 mg/mL of ATV, 0.05 mg/mL each of ATL and LST) were added to a placebo mixture to determine whether the exccipients present in the formu- lation led to positive or negative interferences. Each set of additions was repeated three times at each level. Ex- traction sample preparation procedure is followed and assayed against qualified reference standard. The accu- racy was expressed as the percentage of the analytes re- covered by the assay. 2.7.6. Robustness To determine the robustness of the developed method, experimental conditions were deliberately changed and the relative standard deviation for replicate injections of ASP, ATV, ATL and LST peaks and the USP resolution factor between ASP and SA peaks were evaluated. The mobile phase flow rate was 1.0 mL/min. This was changed by 0.1 units to 1.1 and 1.2 mL/min. The effect of column temperature was studied at 40˚C and 30˚C instead of 35˚C. The effect of buffer pH was studied at pH 2.8 and 3.0. 2.7.7. Solution Stability and Mobile Phase Stability The solution stability of ASP, ATV, ATL and LST was carried out by leaving the test solution in tightly capped volumetric flasks at room temperature for 48 h and as- sayed at 6 h interval, against the freshly prepared stan- dard solution. The mobile phase stability was carried out by assaying the freshly prepared sample solution against the freshly prepared standard at 6 h interval up to 48 h. The percentage of RSD of assay of ASP, ATV, ATL and LST was calculated for the study period during mobile phase and solution stability experiments. 3. Results and Discussions 3.1. Method Development and Optimization All the four drug solutions were prepared in diluent at a concentration of 100 µg/mL and scanned in UV-Visible spectrometer; all the drugs were having UV maxima at around 230 nm. Hence detection at 230 nm was selected for method development purpose. The main analytical challenge during development of a new method was obtaining adequate retention of the polar parent compound, Atenolol (ATL) while maintain- ing a reasonable elution time for the less-polar Atorvas- tatin (ATV) and to separate one of the degradation impu- rity Salicylic acid (SA) from the ASP peak. To achieve this, Water and Acetonitrile (50:50 v/v) mobile phase, on a C18 stationary phase with a 25 cm length, 4.6 mm ID and 5µm particle size were investi- gated. Experiments were also performed using the col- umns of varying lengths from 250 to 100 mm. Different mobile phase compositions containing phosphate buffer and Acetonitrile (50:50-20:80 v/v) were also tried. But was unsuccessful in getting good peak shapes for all the peaks. Although good separation was achieved with 0.1% phosphoric acid: Acetonitrile in the ratio of 50:50 (v/v), Atorvastatin peak symmetry was found to be greater than 2.0. The asymmetry of the Atorvastatin peak was im- proved by addition of Triethylamine (TEA) and adjusting the mobile phase pH to 2.9 in the aqueous phase. The chromatographic separation with better peak shape was achieved using a mixture of aqueous 0.1% Orthophos- phoric acid and Acetonitrile in the ratio of 50:50 (v/v). The columns, 250, 150 and 125 mm × 4.6 mm, 5 μm of varied lengths were tried but 150 × 4.6 mm, 5 μm C18 Column gave reasonable retention for all the peaks. But when degradation samples were injected with these con- ditions, one of the degradation impurity of ASP namely salicylic acid (SA) was not separated from the ASP Peak. Then method was optimized to separate all the de- gradants from the main peaks by changing to Gradient mode. Several gradient conditions were tried before op- timizing the final gradient programme as: time (min)/% solution B: 0/5, 10/60, 15/80, 17/60, 20/5, 25/5 Effect of Copyright © 2010 SciRes. AJAC 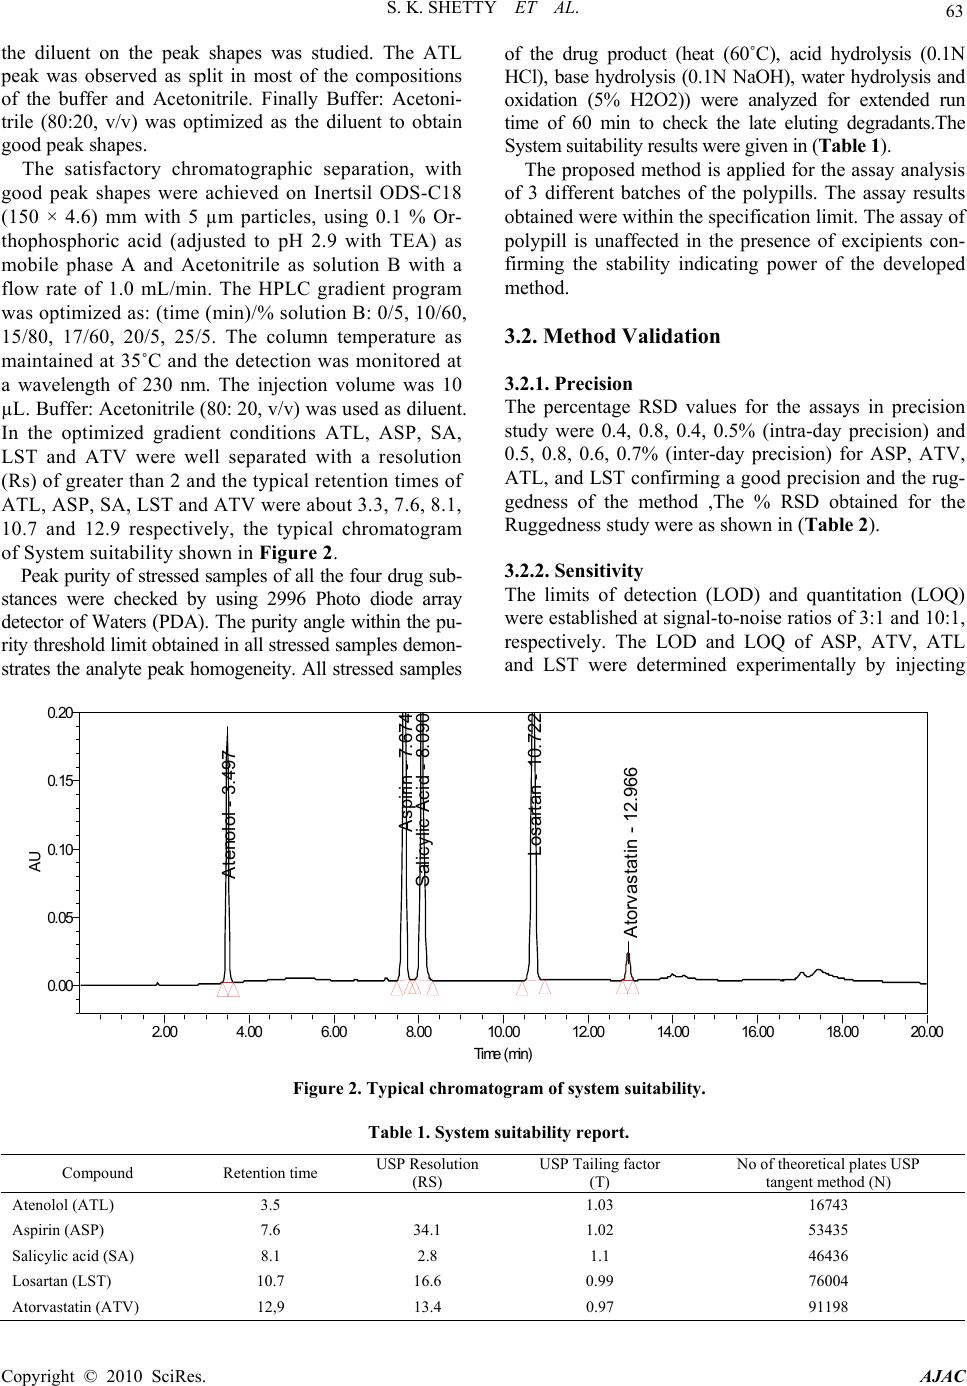 S. K. SHETTY ET AL. Copyright © 2010 SciRes. AJAC 63 the diluent on the peak shapes was studied. The ATL peak was observed as split in most of the compositions of the buffer and Acetonitrile. Finally Buffer: Acetoni- trile (80:20, v/v) was optimized as the diluent to obtain good peak shapes. The satisfactory chromatographic separation, with good peak shapes were achieved on Inertsil ODS-C18 (150 × 4.6) mm with 5 µm particles, using 0.1 % Or- thophosphoric acid (adjusted to pH 2.9 with TEA) as mobile phase A and Acetonitrile as solution B with a flow rate of 1.0 mL/min. The HPLC gradient program was optimized as: (time (min)/% solution B: 0/5, 10/60, 15/80, 17/60, 20/5, 25/5. The column temperature as maintained at 35˚C and the detection was monitored at a wavelength of 230 nm. The injection volume was 10 µL. Buffer: Acetonitrile (80: 20, v/v) was used as diluent. In the optimized gradient conditions ATL, ASP, SA, LST and ATV were well separated with a resolution (Rs) of greater than 2 and the typical retention times of ATL, ASP, SA, LST and ATV were about 3.3, 7.6, 8.1, 10.7 and 12.9 respectively, the typical chromatogram of System suitability shown in Figure 2. Peak purity of stressed samples of all the four drug sub- stances were checked by using 2996 Photo diode array detector of Waters (PDA). The purity angle within the pu- rity threshold limit obtained in all stressed samples demon- strates the analyte peak homogeneity. All stressed samples of the drug product (heat (60˚C), acid hydrolysis (0.1N HCl), base hydrolysis (0.1N NaOH), water hydrolysis and oxidation (5% H2O2)) were analyzed for extended run time of 60 min to check the late eluting degradants.The System suitability results were given in (Table 1). The proposed method is applied for the assay analysis of 3 different batches of the polypills. The assay results obtained were within the specification limit. The assay of polypill is unaffected in the presence of excipients con- firming the stability indicating power of the developed method. 3.2. Method Validation 3.2.1. Precision The percentage RSD values for the assays in precision study were 0.4, 0.8, 0.4, 0.5% (intra-day precision) and 0.5, 0.8, 0.6, 0.7% (inter-day precision) for ASP, ATV, ATL, and LST confirming a good precision and the rug- gedness of the method ,The % RSD obtained for the Ruggedness study were as shown in (Table 2). 3.2.2. Sensitivity The limits of detection (LOD) and quantitation (LOQ) were established at signal-to-noise ratios of 3:1 and 10:1, respectively. The LOD and LOQ of ASP, ATV, ATL and LST were determined experimentally by injecting Atenolol - 3.497 Aspirin - 7.674 Salicylic Acid - 8.090 Losartan - 10.722 Atorvastatin - 12.966 AU 0.00 0.05 0.10 0.15 0.20 Time (min) 2.00 4.00 6.008.0010.00 12.00 14.00 16.00 18.00 20.00 Figure 2. Typical chromatogram of system suitability. Table 1. System suitability report. Compound Retention time USP Resolution (RS) USP Tailing factor (T) No of theoretical plates USP tangent method (N) Atenolol (ATL) 3.5 1.03 16743 Aspirin (ASP) 7.6 34.1 1.02 53435 Salicylic acid (SA) 8.1 2.8 1.1 46436 Losartan (LST) 10.7 16.6 0.99 76004 Atorvastatin (ATV) 12,9 13.4 0.97 91198  64 S. K. SHETTY ET AL. Table 2. Results of intermediate precision. S. No Parameter Variation % RSD for Assay ASP ATV ATL LST 1 Different System (a) Waters 2695 Alliance system (b) Agilent 1100 series VWD system 0.7% 0.6% 0.3% 0.8% 0.5% 0.6% 0.7% 0.9% 2 Different Column (a) B.No: 0014 (b)B.No:00118 0.4% 0.5% 0.5% 0.4% 0.7% 0.6% 0.6% 0.6% 3 Different Analyst (a) Analyst-1 (b) Analyst-2 0.5% 0.4% 0.9% 0.7% 0.6% 0.6% 0.6% 0.8% 4 Different Days (Interday precision) (a) Day-1 (b) Day-2 (c) Day-3 0.4% 0.5% 0.6% 0.9% 0.8% 0.7% 0.3% 0.5% 0.4% 0.5% 0.6% 0.4% each drug six times. The LOD for ASP, ATV, ATL and LST were 0.1, 0.2, 0.15 and 0.02 µg/mL respectively. The LOQ for ASP, ATV, ATL and LST were 0.3, 0.7, 0.4 and 0.06 µg/mL, respectively. 3.2.3. Linearity The linear ranges were from (37.5 to 150 µg/mL for ASP, 5.0 to 20 µg/mL for ATV and 25.0 to 100 µg/mL for ATL and LST).The correlation coefficient obtained was greater than 0.999. The Slope and the Intercept value obtained from the linear regression graph is as shown in (Table 3). The result shows an excellent correlation existed between the peak area and concentration of the analyte in the range 50-200% of analyte concentration. 3.2.4. Accuracy The percentage recovery of the results obtained is listed in Table 4, the results indicate the method enables highly accurate simultaneous determination of the all the four drugs in the polypill combination. 3.2.5. Robustness Close observation of analysis results for deliberately changed chromatographic conditions (flow rate, column temperature and pH of the mobile phase) revealed that the resolution between closely eluting peaks, namely ASP and SA was always greater than 2.0 and also there was not much effect on the peak shapes, illustrating the robustness of the method (Table 5). 3.2.6. Solution Stability and Mobile Phase Stability The % RSD of assay of Polypill during solution stability and mobile phase stability experiments was within 1.0. No significant changes were observed in the content of ATL, ASP, LST and ATV during the study. The solution stability and mobile phase stability experiments data confirms that sample solutions and mobile phase used during assay determination were stable up to the study period of 48 h. Table 3. Results of Linearity study for drug substance. Atenolol (ATL) Aspirin (ASP) Losartan (LST) Atorvastatin (ATV) Calibration Equation Y=8027X-28993 Y=18480X-65531 Y=17299X-38592 Y=1584X-6390 Linearity Range 50-200 % 50-200 % 50-200 % 50-200 % Regression coefficient 0.999 0.999 0.999 0.999 Slope 8027 18480 17299 1584 Intercept -28993 -65531 -38592 -6390 Copyright © 2010 SciRes. AJAC  S. K. SHETTY ET AL. 65 Table 4. Results of accuracy study for drug substance. Analyte Initial Added Concentration RSD Recovery concentration (%) concentration (mg)found (mg) (%) (%) Atenolol (ATL) 50 24.9 24.8 0.23 99.60 100 50.1 49.8 0.28 99.41 150 74.8 74.9 0.22 100.13 Aspirin(ASP) 0 0 0 50 37.4 37.2 0.36 99.46 100 75.1 74.8 0.29 99.60 150 112.3 112.1 0.37 99.82 Losartan(LST) 0 0 0 50 25.2 25.1 0.40 99.60 100 50.1 49.9 0.38 99.62 150 74.8 74.9 0.34 100.13 Atorvastatin(ATV) 0 0 0 50 5.02 5.05 0.40 100.60 100 10.05 9.98 0.28 99.30 150 14.85 14.89 0.18 100.27 Table 5. Results of robustness study. S.No Parameter Variation Resolution (Rs) between ASP and salicylic acid 1 Temperature (± 5˚C of set temperature) (a) At 30°C (b) At 40°C 2.9 2.7 2 Flow rate (± 20% of the set flow) (a) At 0.8 mL min-1 (b) At 1.2 mL min-1 2.9 2.8 3 pH Buffer pH 2.8 pH 3.0 2.9 2.5 3.2.7. Results of Forced Degradation Studies 1) Degradation Behavior Stress studies on combination of all the four drugs under different stress conditions suggested the following degradation behavior. 2) Degradation in Acidic solution The combination of all the four drugs was exposed to 0.1 N HCl at 100°C for 1 h. ATL, ASP and ATV showed considerable degradation. The drugs gradually under- gone degradation with time in 0.1 N HCl and prominent degradation was observed (Figure 3(a)). 3) Degradation in Basic solution The combination of all the four drugs was exposed to 0.1 N NaOH under reflux for 2 h. ASP and ATV has shown significant sensitivity towards the treatment of 0.1 N NaOH. The drug undergone degradation immediately in 0.1 N NaOH and prominent degradation was observed for ASP with the conversion to SA (Figure 3(b)). 4) Oxidative Conditions The combination of all the four drugs was exposed to 5% hydrogen peroxide at room temperature for 48 h. ASP, LST and ATV has shown significant sensitivity towards the treatment of 5% hydrogen peroxide and the drugs gradually undergone oxidative degradation with time to yield prominent degradation products (Figure 3(c)). 5) Photolytic Conditions When the combination of all the four drugs was ex- posed to light for an overall illumination of 1.2 million lux hours and an integrated near ultraviolet energy of 200-watt hours/square meter (w/mhr) (in photo stability chamber). Major degradation observed with LST and ATV (Figure 3(d)). 6) Thermal Degradation When the drug product was exposed to dry heat at 60˚C for 8 h, Considerable degradation was observed with ATL and ASP (Figure 3(e)). Accelerated Stability sample: The stability indicating nature of the method was fur- ther confirmed by injecting three month accelerated sta- bility sample and observed that all the degradants were well separated from the main components (Figure 3(f)). Peak purity test results derived from PDA detector, confirmed that the all the four drug components were homogeneous and pure in all the analyzed stress samples. No degradants were observed after 30 min in the ex- tended runtime of 60 min of all the samples. 6) Assay analysis Assay analysis was performed for different batches of the drug product in tablets (n=3), with the targeted ana- lyte concentrations. The assay results obtained for the three Starpill tablets were, STP/002 (99.7% ATL, 99.8% ASP, 100.25 LST and 99.6% ATV), STP/005 (99.67% ATL, 100.3% ASP, 99.4% LST and 99.8% ATV) and STP/011 (100.1% ATL, 99.9% ASP, 99.7% LST and 00.3% ATV) depicted in (Table 6). 1 Copyright © 2010 SciRes. AJAC 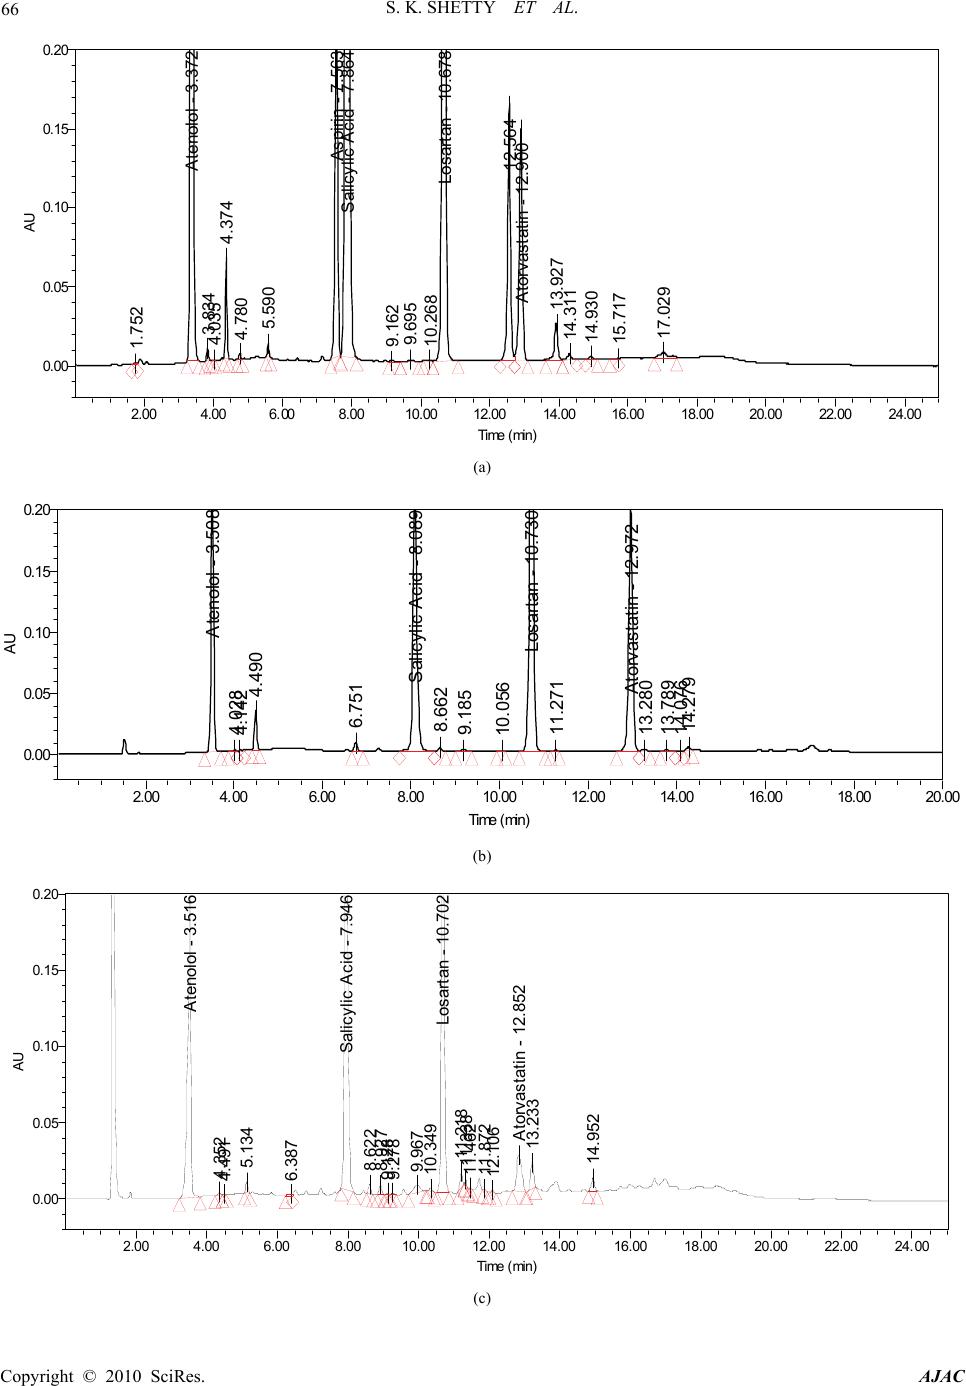 S. K. SHETTY ET AL. Copyright © 2010 SciRes. AJAC 66 1.752 Atenolol - 3.372 3.834 4.035 4.374 4.780 5.590 Aspirin - 7.563 Salicylic Acid - 7.864 9.162 9.695 10.268 Losartan - 10.678 12.564 Atorvastatin - 12.900 13.927 14.311 14.930 15.717 17.029 AU 0.00 0.05 0.10 0.15 0.20 Time min 2.004.00 6.008.00 10.00 12.0014.00 16.0018.00 20.0022.0024.00 (a) Atenolol - 3.50 4.028 4.142 4.490 6.751 Salicylic Acid - 8.089 8.662 9.185 10.056 Losartan - 10.730 11.271 Atorvastatin - 12.972 13.280 13.789 14.076 14.279 AU 0.00 0.05 0.10 0.15 0.20 Time (min) 2.00 4.00 6.00 8.00 10.00 12.00 14.00 16.00 18.00 20.00 (b) Atenolol - 3.516 4.352 4.491 5.134 6.387 Salicylic Acid - 7.946 8.622 8.927 9.128 9.278 9.967 10.349 Losartan - 10.702 11.218 11.338 11.462 11.872 12.106 Atorvastatin - 12.852 13.233 14.952 0.00 0.05 0.10 0.15 0.20 Time (min) 2.004.006.008.00 10.00 12.00 14.0016.00 18.00 20.00 22.00 24.00 (c) 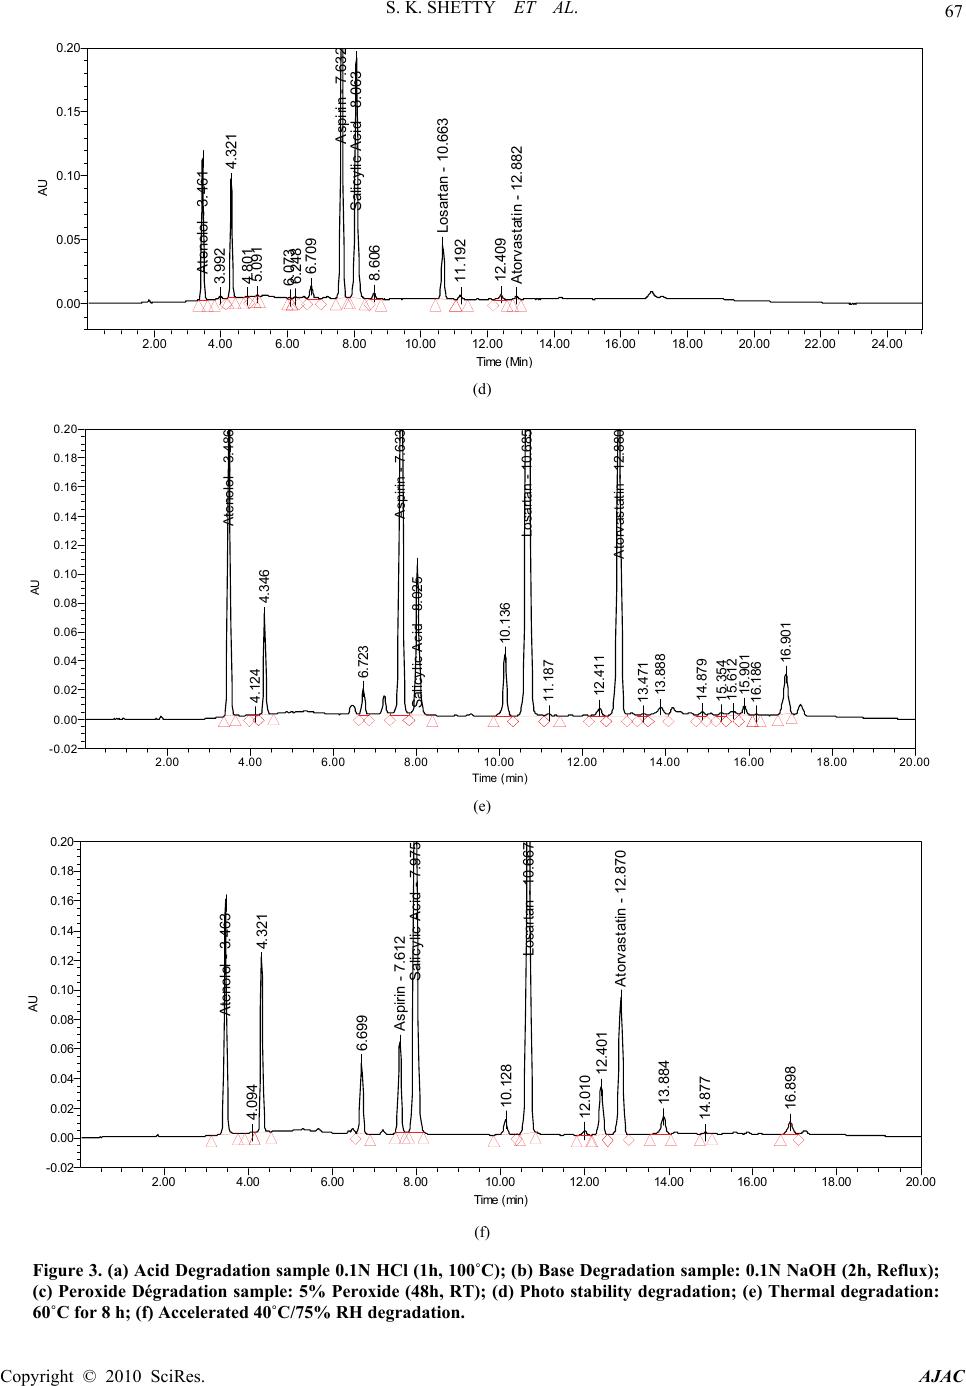 S. K. SHETTY ET AL. 67 Atenolol - 3.461 3.992 4. 321 4. 801 5. 091 6. 073 6. 248 6.709 Aspirin - 7.63 Salicylic Acid - 8.063 8. 606 Losartan - 10.663 11. 192 12. 409 Atorvastatin - 12.882 AU 0.00 0.05 0.10 0.15 0.20 Time Min 2.00 4.006.00 8.0010.0012.00 14.00 16.0018.00 20.00 22.0024.00 (d) Atenolol - 3.486 4.124 4.34 6 6.723 Aspirin - 7.633 Salicylic Acid - 8.025 10.136 Losartan - 10.685 11.187 12.411 Atorvastatin - 12.880 13.471 13.888 14.879 15.354 15.612 15.901 16.186 16.901 AU -0.02 0.00 0.02 0.04 0.06 0.08 0.10 0.12 0.14 0.16 0.18 0.20 Time min 2.00 4.00 6.00 8.0010.00 12.00 14.0016.0018.0020.00 (e) Atenolol - 3.463 4.094 4.321 6. 699 Aspirin - 7.612 Salicylic Acid - 7.975 10. 128 Losartan - 10.667 12. 010 12. 401 Atorvastatin - 12.870 13. 884 14. 877 16. 898 AU -0.02 0.00 0.02 0.04 0.06 0.08 0.10 0.12 0.14 0.16 0.18 0.20 Time (min) 2.00 4.00 6.00 8.00 10.0012.00 14.0016.00 18.0020.00 (f) Figure 3. (a) Acid Degradation sample 0.1N HCl (1h, 100˚C); (b) Base Degradation sample: 0.1N NaOH (2h, Reflux); (c) Peroxide Dégradation sample: 5% Peroxide (48h, RT); (d) Photo stability degradation; (e) Thermal degradation: 60˚C for 8 h; (f) Accelerated 40˚C/75% RH degradation. Copyright © 2010 SciRes. AJAC  S. K. SHETTY ET AL. Copyright © 2010 SciRes. AJAC 68 Table 6. Batch analysis for starpill drug product. Ba N y) tch o: ATL (%assay) ASP (%assay) LST (%assay) ATV (%assa S TP/002 99.7 99.8 100.2 99.6 ST5 P/0099.6 100.3 99.4 99.8 STP/011 100.1 99.9 99.7 100.3 3licaof ththod tabilityy stablish the stability indicating nature of the method. RP-LC method developed for simul- neous quantitative assay of ASP, ATV, ATL and LST the management of Un tates Pharmacopeia laboratory-India for supporting th erences d M. R. Law, “A Strategy to Reduce Car- diovascular Disease by More Than 80 Percent,” British Risk Factors in Middle-Aged Individuals [4] M. R. Law and N. J. Wald, “Risk factor thresholds: their existence under scrutiny,” British Medical Journal, Vol. d S. Singh, “LC and LC-MS Davidson, R. J. Goldstein, 7, 2005, pp. 2571-2574. .3. Apption e Meo St Stud Accelerated conditions stability studies are performed to e Accelerated conditions (temperature 40 ± 2˚C, relative humidity 75 ± 5%) stored sample of the four drug com- binations were analyzed by use of the developed LC method for period of 3 month both initially and after intervals of 1, 2, and 3, months .The results obtained clearly indicates that the method is able to separate all the drug-drug interaction impurities or any other degra- dation impurities formed during the storage conditions., indicating the method was stability-indicating and highly suitable for drug stability studies and for monitoring the quality of the Polypill. 3.4. Conclusions The single gradient ta in Polypill is precise, accurate and specific. The method was completely validated showing satisfactory data for all the method validation parameters tested. The devel- oped method is stability indicating and can be used for the routine analysis of production samples and also to check the stability of Polypill tablets. 4. Acknowledgements The authors wish to thank ited is [13] E. R. Montgomery, S. Taylor, J. Segretario, et al., “De- velopment and Validation of a Reversed-Phase Liquid Chromatographic Method for Analysis of Aspirin and Warfarin in a Combination Tablet Formulation,” Journal S work. 5. Ref [1] N. J. Wald an of Ph Medical Journal, Vol. 326, No. 7404, 2003, p. 1419. [2] G. Sanz and V. Fuster, “Fixed-Dose Combination Therapy and Secondary Cardiovascular Prevention: Rationale, [15] S. Erturk, A. E. Sevinc, L. Ersoy and S. Ficicioglu, “HPLC Method for the Determination of Atorvastatin and its Impurities in Bulk Drug and Tablets,” Journal of Pharmaceutical and Biomedical Analysis, Vol. 33, 2003, Selection of Drugs and Target Population,” Nature Clinical Practice Cardiovascular Medicine, Vol. 6, No. 2, 2009, pp. 101-110. [3] S. Yusuf, P. Pais, R. Afzal, et al., “Effects of a Polypill (Polycap) on without Cardiovascular Disease (TIPS): A Phase II, Double-Blind, Randomised Trial,” Lancet, Vol. 373, No. 9672, 2009, pp. 341-351. 324, No. 7353, 2002, pp. 570-576. [5] V. Kumar, R. P. Shah an Methods for the Investigation of Polypills for the Treat- ment of Cardiovascular Diseases: Part.1Separation of Ac- tive Compo,” Journal of Pharmaceutical and Biomedical Analysis, Vol. 47, 2008, pp. 508-515. [6] V. Kumar, S. Malik and S. Singh, “Polypill for the treat- ment of cardiovascular diseases: Part 2. LC-MS/TOF characterization of interaction/degradation products of atenolol/lisinopril,” Journal of Pharmaceutical and Bio- medical Analysis, Vol. 48, No. 3, 2008, pp. 619-628. [7] M. C. Koester, “An Overview of the Physiology and Phar- macology of Aspirin and Nonsteroidal Anti-Inflammatory Drugs,” Journal of Athletic Training, Vol. 28, No. 3, 1993, pp. 252-254, 256-259. [8] S. P. Clissold, “Aspirin and Related Derivatives of Sali- cylic Acid,” Drugs, Vol. 32, Supplement 4, 1986, pp. 8- 26. [9] R. G. Bakker-Arkema, M. H. “Efficacy and Safety of a New HMG-CoA Reductase Inhibitor, Atorvastatin, in Patients with Hypertriglyceri- demia,” Journal of the American Medical Association, Vol. 275, No. 2, 1996, pp. 128-133. [10] A. N. Wadworth, D. Murdoch, R. N. Brogden, “Atenolol: A Reappraisal of its Pharmacological Properties and Therapeutic Use in Cardiovascular Disorders,” Drugs, Vol. 42, No. 3, 1991, pp. 468-510. [11] B. M. Psaty, T. D. Koepsell, J. P. LoGerfo, et al., “B-Blockers and Primary Prevention of Coronary Heart Disease in Patients with High Blood Pressure,” Journal of the American Medical Association, Vol. 261, No. 14, 1989, pp. 2087-2094. [12] K. L. Goa and A. J. Wag, “Losartan Potassium: A Re- view of its Pharmacology, Clinical Efficacy and Toler- ability in the Management of Hypertension,” Drugs, Vol. 51, No. 5, 1996, pp. 820-845. armaceutical and Biomedical Analysis, Vol. 15, No. 1, 1996, pp. 73-82. [14] D. G. Sankar, M. S. M. Raju, K. Sumanth and P. V. M. Latha, “Asian HPLC Method for Estimation of Atorvas- tatin in Pure and Pharmaceutical Dosage Form,” Journal of Chemistry, Vol. 1 pp. 1017-1023. [16] A. Puratchikody, R. Valarmathy, P. Shiju, “RP-HPLC Determination of Atorvastatin Calcium in Solid Dosage Forms,” Journal of Pharmaceutical Reviews, 2003, pp. 79-80.  S. K. SHETTY ET AL. 69 l. 63, No. 6, 2006, pp. 471-476. ography B: d Communications in Mass Chemistry 005, pp. 182-186. mination of “Simultaneous Spectrophotometric Determi- ultaneous Determina- ous Determination of Losar- [17] B. Stanisz and L. Kania, “Validation of HPLC Method for Determination of Atorvastatin in Tablets and for Monitoring in Solid Phase,” Acta Poloniae Pharmaceu- tica, Vo [18] G. Bahrami, B. Mohammadi, S. Mirzaeei and A. Kiani, “Determination of Atorvastatin in Human Serum by Re- verse Phase High Performance Liquid Chromatography with UV Detection,” Journal of ChromatAna- lytical Technologies in the Biomedical and Life Sciences, Vol. 826, 2005, pp. 41-45. [19] M. Jemal, Z. Ouyang, B. C. Chen and D. Teitz, “Quanti- tation of Atorvastatin and its Bio-Transformation Products in Human Serum by HPLC with Electro Spray Tandem Mass Spectrometry,” Rapi Spectrometry, Vol. 13, 1999, pp. 1003-1015. [20] M. Hermann, H. Christensen and J. L. Reubsaet, “Deter- mination of Atorvastatin and Metabolites in Human Plasma with Solid Phase Extraction Followed by LC- Tandem MS,” Analytical and Bioanalytical, ta Vol. 382, No. 5, 2005, pp. 1242-1249. [21] S. R. Dhaneshwar, S. Yadav, A. Mhaske and S. Kadam, “HPTLC Method for Determination of Content Uni- formity of Atorvastatin Calcium Tablets,” Indian Journal of Pharmaceutical Sciences, Vol. 67, 2 [22] C. V. N. Prasad, C. Parihar, K. Sunil and P. Parimoo, “Simultaneous Determination of Amiloride, Hydrochloro- thiazide and Atenolol in Combined Formulation by Derivative Spectroscopy,” Journal of Pharmaceutical and Biomedical Analysis, Vol. 17, 1998, pp. 877-884. [23] S. M. Al-Ghannam, “A Simple Spectrophotometric Method for the Determination of B-Blockers in Dosage Forms,” Journal of Pharmaceutical and Biomedical Analysis, Vol. 40, No. 1, 2006, pp. 151-156. [24] A. P. Agrekar and S. G. Powar, “Reverse Phase High Performance Liquid Chromatographic Deter Ramipril and Amlodipine in Tablets,” Journal of Phar- maceutical and Biomedical Analysis, Vol. 21, 2000, pp. 1137-1142. [25] M. B. Shankar, F. A. Metha, K. K. Bhatt, R. S. Metha and M. Geetha, nation of Losartan Potassium and Hydrochlorothiazide in Tablets,” Indian Journal of Pharmaceutical Sciences, Vol. 65, No. 2, 2003, pp. 167-170. [26] C. F. Pedroso, J. G. de Oliveira, F. R. Campos, et al., “A Validated RP-LC Method for Sim tion of Losartan Potassium and Amlodipine Besilate in Pharmaceutical Preparations,” Chromatography, Vol. 69, Supplement 2, pp. 201-206. [27] D. D. Rao, N. V. Satyanarayana, S. S. Sait, Y. R. Reddy and K. Mukkanti, “Simultane n Potassium, Atenolol and Hydrochlorothiazide in Phar- maceutical Preparations by Stability-Indicating UPLC,” Chromatography, Vol. 70, No. 4, 2009, pp. 647-651. [28] “ICH Stability Testing of New Drug Substances and Products Q1A (R2),” International Conference on Har- monization, IFPMA, Geneva, 2003. [29] “ICH guidelines on Validation of Analytical procedures, Text and Methodology Q2 (R1),” FDA, Published in the ention, Rockville, 2009. Federal Register 60, 1995. [30] “United States Pharmacopoeia,” 32nd Edition, United States Pharmacopeial Conv [31] M. Bakshi and S. Singh, “Development of Validated Stability-Indicating Assay Methods-Critical Review,” Journal of Pharmaceutical and Biomedical Analysis, Vol. 28, No. 6, 2002, pp. 1011-1040. Copyright © 2010 SciRes. AJAC
|