 Communications and Network, 2010, 2, 200-206 doi:10.4236/cn.2010.23029 Published Online May 2010 (http://www.SciRP.org/journal/cn) Copyright © 2010 SciRes. CN Performance Evaluation of Java Web Services: A Developer’s Perspective Sanjay Ahuja, Je-Loon Yang School of Computing, University of North Florida, Jacksonville, Florida, USA E-mail: {sahuja, n00168553 }@unf.edu Received March 7, 2010; revised July 2, 2010; accepted July 3, 2010 Abstract As the population of the Internet grows rapidly the development of web technologies becomes extremely important. For the evolvement of Web 2.0, web services are essential. Web services are programs that allow computers of different platforms on the web to interactively communicate without the need of extra data for human reading interfaces and formats such as web page structures. Since web service is a future trend for the growth of internet, the tools that are used for development is also important. Although there are many choices of web service frameworks to choose from, developers should choose the framework that fits best to their application based on performance, time and effort for the framework. In this project, we chose four common frameworks to compare them in both qualitative and quantitative metrics. After running the tests, the results are statistically analyzed by SAS. Keywords: Web Service, Framework, Performance, Java, Developer 1. Introduction For going on trips to other states or countries, the person usually requires to buy airplane tickets, rent a car, and make reservations for hotels to stay at. When dealing with airplane tickets, most of the time the person even has to buy several tickets for some stops instead of a ticket that takes the person directly to the final destina- tion. Looking up the airplane arrival and departure times to connect each flight might take hours of searching and planning. What if there was a virtual agent that could do this all in just a few seconds? So usually people would look for agents to do this for them. But what if this agent was actually is actually a virtual agent online. If the per- son just enters the location he wants to start from, the destination, the desired time for departure or arrival, and all the information required into the computer, in a snap, the computer shows all the results for the person to choose from and purchase the tickets. Even better, such virtual agents could have possibilities to also show information of the car rentals and hotels at the destination and reserve them for you. By using this type of virtual agent, could save much effort and time and can also be more accurate than human agents. Such technology relies on the development and widespread of web services. Instead of developing a web service application from scratch, there are many open source frameworks that make development much easier. Which of these frame- works would be a better choice for web service application development? This study compares four popular open source frameworks both qualitatively and quantitatively by doing several tests and analysis. The four frameworks are Apache Axis, JBossWS, XFire, and Hessian. More introductions of web services are done in Section 2. Section 3 describes the four frameworks that are used in this study. In Section 4, the metrics that are used to measure the frameworks are explained in more detail. Section 5 introduces the statistical analysis methods that are use to analyze the measured results. In Section 6, the test results are shown and analyzed. The conclusions are in Section 7. 2. Web Service Frameworks Since web services are designed to transfer data in com- mon ways, several companies and groups developed web service frameworks for the convenience of web service developers so that they do not need to write a complete web service from scratch. Some of the popular frame- works are Apache Axis, JBossWS, Codehaus XFire, and Caucho Hessian. In this section, these frameworks are going to be introduced. 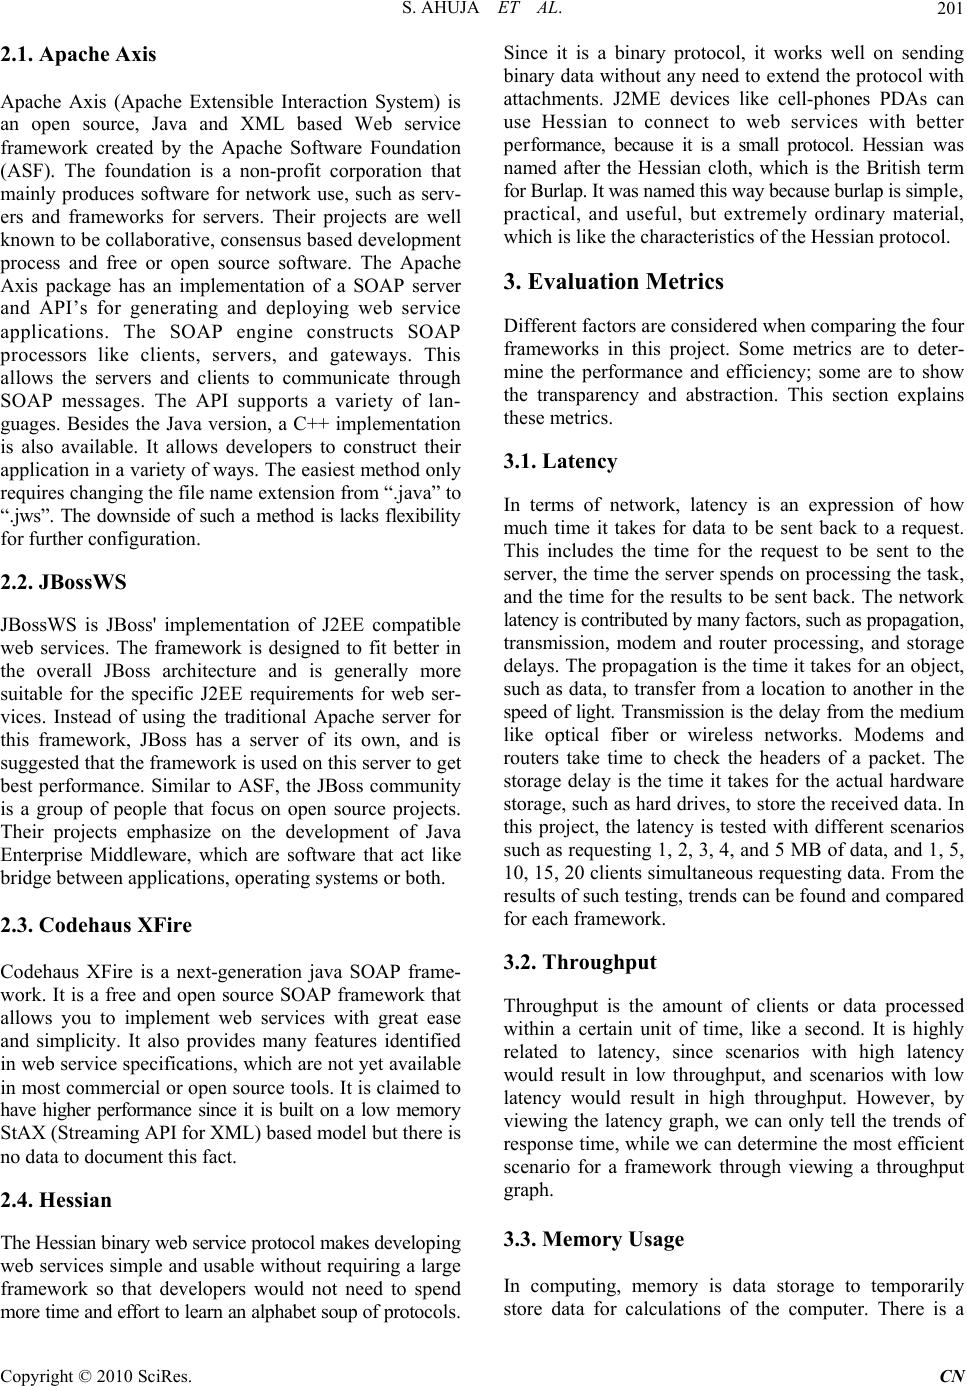 S. AHUJA ET AL.201 2.1. Apache Axis Apache Axis (Apache Extensible Interaction System) is an open source, Java and XML based Web service framework created by the Apache Software Foundation (ASF). The foundation is a non-profit corporation that mainly produces software for network use, such as serv- ers and frameworks for servers. Their projects are well known to be collaborative, consensus based development process and free or open source software. The Apache Axis package has an implementation of a SOAP server and API’s for generating and deploying web service applications. The SOAP engine constructs SOAP processors like clients, servers, and gateways. This allows the servers and clients to communicate through SOAP messages. The API supports a variety of lan- guages. Besides the Java version, a C++ implementation is also available. It allows developers to construct their application in a variety of ways. The easiest method only requires changing the file name extension from “.java” to “.jws”. The downside of such a method is lacks flexibility for further configuration. 2.2. JBossWS JBossWS is JBoss' implementation of J2EE compatible web services. The framework is designed to fit better in the overall JBoss architecture and is generally more suitable for the specific J2EE requirements for web ser- vices. Instead of using the traditional Apache server for this framework, JBoss has a server of its own, and is suggested that the framework is used on this server to get best performance. Similar to ASF, the JBoss community is a group of people that focus on open source projects. Their projects emphasize on the development of Java Enterprise Middleware, which are software that act like bridge between applications, operating systems or both. 2.3. Codehaus XFire Codehaus XFire is a next-generation java SOAP frame- work. It is a free and open source SOAP framework that allows you to implement web services with great ease and simplicity. It also provides many features identified in web service specifications, which are not yet available in most commercial or open source tools. It is claimed to have higher performance since it is built on a low memory StAX (Streaming API for XML) based model but there is no data to document this fact. 2.4. Hessian The Hessian binary web service protocol makes developing web services simple and usable without requiring a large framework so that developers would not need to spend more time and effort to learn an alphabet soup of protocols. Since it is a binary protocol, it works well on sending binary data without any need to extend the protocol with attachments. J2ME devices like cell-phones PDAs can use Hessian to connect to web services with better performance, because it is a small protocol. Hessian was named after the Hessian cloth, which is the British term for Burlap. It was named this way because burlap is simple, practical, and useful, but extremely ordinary material, which is like the characteristics of the Hessian protocol. 3. Evaluation Metrics Different factors are considered when comparing the four frameworks in this project. Some metrics are to deter- mine the performance and efficiency; some are to show the transparency and abstraction. This section explains these metrics. 3.1. Latency In terms of network, latency is an expression of how much time it takes for data to be sent back to a request. This includes the time for the request to be sent to the server, the time the server spends on processing the task, and the time for the results to be sent back. The network latency is contributed by many factors, such as propagation, transmission, modem and router processing, and storage delays. The propagation is the time it takes for an object, such as data, to transfer from a location to another in the speed of light. Transmission is the delay from the medium like optical fiber or wireless networks. Modems and routers take time to check the headers of a packet. The storage delay is the time it takes for the actual hardware storage, such as hard drives, to store the received data. In this project, the latency is tested with different scenarios such as requesting 1, 2, 3, 4, and 5 MB of data, and 1, 5, 10, 15, 20 clients simultaneous requesting data. From the results of such testing, trends can be found and compared for each framework. 3.2. Throughput Throughput is the amount of clients or data processed within a certain unit of time, like a second. It is highly related to latency, since scenarios with high latency would result in low throughput, and scenarios with low latency would result in high throughput. However, by viewing the latency graph, we can only tell the trends of response time, while we can determine the most efficient scenario for a framework through viewing a throughput graph. 3.3. Memory Usage In computing, memory is data storage to temporarily store data for calculations of the computer. There is a Copyright © 2010 SciRes. CN  S. AHUJA ET AL. 202 wide variety of memory, such as cache memory, flash memory, random access memory (RAM), virtual memory, etc. Either memory, they are all limited in server due to the cost and space. A framework that uses less memory would have an advantage of allowing higher capacity for the server. 3.4. CPU Usage Central Processing Unit (CPU), also known as processor, is a component in a computer used to interpret program instructions and process data. Although it is only able to process one task at a time, when there are multiple tasks to be done, instead of finishing a task then going to an- other, the CPU is designed to switch to other tasks before finishing one if necessary, so that it would act like if it is executing multiple tasks at the same time. However, large tasks might occupy a lot of CPU time, which de- creases the time scheduled for other tasks. A framework that uses less CPU would allow the server to have more time to execute other tasks. 3.5. Source Lines of Code The source lines of code (SLOC) used in a framework can indicate the transparency and abstraction of the framework. The main goal of a framework is to save the developer’s time and effort by not having to write the entire code from scratch. Thus the less lines of code that is required for a framework, the more time and effort is saved by this framework. However, lines of code cannot be exactly accurate since some lines might be long while some lines are short. So the number of files and size of files also is a consideration. 4. Statistical Analysis Methods After retrieving the test data to compare the performances, we need a method to analyze the results. By simply calculating the average response times and making them into a graphs is not sufficient for the analysis. Looking at the average response times 1.5 seconds and 1.6 seconds, we can not be sure if that is a great difference or not. Therefore, statistical analysis methods are required to tell if the difference is significant or not. In this project, the general linear model (GLM) [9] and two-way analysis of variance (two-way ANOVA) is used for statistical analysis. Furthermore, the Statistical Analysis System (SAS) [10] is used as a tool for aiding the calculations of the statistical analyses required. 4.1. The SAS System The SAS system is statistical analysis software that has a wide variety of statistical modules and procedures. They use a fourth-generation programming language (4GL) for their code and the programs are composed by three main components – the data step, the procedure step, and the macro language. The data step is for entering data, like inserting the data in the code or read from data files. The procedure step is the use of the statistical methods and models to analysis the data that was read in the data step. The macro language is for decreasing the redundancy of functions that are used again and again throughout the program. 4.2. The GLM Model The GLM model is a statistical linear model that is used in general cases. It is the foundation of many statistical analyses, such as t-test, ANOVA, Analysis of Covariance (ANCOVA), etc. The easiest case to understand how the GLM model works is the two-variable case. The goal of this analysis is to use a way to accurately describe the information in this plot. Using the GLM model, we try to find a straight line that is closest to all the dots in the plot. This line would be written as: y = b0 + b1x + e, where y is the y-axis variable, x is the x-axis variable, b0 is the intercept (the value of y when x equals 0), b1 is the slope of the straight line, and e is the error. By solving b0 and b1, we can get information about this linear line that describes the dots in the plot. In other cases with more than two variables, the formula can be extended as: y = b0 + b1x1 + b2x2 + b3x3 + ... + bnxn + e, where n is the number of variables of the situation. But the mechanism for solving such problems is the same. 5. Results and Analyses In order to get best results from SAS analysis, each case is tested twenty times. Since four frameworks with five different amounts of clients are tested, there are twenty different cases. Adding the twenty test times for the twenty different cases would result 400 data sets to be calculated by SAS. Besides the amount of clients, the size of data is also considered. With also five different sizes of data sent, there would be twenty cases with a total of 400 data sets. The response time is measured by recording the time right before invoking the web service and recording the time right after the data requested is received then subtracting the time difference. 5.1. Results 5.1.1. Client Scenarios For testing the four different frameworks in different scenarios, web service applications to send out data are created. The five scenarios based on amount of clients for testing performance of the four frameworks are 1 client, 5 clients, 10 clients, 15 clients, and 20 clients each retrieving 1 MB of data. The average response time for Copyright © 2010 SciRes. CN  S. AHUJA ET AL. Copyright © 2010 SciRes. CN 203 results to throughput, Figure 2 shows the average clients per second for each scenario and framework. each scenario and each framework is recorded for analysis. The results are as shown in Figure 1. By calculating the Time vs Client 0 5000 10000 15000 20000 25000 1 Client5 Clients10 Clients15 Clients20 Clients Response Time (Milliseconds) Apache Axis Resin Hessian JBossWS Codehaus Xfire Figure 1. Latency in client scenarios. Client per Second 0.000 1.000 2.000 3.000 4.000 5.000 6.000 1 Client5 Clients10 Clients15 Clients20 Clients Client per Second Apache Axis Resin Hessian JBossWS Codehaus Xfire Figure 2. Throughput in client scenarios.  S. AHUJA ET AL. 204 Figure 2 shows the most efficient client scenario for each framework. Apache Axis can deal with 4.993 clients per second after reaching the scenarios with 10 clients or more. Resin Hessian can deal with 4.807 clients per second in those same scenarios. JBossWS deals with 0.943 clients per second in every scenario. Codehaus XFire seems to work most efficiently around the scenario of 5 clients, dealing about 2.892 clients per second. 5.1.2. Data Size Scenarios As for the results and average throughput for the five scenarios based on different data size, they are shown in Figures 3 and 4. Time vs MB 0 1000 2000 3000 4000 5000 6000 12345 MB Sent Response Time (Milliseconds) Apache Axis Resin Hessian JBossWS Codehaus Xfire Figure 3. Latency in data size scenarios. MB per Seconds 0 0.5 1 1.5 2 2.5 3 3.5 4 12345 MB Sent MB per Second Apach Axis Resin Hessian JBossWS Codehaus XFire Figure 4. Throughput in data size scenarios. Copyright © 2010 SciRes. CN  S. AHUJA ET AL.205 Figure 4 shows the most efficient data size scenario for each framework. All frameworks reach their best performance after data with 2 MB or more are sent. Apache Axis has an average of 3.617 MB/s, JBossWS with 1.287 MB/s, Codehaus XFire with 1.240, and Resin Hessian with 1.017. From all the graphs above, it would seem like Apache Axis has the best performance in all scenarios, but fur- ther analysis should be done by SAS. 5.2. Analyses Obviously, the amount of respond time highly depends on the choice of framework, the quantity of data trans- ferred, and the number of clients that are invoking tasks from the web service. That makes these three factors significant to the test results, which is the response time. But before doing further analysis, we have to use the GLM model to make sure if the interactions of the three factors are also significant factors. If the interactions are not, we can use the Tukey method to do multiple com- parison and directly see which framework has better performances in all cases and which has worse; if the interactions are significant factors, than we would need to analyze the results case by case. 5.2.1. Client Scenarios First analyzing the results from the client scenarios, we use the SAS system to see the significance of each factor. It turns out not only are the amount of clients and choice of framework significant factors, but also is the interaction between them. This means if one of the frameworks is significantly faster than the some others in the some scenarios, the framework would not necessarily be faster than those in other scenarios. Thus, SAS can not directly compare all frameworks in all scenarios. A pair-wise comparison from the General Linear Model (GLM) procedure is used in this case. The first framework is compared to the second in the first scenario, then the first to third, first to fourth, second to third, second to fourth, and third to fourth. So there would be six com- parisons in each scenario. Table 1 should be read a scenario at a time, i.e. when we are looking at the 1-client scenario, we ignore the data in the 5-client, 10-client, 15-client, and 20-client scenario. Groups with lower alphabets have lower re- Table 1. Response time comparison for client scenarios. 1 Client 5 Clients 10 Clients 15 Clients 20 Clients Apache Axis A A A A A Hessian A A A A A JBossWS A B C C C Codehaus XFire A A B B B sponse time, which means better performance. In the 1-client scenario, all frameworks are put into group A, meaning they all have approximately the same performance in this scenario. In the 5-client scenario, JBossWS is put into group B while the others are in group A. This means in this scenario, JBossWS has worse performance than the others, while the others still are about the same. In the last three scenarios, Apache Axis and Resin Hessian are faster than Codehaus XFire, and Codehaus XFire is faster than JBossWS. Although from the SAS analysis results the better performance of frameworks is a case by case matter, as the number of clients increase, the performance com- parison trends to be the same, being Apache Axis and Resin Hessian better than Codehaus XFire, and Codehaus XFire better than JBossWS. 5.2.2. Data Size Scenarios The process of analyzing performance based on data size is just the same as the analyzing it based on client amount. First, the interaction between data size and choice of framework is determined. It turns out that the interaction between data size and choice of framework is also a significant factor. There- fore, the same pair-wise comparison procedure is used again. When sending 1 MB, Apache Axis is better than Codehaus XFire, which is better than JBossWS, and that is better than Resin Hessian. In the second scenario, the comparison is almost the same but performances of Codehaus XFire and JBossWS are equivalent. In the last three scenarios, JBossWS and Codehaus XFire switch places, making JBossWS faster. Although each scenario is a different case, as the data size increases, the per- formance comparison trend to be the same, being Apache Axis the best, JBossWS the second, Codehaus XFire the third, and Resin Hessian the last. 5.2.3. Others Other metrics such as memory usage, CPU usage, and source lines of code (SLOC) are also tested in this pro- ject. Table 3 shows memory and CPU used on the web service application created using each framework. Since the web service application created using four frameworks all barely use any CPU at all, CPU usage is not a main factor in this case now. Comparing the memory Table 2. Response time comparison for client scenarios. 1 MB 2 MB 3 MB 4 MB 5 MB Apache Axis A A A A A Resin HessianD C D D D JBossWS C B B B B Codehaus XFire B B C C C Copyright © 2010 SciRes. CN 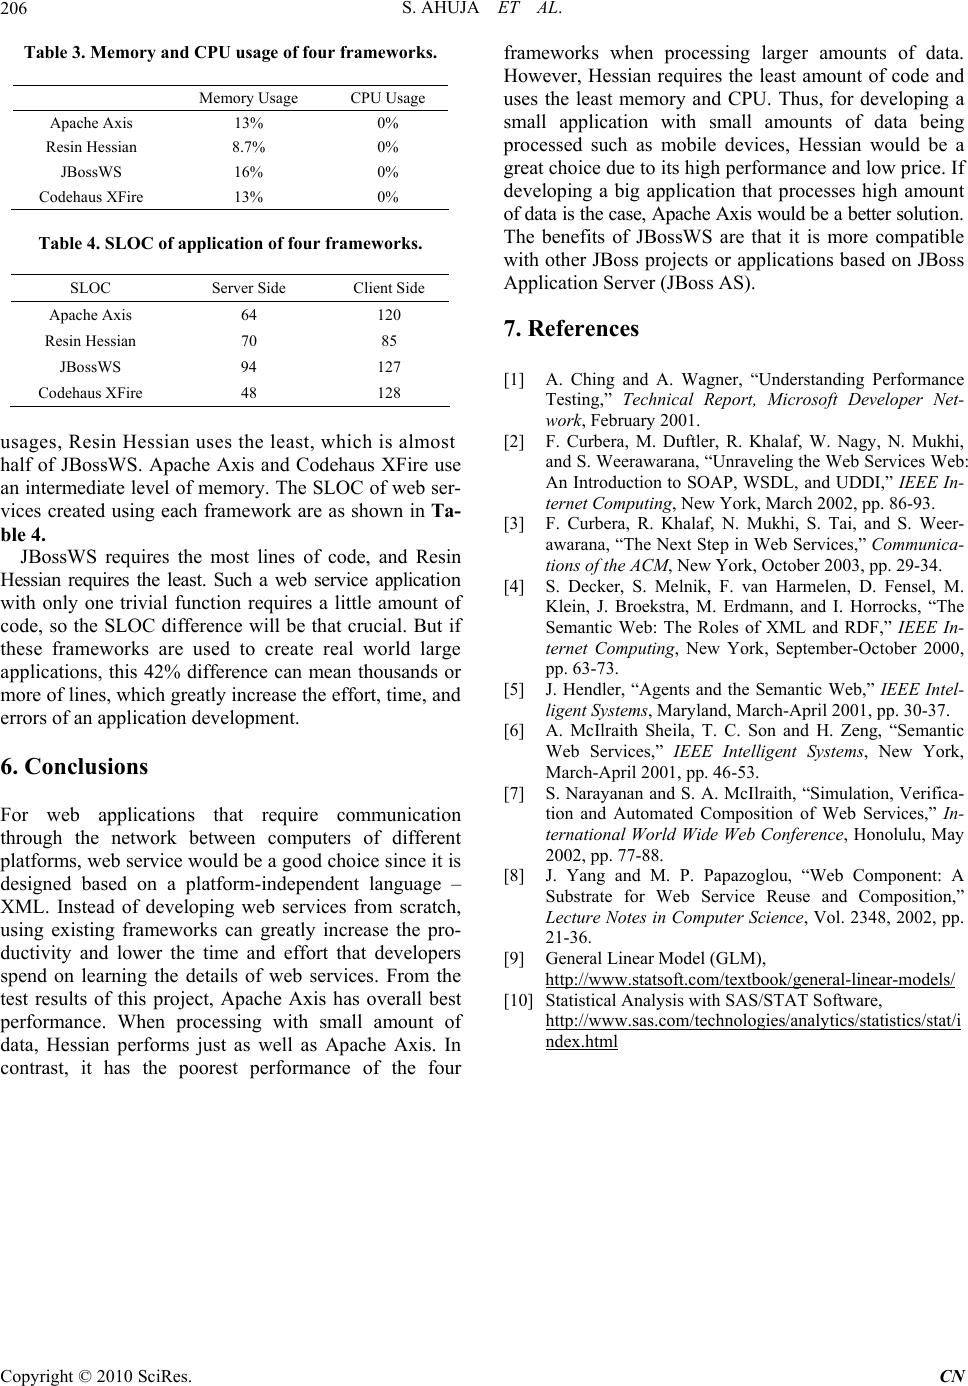 S. AHUJA ET AL. Copyright © 2010 SciRes. CN 206 Table 3. Memory and CPU usage of four frameworks. Memory Usage CPU Usage Apache Axis 13% 0% Resin Hessian 8.7% 0% JBossWS 16% 0% Codehaus XFire 13% 0% Table 4. SLOC of application of four frameworks. SLOC Server Side Client Side Apache Axis 64 120 Resin Hessian 70 85 JBossWS 94 127 Codehaus XFire 48 128 usages, Resin Hessian uses the least, which is almost half of JBossWS. Apache Axis and Codehaus XFire use an intermediate level of memory. The SLOC of web ser- vices created using each framework are as shown in Ta- ble 4. JBossWS requires the most lines of code, and Resin Hessian requires the least. Such a web service application with only one trivial function requires a little amount of code, so the SLOC difference will be that crucial. But if these frameworks are used to create real world large applications, this 42% difference can mean thousands or more of lines, which greatly increase the effort, time, and errors of an application development. 6. Conclusions For web applications that require communication through the network between computers of different platforms, web service would be a good choice since it is designed based on a platform-independent language – XML. Instead of developing web services from scratch, using existing frameworks can greatly increase the pro- ductivity and lower the time and effort that developers spend on learning the details of web services. From the test results of this project, Apache Axis has overall best performance. When processing with small amount of data, Hessian performs just as well as Apache Axis. In contrast, it has the poorest performance of the four frameworks when processing larger amounts of data. However, Hessian requires the least amount of code and uses the least memory and CPU. Thus, for developing a small application with small amounts of data being processed such as mobile devices, Hessian would be a great choice due to its high performance and low price. If developing a big application that processes high amount of data is the case, Apache Axis would be a better solution. The benefits of JBossWS are that it is more compatible with other JBoss projects or applications based on JBoss Application Server (JBoss AS). 7. References [1] A. Ching and A. Wagner, “Understanding Performance Testing,” Technical Report, Microsoft Developer Net- work, February 2001. [2] F. Curbera, M. Duftler, R. Khalaf, W. Nagy, N. Mukhi, and S. Weerawarana, “Unraveling the Web Services Web: An Introduction to SOAP, WSDL, and UDDI,” IEEE In- ternet Computing, New York, March 2002, pp. 86-93. [3] F. Curbera, R. Khalaf, N. Mukhi, S. Tai, and S. Weer- awarana, “The Next Step in Web Services,” Communica- tions of the ACM, New York, October 2003, pp. 29-34. [4] S. Decker, S. Melnik, F. van Harmelen, D. Fensel, M. Klein, J. Broekstra, M. Erdmann, and I. Horrocks, “The Semantic Web: The Roles of XML and RDF,” IEEE In- ternet Computing, New York, September-October 2000, pp. 63-73. [5] J. Hendler, “Agents and the Semantic Web,” IEEE Intel- ligent Systems, Maryland, March-April 2001, pp. 30-37. [6] A. McIlraith Sheila, T. C. Son and H. Zeng, “Semantic Web Services,” IEEE Intelligent Systems, New York, March-April 2001, pp. 46-53. [7] S. Narayanan and S. A. McIlraith, “Simulation, Verifica- tion and Automated Composition of Web Services,” In- ternational World Wide Web Conference, Honolulu, May 2002, pp. 77-88. [8] J. Yang and M. P. Papazoglou, “Web Component: A Substrate for Web Service Reuse and Composition,” Lecture Notes in Computer Science, Vol. 2348, 2002, pp. 21-36. [9] General Linear Model (GLM), http://www.statsoft.com/textbook/general-linear-models/ [10] Statistical Analysis with SAS/STAT Software, http://www.sas.com/technologies/analytics/statistics/stat/i ndex.html
|