Paper Menu >>
Journal Menu >>
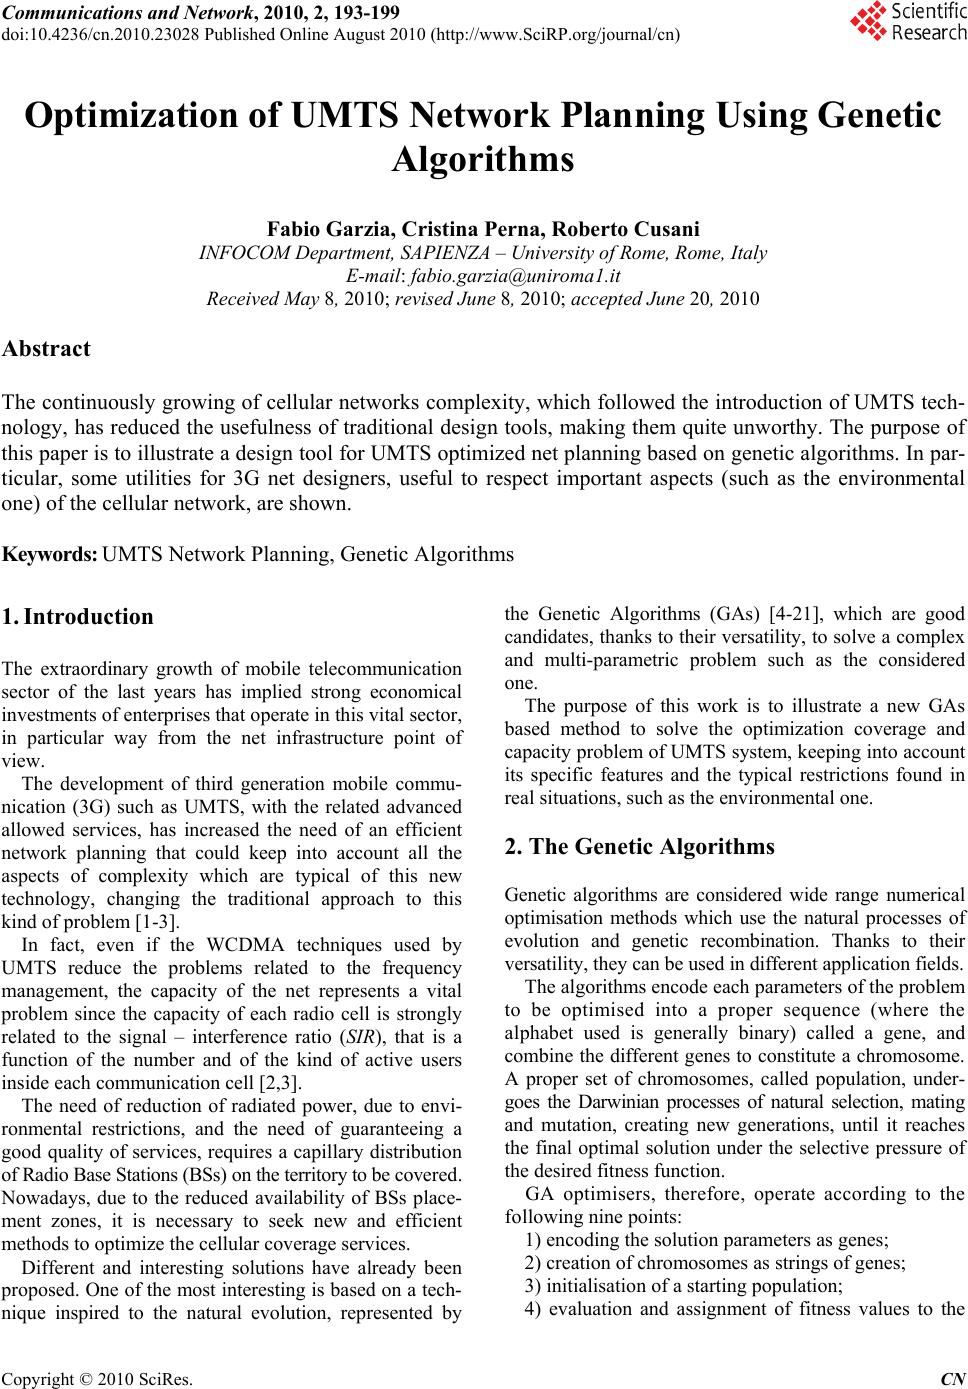 Communications and Network, 2010, 2, 193-199 doi:10.4236/cn.2010.23028 Published Online August 2010 (http://www.SciRP.org/journal/cn) Copyright © 2010 SciRes. CN Optimization of UMTS Network Planning Using Genetic Algorithms Fabio Garzia, Cristina Perna, Roberto Cusani INFOCOM Department, SAPIENZA – Uni versi t y of Rome , Rome, Ital y E-mail: fabio.garzia@uniroma1.it Received May 8, 2010; revised June 8, 2010; accepted June 20, 2010 Abstract The continuously growing of cellular networks complexity, which followed the introduction of UMTS tech- nology, has reduced the usefulness of traditional design tools, making them quite unworthy. The purpose of this paper is to illustrate a design tool for UMTS optimized net planning based on genetic algorithms. In par- ticular, some utilities for 3G net designers, useful to respect important aspects (such as the environmental one) of the cellular network, are shown. Keywords: UMTS Network Planning, Genetic Algorithms 1. Introduction The extraordinary growth of mobile telecommunication sector of the last years has implied strong economical investments of enterprises that operate in this vital sector, in particular way from the net infrastructure point of view. The development of third generation mobile commu- nication (3G) such as UMTS, with the related advanced allowed services, has increased the need of an efficient network planning that could keep into account all the aspects of complexity which are typical of this new technology, changing the traditional approach to this kind of problem [1-3]. In fact, even if the WCDMA techniques used by UMTS reduce the problems related to the frequency management, the capacity of the net represents a vital problem since the capacity of each radio cell is strongly related to the signal – interference ratio (SIR), that is a function of the number and of the kind of active users inside each communication cell [2,3]. The need of reduction of radiated power, due to envi- ronmental restrictions, and the need of guaranteeing a good quality of services, requires a capillary distribution of Radio Base Stations (BSs) on the territory to be covered. Nowadays, due to the reduced availability of BSs place- ment zones, it is necessary to seek new and efficient methods to optimize the cellular coverage services. Different and interesting solutions have already been proposed. One of the most interesting is based on a tech- nique inspired to the natural evolution, represented by the Genetic Algorithms (GAs) [4-21], which are good candidates, thank s to their versatility, to solve a co mplex and multi-parametric problem such as the considered one. The purpose of this work is to illustrate a new GAs based method to solve the optimization coverage and capacity problem of UMTS system, keeping into account its specific features and the typical restrictions found in real situations, such as the environmental one. 2. The Genetic Algorithms Genetic algorithms are considered wide range numerical optimisation methods which use the natural processes of evolution and genetic recombination. Thanks to their versatility, they can be used in different application fields. The algorithms encode each parameters of the problem to be optimised into a proper sequence (where the alphabet used is generally binary) called a gene, and combine the different genes to constitute a chromosome. A proper set of chromosomes, called population, under- goes the Darwinian processes of natural selection, mating and mutation, creating new generations, until it reaches the final optimal solution under the selective pressure of the desired fitness function. GA optimisers, therefore, operate according to the following nine points : 1) encoding the solution parameters as genes; 2) creation of chromosomes as strings of genes; 3) initialisation of a starting population; 4) evaluation and assignment of fitness values to the 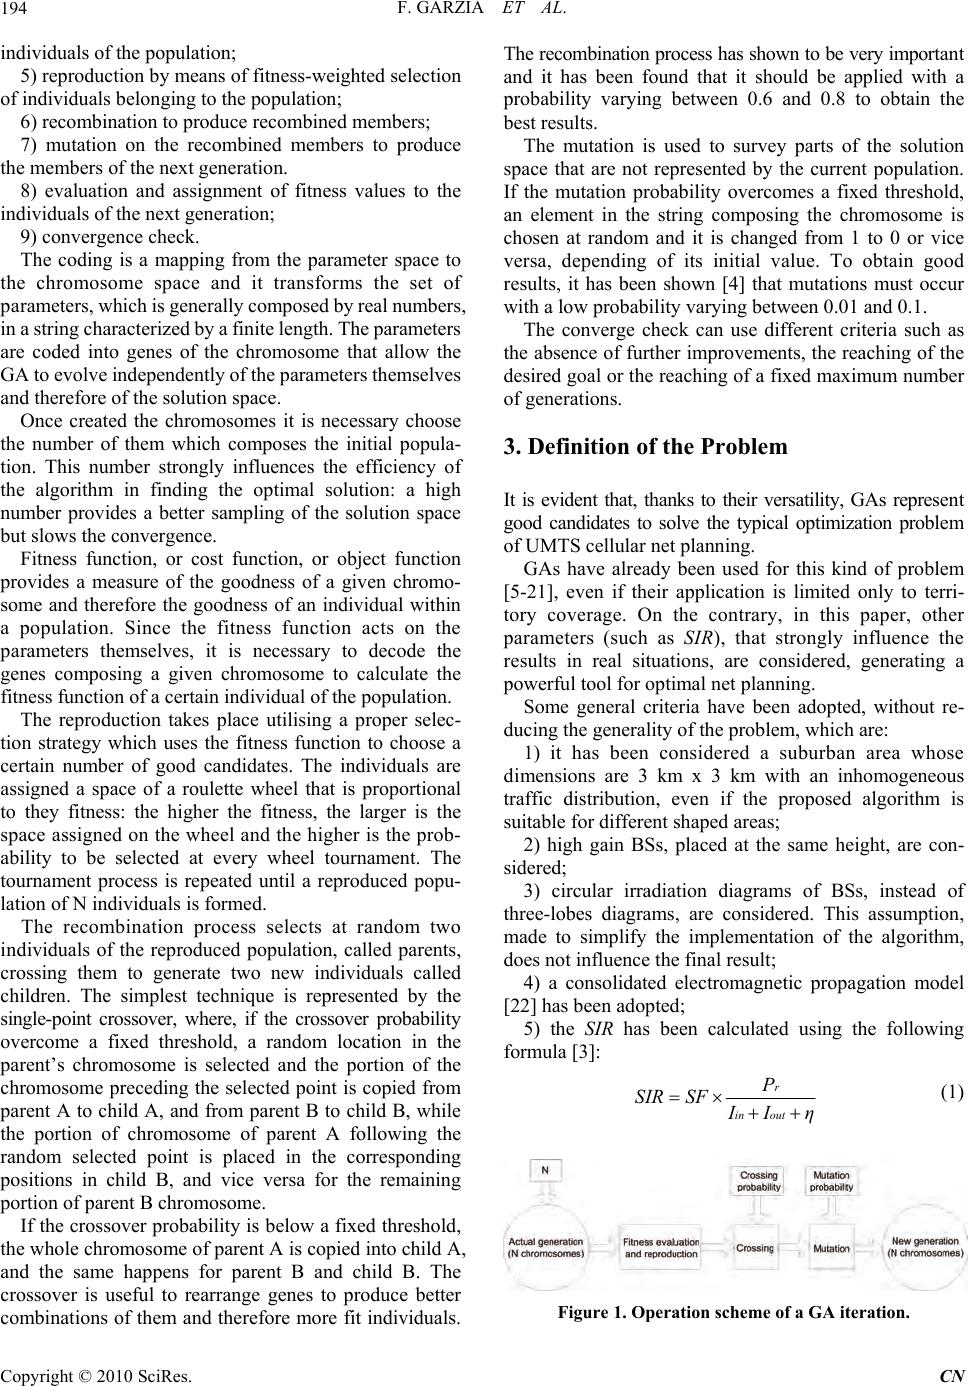 F. GARZIA ET AL. 194 individuals of the population; 5) reproduction by means of fitness-weighted selection of individuals belonging to the population; 6) recombination to produce recombined members; 7) mutation on the recombined members to produce the members of the next generation. 8) evaluation and assignment of fitness values to the individuals of the next generation; 9) convergence check. The coding is a mapping from the parameter space to the chromosome space and it transforms the set of parameters, whi ch is generall y composed by real num bers, in a string characterized by a finite length. The parameters are coded into genes of the chromosome that allow the GA to evolve i ndepe ndentl y of the pa rame ters them selves and therefore of the solution space. Once created the chromosomes it is necessary choose the number of them which composes the initial popula- tion. This number strongly influences the efficiency of the algorithm in finding the optimal solution: a high number provides a better sampling of the solution space but slow s the convergence. Fitness function, or cost function, or object function provides a measure of the goodness of a given chromo- some and therefore the goodness of an individual within a population. Since the fitness function acts on the parameters themselves, it is necessary to decode the genes composing a given chromosome to calculate the fitness function of a certain individual of the population. The reproduction takes place utilising a proper selec- tion strategy which uses the fitness function to choose a certain number of good candidates. The individuals are assigned a space of a roulette wheel that is proportional to they fitness: the higher the fitness, the larger is the space assigned on the wheel and the higher is the prob- ability to be selected at every wheel tournament. The tournament process is repeated until a reproduced popu- lation of N individuals is formed. The recombination process selects at random two individuals of the reproduced population, called parents, crossing them to generate two new individuals called children. The simplest technique is represented by the single-point crossover, where, if the crossover probability overcome a fixed threshold, a random location in the parent’s chromosome is selected and the portion of the chromosome preceding the selected point is copied from parent A to child A, and from parent B to child B, while the portion of chromosome of parent A following the random selected point is placed in the corresponding positions in child B, and vice versa for the remaining portion of pa rent B chrom oso me. If the crossover probability is below a fixed threshold, the whole chromosome of parent A is copied into child A, and the same happens for parent B and child B. The crossover is useful to rearrange genes to produce better combinations of them and therefore more fit individuals. The recombination process h as shown to be very import an t and it has been found that it should be applied with a probability varying between 0.6 and 0.8 to obtain the best results. The mutation is used to survey parts of the solution space that are not represented by the current population. If the mutation probability overcomes a fixed threshold, an element in the string composing the chromosome is chosen at random and it is changed from 1 to 0 or vice versa, depending of its initial value. To obtain good results, it has been shown [4] that mutations must occur with a low probability varying between 0.01 and 0.1. The converge check can use different criteria such as the absence of further improvements, the reaching of the desired goal or the reaching of a fixed maximum number of generations. 3. Definition of the Problem It is evident that, thanks to their versatility, GAs represent good candidates to solve the typical optimization problem of UMTS cellular net planning. GAs have already been used for this kind of problem [5-21], even if their application is limited only to terri- tory coverage. On the contrary, in this paper, other parameters (such as SIR), that strongly influence the results in real situations, are considered, generating a powerful tool for optimal net planning. Some general criteria have been adopted, without re- ducing the generality of the problem, which are: 1) it has been considered a suburban area whose dimensions are 3 km x 3 km with an inhomogeneous traffic distribution, even if the proposed algorithm is suitable for different shaped areas; 2) high gain BSs, placed at the same height, are con- sidered; 3) circular irradiation diagrams of BSs, instead of three-lobes diagrams, are considered. This assumption, made to simplify the implementation of the algorithm, does not influence the final result; 4) a consolidated electromagnetic propagation model [22] has been adopted; 5) the SIR has been calculated using the following formula [3]: r in out P SIRSF IIη (1) Figure 1. Operation scheme of a GA iteration. Copyright © 2010 SciRes. CN 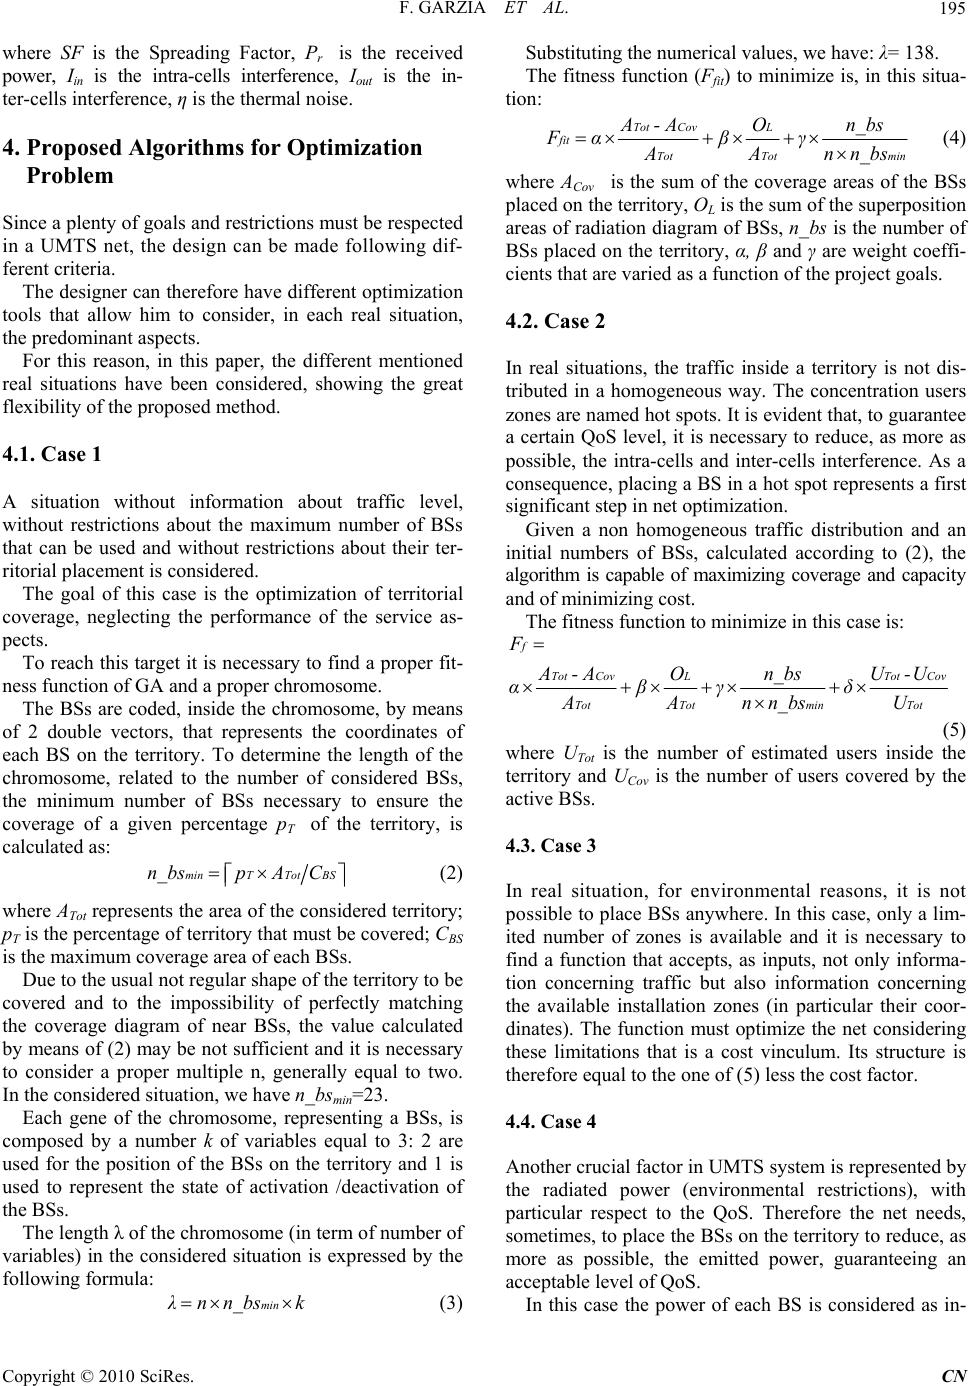 F. GARZIA ET AL.195 where SF is the Spreading Factor, Pr is the received power, Iin is the intra-cells interference, Iout is the in- ter-cells interference, η is the thermal noise. 4. Proposed Algorithms for Optimization Problem Since a plenty of goals and restrictions must be respected in a UMTS net, the design can be made following dif- ferent criteria. The designer can therefore have different optimization tools that allow him to consider, in each real situation, the predominant aspects. For this reason, in this paper, the different mentioned real situations have been considered, showing the great flexibility of the proposed method. 4.1. Case 1 A situation without information about traffic level, without restrictions about the maximum number of BSs that can be used and without restrictions about their ter- ritorial placement is considered. The goal of this case is the optimization of territorial coverage, neglecting the performance of the service as- pects. To reach this target it is necessary to find a proper fit- ness function of GA and a proper chromosome. The BSs are coded, inside the chromosome, by means of 2 double vectors, that represents the coordinates of each BS on the territory. To determine the length of the chromosome, related to the number of considered BSs, the minimum number of BSs necessary to ensure the coverage of a given percentage pT of the territory, is calculated as: minTTot BSn_bspA C (2) where ATot represents the area of the considered territory; pT is the percentage of territory that must be covered; CBS is the maximum coverage area of each BSs. Due to the usual not regular sh ap e of the territory to be covered and to the impossibility of perfectly matching the coverage diagram of near BSs, the value calculated by means of (2) may be not sufficient and it is necessary to consider a proper multiple n, generally equal to two. In the considered situation, we have n_bsmin=23. Each gene of the chromosome, representing a BSs, is composed by a number k of variables equal to 3: 2 are used for the position of the BSs on the territory and 1 is used to represent the state of activation /deactivation of the BSs. The length λ of the chromosome (in term of number of variables) in the considered situation is expressed by the following formula: minλ nn_bsk (3) Substituting the numerical values, we have: λ= 138. The fitness function (Ffit) to minimize is, in this situa- tion: Tot CovL fit Tot Totmin A - AOn_bs Fαβγ A An n_bs (4) where ACov is the sum of the coverage areas of the BSs placed on the territory, OL is the sum of the superposition areas of radiation diagram of BSs, n_bs is the number of BSs placed on the territory, α, β and γ are weight coeffi- cients that are varied as a function of the project goals. 4.2. Case 2 In real situations, the traffic inside a territory is not dis- tributed in a homogeneous way. The concentration users zones are named hot spots. It is evident that, to guarantee a certain QoS level, it is necessary to reduce, as more as possible, the intra-cells and inter-cells interference. As a consequence, placing a BS in a hot spot represents a first significant step in net optimizatio n. Given a non homogeneous traffic distribution and an initial numbers of BSs, calculated according to (2), the algorithm is capable of maximizing coverage and capacity and of minimizing cost. The fitness function to minimize in this case is: f TotCovLTot Cov TotTotmin Tot F A - AOn_bsU-U αβγ δ AAnn_bsU (5) where UTot is the number of estimated users inside the territory and UCov is the number of users covered by the active BSs. 4.3. Case 3 In real situation, for environmental reasons, it is not po ssible to place BSs anywhere. In this case, only a lim- ited number of zones is available and it is necessary to find a function that accepts, as inputs, not only informa- tion concerning traffic but also information concerning the available installation zones (in particular their coor- dinates). The function must optimize the net considering these limitations that is a cost vinculum. Its structure is therefore equal to the one of (5) less the cost factor. 4.4. Case 4 Another crucial factor in UMTS system is represented by the radiated power (environmental restrictions), with particular respect to the QoS. Therefore the net needs, sometimes, to place the BSs on the territory to reduce, as more as possible, the emitted power, guaranteeing an acceptable level of QoS. In this case the power of each BS is considered as in- Copyright © 2010 SciRes. CN  F. GARZIA ET AL. 196 put parameter (which can be properly changed), that in- fluences not only the coverage area but also the trans- mission capacity. The fitness function is therefore: f TotCovLTotTot Cov TotTotMax Tot F A -AOPU -U αβγ δ AAn_srb PU (6) where PTot is the total power of BSs and PMax in the maximum power radiated by each BS. 5. Performance of the Algorithms and Results In the following the results of each situation considered above are shown. 5.1. Case 1 Purpose of case 1 is the optimization of the net consider in g only the coverage of the territory, keeping into account the cost factor. The results obtained are shown in the following. A first situation has been obtained considering the following values for the weights of fitness function: α = 0.6, β=0.1, γ=0.3. The results are shown in Figure 2. It is possible to see that the presence of a strong cost compo- nent has heavily penalized the coverage maximization. A second situation has been obtained considering the following values for the weights of fitness function α=1, β=0, γ=0, that is to maximize coverage considering the cost as a quasi-neglectable factor. Due to the structure of fitness func tion, it always tends to limit the number of BSs on the territory, evaluating each time if the coverage gain justify the increase of the number of BS s. (a) (b) Figure 2 (a) Initial situation. Units are expressed in kilo- meters. (b) Final results after 300 generations. Units are expressed in kilo-meters. (a) (b) Figure3 (a) Initial situation. Units are expressed in kilo- meters. (b) Final results after 300 generations. Units are expressed in kilo-meters. Copyright © 2010 SciRes. CN 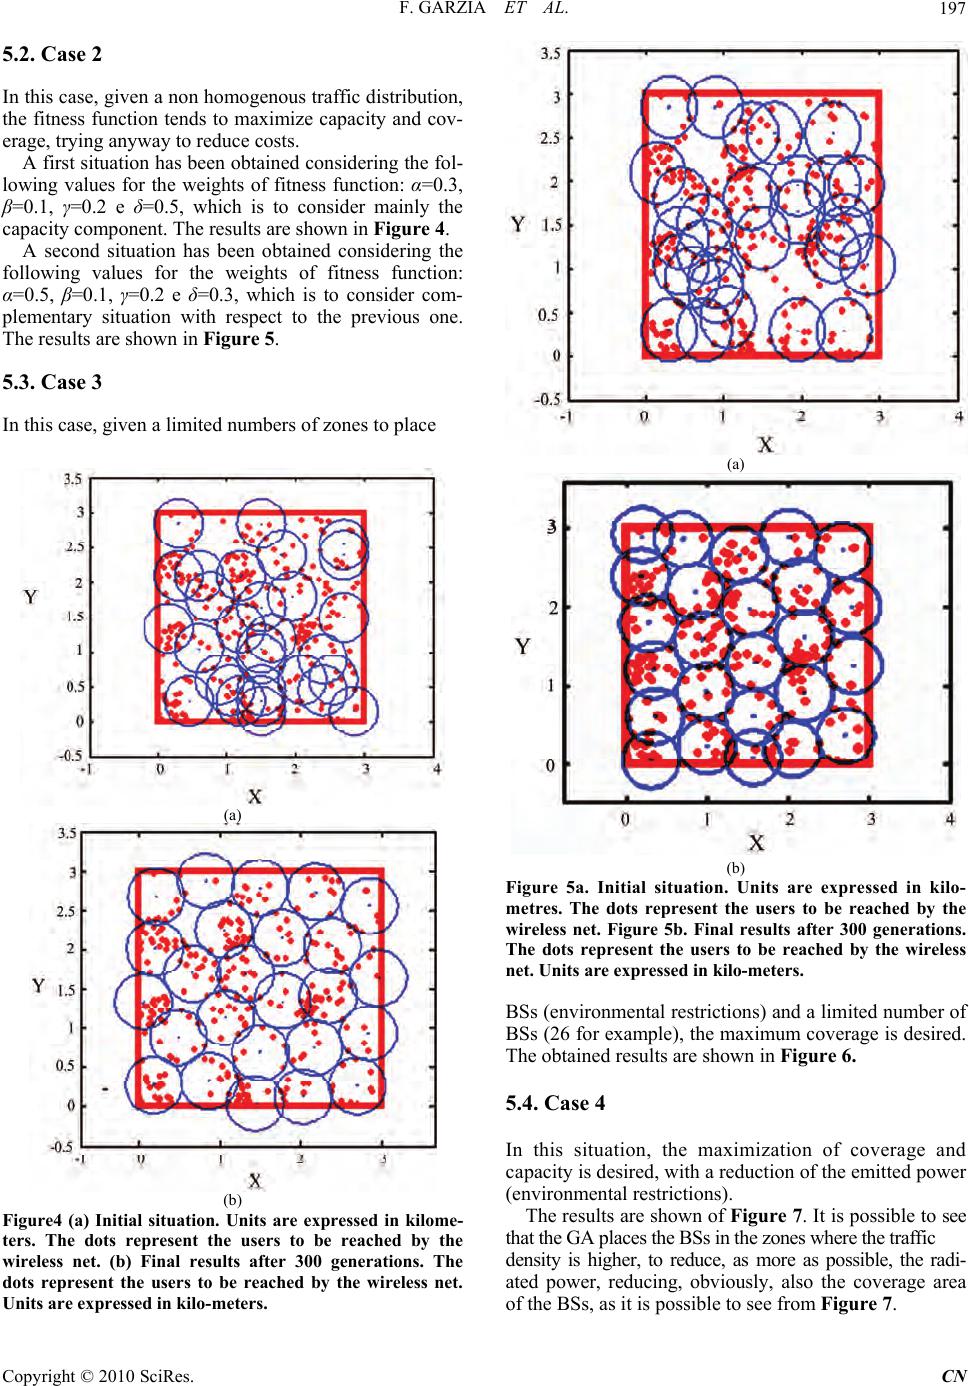 F. GARZIA ET AL.197 5.2. Case 2 In this case, given a non homogenous traffic distribution, the fitness function tends to maximize capacity and cov- erage, trying anyway to reduce costs. A first situation has been obtained considering the fol- lowing values for the weights of fitness function: α=0.3, β=0.1, γ=0.2 e δ=0.5, which is to consider mainly the capacity component. The results are shown in Figure 4. A second situation has been obtained considering the following values for the weights of fitness function: α=0.5, β=0.1, γ=0.2 e δ=0.3, which is to consider com- plementary situation with respect to the previous one. The results are shown in Figure 5. 5.3. Case 3 In this case, given a limited numbers of zones to place (a) (b) Figure4 (a) Initial situation. Units are expressed in kilome- ters. The dots represent the users to be reached by the wireless net. (b) Final results after 300 generations. The dots represent the users to be reached by the wireless net. Units are expressed in kilo-meters. (a) (b) Figure 5a. Initial situation. Units are expressed in kilo- metres. The dots represent the users to be reached by the wireless net. Figure 5b. Final results after 300 generations. The dots represent the users to be reached by the wireless net. Units are expressed in kilo-meters. BSs (environmental restrictions) and a limit ed number of BSs (26 for example), the maximum coverage is desired. The obtained results are shown in Figure 6. 5.4. Case 4 In this situation, the maximization of coverage and capacity is desired , with a redu ction of the emit ted power (environmental restrictions). The results are shown of Figure 7. It is possible to see that the GA places the BSs in the zones where the traffic density is higher, to reduce, as more as possible, the radi- ated power, reducing, obviously, also the coverage area of the BSs, as it is possible to see from Figure 7. Copyright © 2010 SciRes. CN 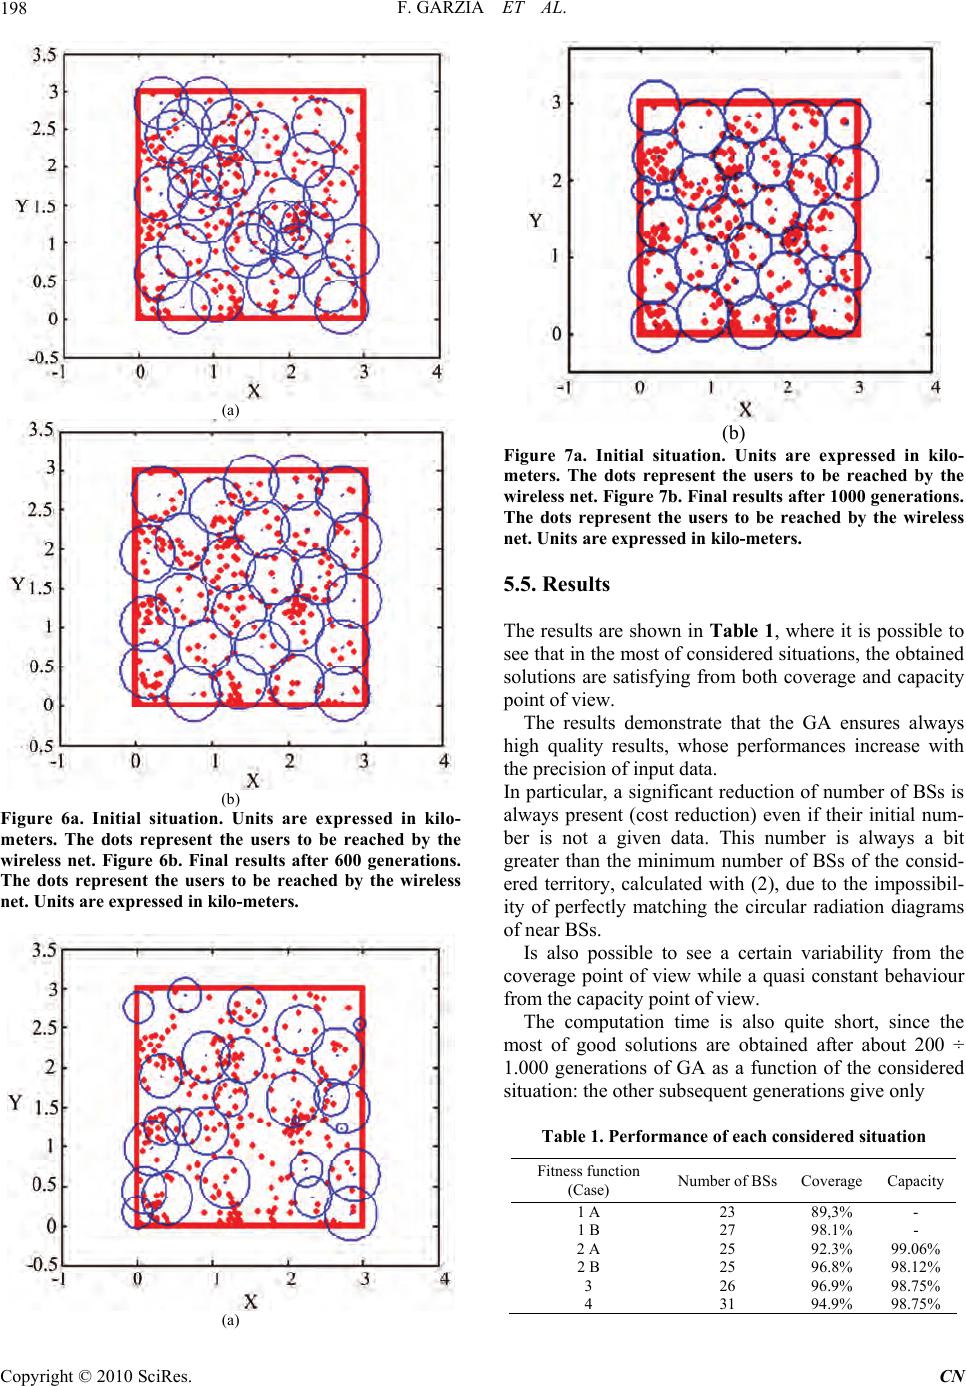 F. GARZIA ET AL. 198 (a) (b) Figure 6a. Initial situation. Units are expressed in kilo- meters. The dots represent the users to be reached by the wireless net. Figure 6b. Final results after 600 generations. The dots represent the users to be reached by the wireless net. Units are expressed in kilo-meters. (a) (b) Figure 7a. Initial situation. Units are expressed in kilo- meters. The dots represent the users to be reached by the wireless net. Figure 7b. Final results after 1000 generations. The dots represent the users to be reached by the wireless net. Units are expressed in kilo-meters. 5.5. Results The results are shown in Table 1, where it is possible to see that in the most of considered situations, the obtain ed solutions are satisfying from both coverage and capacity point of view. The results demonstrate that the GA ensures always high quality results, whose performances increase with the precision of input data. In particular, a significant reduction of number of BSs is always present (cost reduction) even if their initial num- ber is not a given data. This number is always a bit greater than the minimum number of BSs of the consid- ered territory, calculated with (2), due to the impossibil- ity of perfectly matching the circular radiation diagrams of near BSs. Is also possible to see a certain variability from the coverage point of view while a quasi constant behaviour from the capacity point of view. The computation time is also quite short, since the most of good solutions are obtained after about 200 ÷ 1.000 generations of GA as a function of the considered situation: the other subsequent generations give only Table 1. Performance of each considered situation Fitness function (Case) Number of BSs Coverage Capacity 1 A 23 89,3% - 1 B 27 98.1% - 2 A 25 92.3% 99.06% 2 B 25 96.8% 98.12% 3 26 96.9% 98.75% 4 31 94.9% 98.75% Copyright © 2010 SciRes. CN 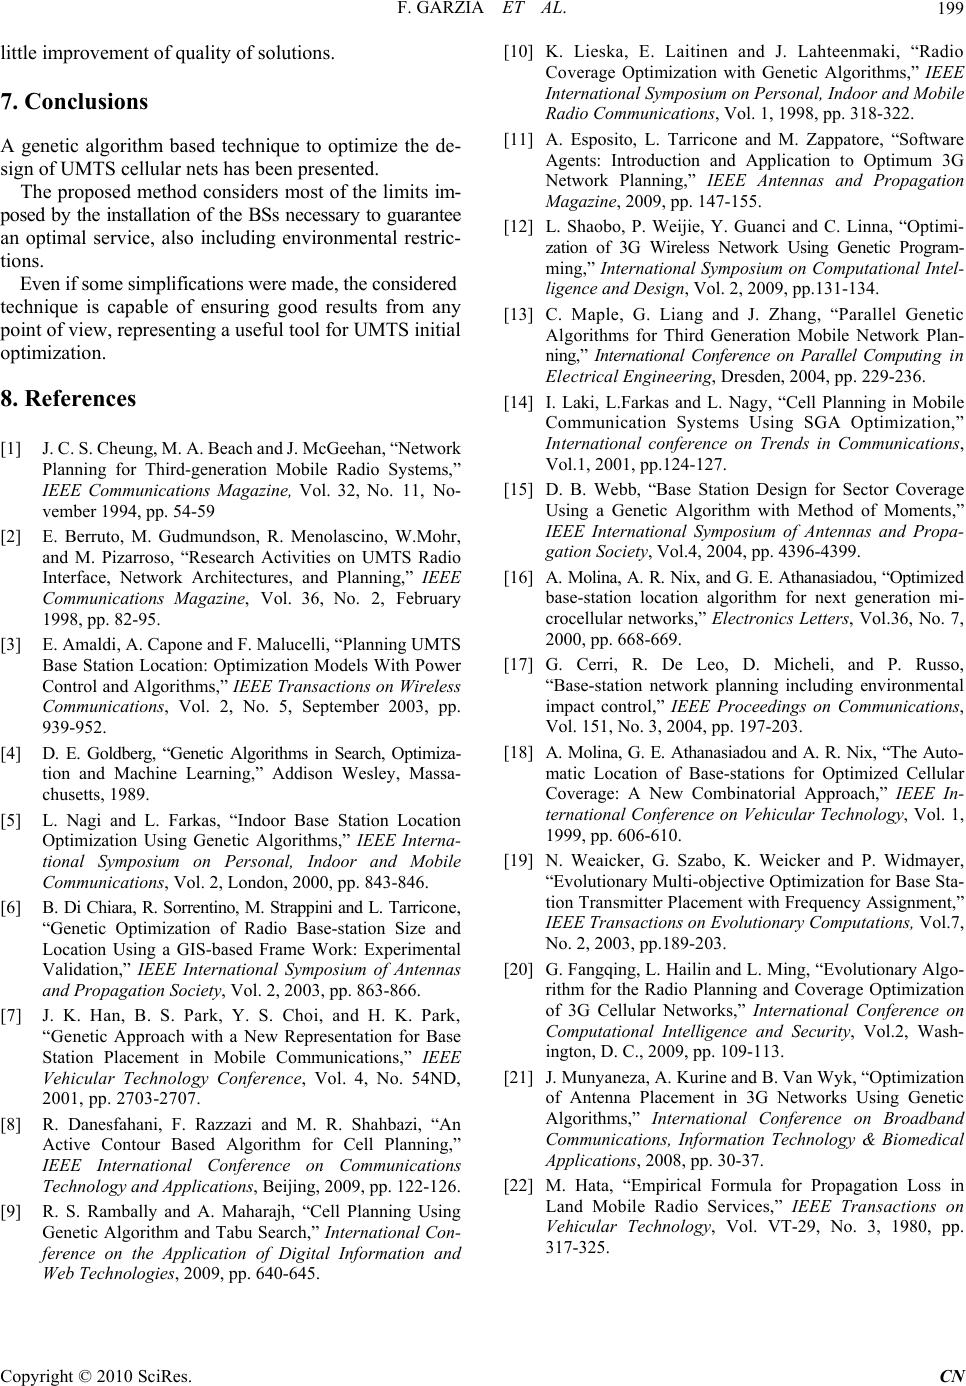 F. GARZIA ET AL. Copyright © 2010 SciRes. CN 199 little improvement of qu ality of solutions. 7. Conclusions A genetic algorithm based technique to optimize the de- sign of UMTS cellular nets has been presented. The proposed method considers most of the limits im- posed by the installation of the BSs necessary to guarantee an optimal service, also including environmental restric- tions. Even if some simplifications were made, the considered technique is capable of ensuring good results from any point of view, representing a useful too l for UMTS initial optimization. 8. References [1] J. C. S. Cheung, M. A. Beach and J . McGeehan, “Netw ork Planning for Third-generation Mobile Radio Systems,” IEEE Communications Magazine, Vol. 32, No. 11, No- vember 1994, pp. 54-59 [2] E. Berruto, M. Gudmundson, R. Menolascino, W.Mohr, and M. Pizarroso, “Research Activities on UMTS Radio Interface, Network Architectures, and Planning,” IEEE Communications Magazine, Vol. 36, No. 2, February 1998, pp. 82-95. [3] E. Amaldi, A. Capone and F. Malucelli, “Planning UMTS Base Station Location: Optimization Models With Power Control and Algorithms,” IEEE Transactions on Wireless Communications, Vol. 2, No. 5, September 2003, pp. 939-952. [4] D. E. Goldberg, “Genetic Algorithms in Search, Optimiza- tion and Machine Learning,” Addison Wesley, Massa- chusetts, 1989. [5] L. Nagi and L. Farkas, “Indoor Base Station Location Optimization Using Genetic Algorithms,” IEEE Interna- tional Symposium on Personal, Indoor and Mobile Communications, Vol. 2, London, 2000, pp. 843-846. [6] B. Di Chiara, R. Sorrentino, M. Strappini and L. Tarrico ne, “Genetic Optimization of Radio Base-station Size and Location Using a GIS-based Frame Work: Experimental Validation,” IEEE International Symposium of Antennas and Propagation Society, Vol. 2, 2003, pp. 863-866. [7] J. K. Han, B. S. Park, Y. S. Choi, and H. K. Park, “Genetic Approach with a New Representation for Base Station Placement in Mobile Communications,” IEEE Vehicular Technology Conference, Vol. 4, No. 54ND, 2001, pp. 2703-2707. [8] R. Danesfahani, F. Razzazi and M. R. Shahbazi, “An Active Contour Based Algorithm for Cell Planning,” IEEE International Conference on Communications Technology and Applications, Beijing, 2009, pp. 122-126. [9] R. S. Rambally and A. Maharajh, “Cell Planning Using Genetic Algorithm and Tabu Search,” International Con- ference on the Application of Digital Information and Web Technologies, 2009, pp. 640-645. [10] K. Lieska, E. Laitinen and J. Lahteenmaki, “Radio Coverage Optimization with Genetic Algorithms,” IEEE International Symposium on Personal, Indoor and Mobile Radio Communications, Vol. 1, 1998, pp. 318-322. [11] A. Esposito, L. Tarricone and M. Zappatore, “Software Agents: Introduction and Application to Optimum 3G Network Planning,” IEEE Antennas and Propagation Magazine, 2009, pp. 147-155. [12] L. Shaobo, P. Weijie, Y. Guanci and C. Linna, “Optimi- zation of 3G Wireless Network Using Genetic Program- ming,” International Symposium on Computational Intel- ligence and Design, Vol. 2, 2009, pp.131-134. [13] C. Maple, G. Liang and J. Zhang, “Parallel Genetic Algorithms for Third Generation Mobile Network Plan- ning,” International Conference on Parallel Computing in Ele ctrical Engineering, Dresden, 2004, pp. 229-236. [14] I. Laki, L.Farkas and L. Nagy, “Cell Planning in Mobile Communication Systems Using SGA Optimization,” International conference on Trends in Communications, Vol.1, 2001, pp.124-127. [15] D. B. Webb, “Base Station Design for Sector Coverage Using a Genetic Algorithm with Method of Moments,” IEEE International Symposium of Antennas and Propa- gation Society, Vol.4, 2004, pp. 4396-4399. [16] A. Molina, A. R. Nix, and G. E. Athanasiadou, “Opti miz ed base-station location algorithm for next generation mi- crocellular networks,” Electronics Letters, Vol.36, No. 7, 2000, pp. 668-669. [17] G. Cerri, R. De Leo, D. Micheli, and P. Russo, “Base-station network planning including environmental impact control,” IEEE Proceedings on Communications, Vol. 151, No. 3, 2004, pp. 197-203. [18] A. Molina, G. E. Athanasiadou and A. R. Nix, “The Auto- matic Location of Base-stations for Optimized Cellular Coverage: A New Combinatorial Approach,” IEEE In- ternational Conference on Vehicular Technology, Vol. 1, 1999, pp. 606-610. [19] N. Weaicker, G. Szabo, K. Weicker and P. Widmayer, “Evolutionary Multi-objective Optimization for Base Sta- tion Transmitter Placement with Frequency Assignment,” IEEE Transactions on Evolutionary Computations, Vol.7, No. 2, 2003, pp.189-203. [20] G. Fangqing, L. Hailin and L. Ming, “Evolutionary Algo- rithm for the Radio Planning and Coverage Optimization of 3G Cellular Networks,” International Conference on Computational Intelligence and Security, Vol.2, Wash- ington, D. C., 2009, pp. 109-113. [21] J. Munyaneza, A. Kurine and B. Van Wyk, “Optimization of Antenna Placement in 3G Networks Using Genetic Algorithms,” International Conference on Broadband Communications, Information Technology & Biomedical Applications, 2008, pp. 30-37. [22] M. Hata, “Empirical Formula for Propagation Loss in Land Mobile Radio Services,” IEEE Transactions on Vehicular Technology, Vol. VT-29, No. 3, 1980, pp. 317-325. |