Paper Menu >>
Journal Menu >>
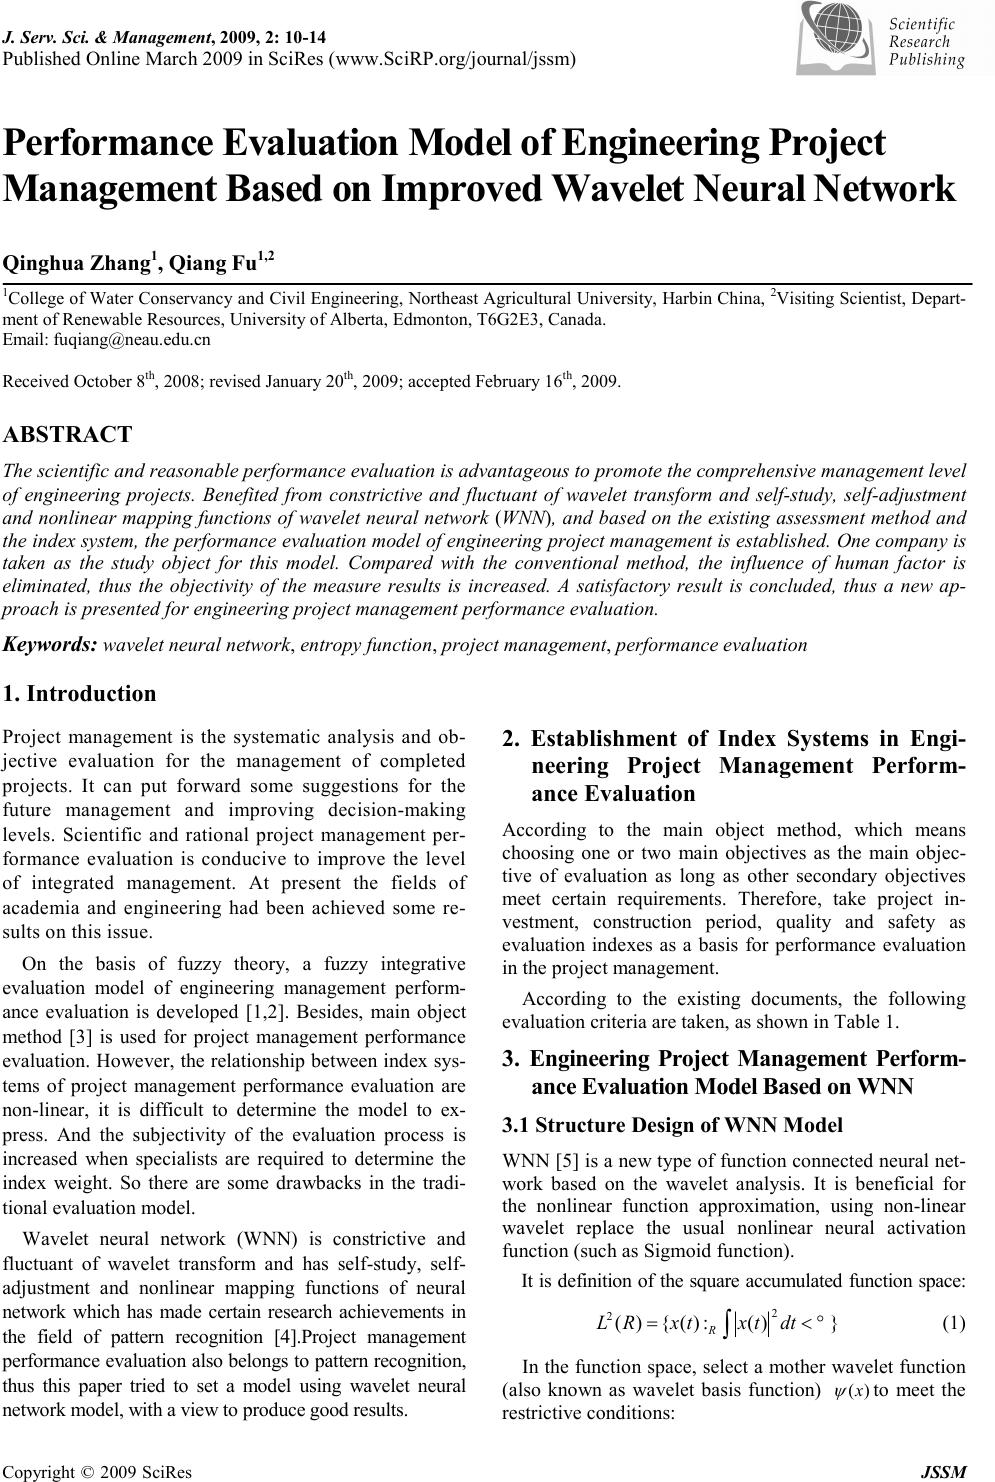 J. Serv. Sci. & Management, 2009, 2: 10-14 Published Online March 2009 in SciRes (www.SciRP.org/journal/jssm) Copyright © 2009 SciRes JSSM Performance Evaluation Model of Engineering Project Management Based on Improved Wavelet Neural Network Qinghua Zhang 1 , Qiang Fu 1,2 1 College of Water Conservancy and Civil Engineering, Northeast Agricultural University, Harbin China, 2 Visiting Scientist, Depart- ment of Renewable Resources, University of Alberta, Edmonton, T6G2E3, Canada. Email: fuqiang@neau.edu.cn Received October 8 th , 2008; revised January 20 th , 2009; accepted February 16 th , 2009. ABSTRACT The scientific and reasonable performance evaluation is advantageous to promote the comprehensive management level of engineering projects. Benefited from constrictive and fluctuant of wavelet transform and self-study, self-adjustment and nonlinear mapping functions of wavelet neural network (WNN), and based on the existing assessment method and the index system, the performance evaluation model of engineering project management is established. One company is taken as the study object for this model. Compared with the conventional method, the influence of human factor is eliminated, thus the objectivity of the measure results is increased. A satisfactory result is concluded, thus a new ap- proach is presented for engineering project management performance evaluation. Keywords: wavelet neural network, entropy function, project management, performance evaluation 1. Introduction Project management is the systematic analysis and ob- jective evaluation for the management of completed projects. It can put forward some suggestions for the future management and improving decision-making levels. Scientific and rational project management per- formance evaluation is conducive to improve the level of integrated management. At present the fields of academia and engineering had been achieved some re- sults on this issue. On the basis of fuzzy theory, a fuzzy integrative evaluation model of engineering management perform- ance evaluation is developed [1,2]. Besides, main object method [3] is used for project management performance evaluation. However, the relationship between index sys- tems of project management performance evaluation are non-linear, it is difficult to determine the model to ex- press. And the subjectivity of the evaluation process is increased when specialists are required to determine the index weight. So there are some drawbacks in the tradi- tional evaluation model. Wavelet neural network (WNN) is constrictive and fluctuant of wavelet transform and has self-study, self- adjustment and nonlinear mapping functions of neural network which has made certain research achievements in the field of pattern recognition [4].Project management performance evaluation also belongs to pattern recognition, thus this paper tried to set a model using wavelet neural network model, with a view to produce good results. 2. Establishment of Index Systems in Engi- neering Project Management Perform- ance Evaluation According to the main object method, which means choosing one or two main objectives as the main objec- tive of evaluation as long as other secondary objectives meet certain requirements. Therefore, take project in- vestment, construction period, quality and safety as evaluation indexes as a basis for performance evaluation in the project management. According to the existing documents, the following evaluation criteria are taken, as shown in Table 1. 3. Engineering Project Management Perform- ance Evaluation Model Based on WNN 3.1 Structure Design of WNN Model WNN [5] is a new type of function connected neural net- work based on the wavelet analysis. It is beneficial for the nonlinear function approximation, using non-linear wavelet replace the usual nonlinear neural activation function (such as Sigmoid function). It is definition of the square accumulated function space: })(:)({)( 2 2 ∫ ∞<= dttxtxRL R (1) In the function space, select a mother wavelet function (also known as wavelet basis function) )(x ψ to meet the restrictive conditions:  QINGHUA ZHANG, QIANG FU 11 Copyright © 2009 SciRes JSSM ∫ ∞<= ω ω ωψ φ dC R 2 )( (2) where: )( ωψ is the Fourier Transform of )(x ψ , then stretch and translational transform )(x ψ , wavelet basis function can be obtained. − =a bx a x ba ψψ 1 )( , Rba ∈, (3) where: a is scaling factor and b is time translation factor. The signal can be approximated with a special con- structed neural network. The transfer function is not Sigmoid nonlinear function but wavelet function. This paper uses Morlet wavelet function: )2/exp()75.1cos()( 2 xxx −= ψ (4) A three-layer (one input layer, one hidden layer and one output layer) feed-forward network can approximate a nonlinear mapping with any degree of accuracy under normal circumstances. Aiming at the selected indexes of project management performance evaluation, the model will be expected to take construction period ad- vance rates, cost saving rate, quality control scores, and security control as the input of a network, that means the number of input nodes is 4; take performance evaluation value as the output, that means the number of network output nodes is 1; the number of hidden nodes is 10 by texting, then a 4-10-1 three-layer net- work is established. Performance evaluation model structure of engineering project management based on WNN is shown in Figure 1. 3.2 Learning and Training of WNN Through the study of network optimization indexes, set amendment of the network and wavelet function parame- ters by error back propagation algorithm, then reach the most optimal learning effects gradually. Learning algo- rithm steps as followed with application of Matlab7.0 programming: Step 1: Set the input and output samples [6]. Produce evenly and randomly five numbers and their relative grades of experience given in the interval-level of Table 1 as the learning samples of network. Take 1, 2, 3, and 4 re- spectively as the four grades of excellent, good, qualified and poor in output layer. The data is shown in Table 2. In order to solve the incommensurability between pro- ject investment, construction period, quality and secu- rity, in accordance with the project management per- formance evaluation and the actual situation of indexes, transform the original data of evaluation indexes into a range of [-1,1] as input of the network using nonlinear transformation function. Define the individual indexes utility function [7]: ky ky i e e − − + − =1 1 β (5) where: y is the relative value indicators of the actual value and the plan value; k is relative to the impact laws of the evaluation indexes on project management per- formance, and it can be the experience value. Step 2: Initialization setting. The weights, threshold value of the network, as well as wavelet translation pa- rameters and the scaling parameters are given evenly and randomly in the range [-1,1]. Table 1. Level partition of quantitative indexes Level Construction period advance rate Cost saving rate Quality control scores Security control Excellent ≥0.12 ≥0.06 85 ≤1‰ Good 0.06≤x<0.12 0.03≤x<0.06 75≤x<85 1‰≤x<2‰ Qualified 0≤x<0.06 0≤x<0.03 65≤x<75 2‰≤x<3‰ Poor <0 <0 <65 ≥3‰ Construction pe- riod advance rate Cost saving rate Quality control score Security control Value of perfor- mance appraisal Input layerHidden layerOutput layer W jk y X m 1 ψ 1 X m 2 X m 3 X m 4 ψ j ψ n W ij m Figure 1. Engineering project management performance evaluation model 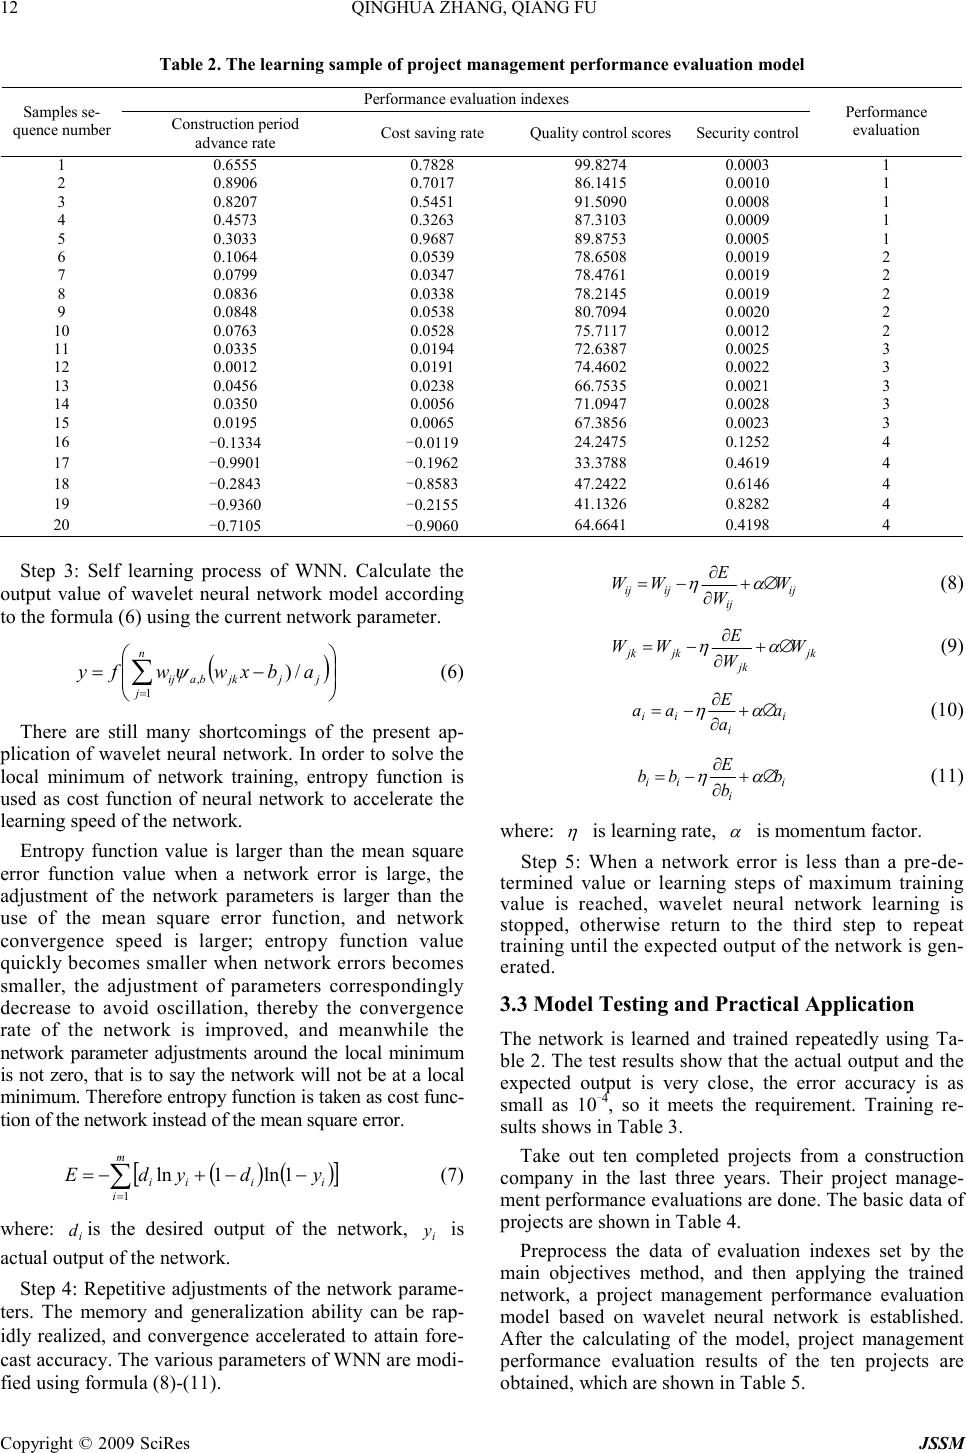 12 QINGHUA ZHANG, QIANG FU Copyright © 2009 SciRes JSSM Table 2. The learning sample of project management performance evaluation model Performance evaluation indexes Samples se- quence number Construction period advance rate Cost saving rate Quality control scores Security control Performance evaluation 1 0.6555 0.7828 99.8274 0.0003 1 2 0.8906 0.7017 86.1415 0.0010 1 3 0.8207 0.5451 91.5090 0.0008 1 4 0.4573 0.3263 87.3103 0.0009 1 5 0.3033 0.9687 89.8753 0.0005 1 6 0.1064 0.0539 78.6508 0.0019 2 7 0.0799 0.0347 78.4761 0.0019 2 8 0.0836 0.0338 78.2145 0.0019 2 9 0.0848 0.0538 80.7094 0.0020 2 10 0.0763 0.0528 75.7117 0.0012 2 11 0.0335 0.0194 72.6387 0.0025 3 12 0.0012 0.0191 74.4602 0.0022 3 13 0.0456 0.0238 66.7535 0.0021 3 14 0.0350 0.0056 71.0947 0.0028 3 15 0.0195 0.0065 67.3856 0.0023 3 16 -0.1334 -0.0119 24.2475 0.1252 4 17 -0.9901 -0.1962 33.3788 0.4619 4 18 -0.2843 -0.8583 47.2422 0.6146 4 19 -0.9360 -0.2155 41.1326 0.8282 4 20 -0.7105 -0.9060 64.6641 0.4198 4 Step 3: Self learning process of WNN. Calculate the output value of wavelet neural network model according to the formula (6) using the current network parameter. ( ) −= ∑ = n jjjjkbaij abxwwfy 1, /) ψ (6) There are still many shortcomings of the present ap- plication of wavelet neural network. In order to solve the local minimum of network training, entropy function is used as cost function of neural network to accelerate the learning speed of the network. Entropy function value is larger than the mean square error function value when a network error is large, the adjustment of the network parameters is larger than the use of the mean square error function, and network convergence speed is larger; entropy function value quickly becomes smaller when network errors becomes smaller, the adjustment of parameters correspondingly decrease to avoid oscillation, thereby the convergence rate of the network is improved, and meanwhile the network parameter adjustments around the local minimum is not zero, that is to say the network will not be at a local minimum. Therefore entropy function is taken as cost func- tion of the network instead of the mean square error. ( )( ) [ ] ∑ = −−+−= m iiiii ydydE 1 1ln1ln (7) where: i d is the desired output of the network, i y is actual output of the network. Step 4: Repetitive adjustments of the network parame- ters. The memory and generalization ability can be rap- idly realized, and convergence accelerated to attain fore- cast accuracy. The various parameters of WNN are modi- fied using formula (8)-(11). ij ij ijij W W E WW∆+ ∂ ∂ −= αη (8) jk jk jkjk W W E WW ∆+ ∂ ∂ −= αη (9) i i ii a a E aa ∆+ ∂ ∂ −= αη (10) i i ii b b E bb ∆+ ∂ ∂ −= αη (11) where: η is learning rate, α is momentum factor. Step 5: When a network error is less than a pre-de- termined value or learning steps of maximum training value is reached, wavelet neural network learning is stopped, otherwise return to the third step to repeat training until the expected output of the network is gen- erated. 3.3 Model Testing and Practical Application The network is learned and trained repeatedly using Ta- ble 2. The test results show that the actual output and the expected output is very close, the error accuracy is as small as 10 - 4 , so it meets the requirement. Training re- sults shows in Table 3. Take out ten completed projects from a construction company in the last three years. Their project manage- ment performance evaluations are done. The basic data of projects are shown in Table 4. Preprocess the data of evaluation indexes set by the main objectives method, and then applying the trained network, a project management performance evaluation model based on wavelet neural network is established. After the calculating of the model, project management performance evaluation results of the ten projects are obtained, which are shown in Table 5. 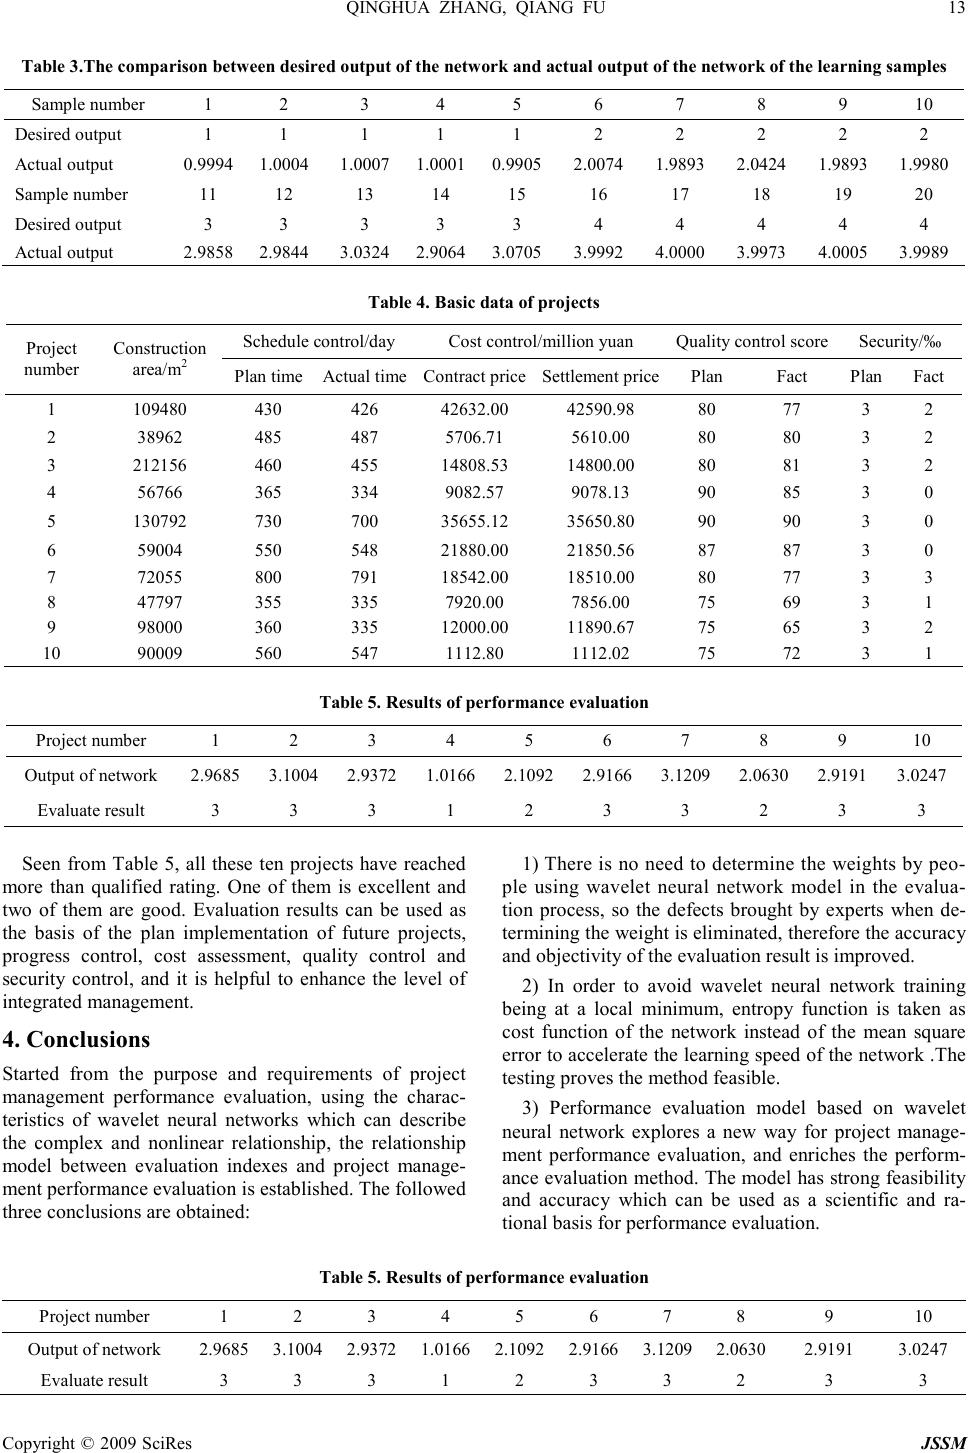 QINGHUA ZHANG, QIANG FU 13 Copyright © 2009 SciRes JSSM Table 3.The comparison between desired output of the network and actual output of the network of the learning samples Sample number 1 2 3 4 5 6 7 8 9 10 Desired output 1 1 1 1 1 2 2 2 2 2 Actual output 0.9994 1.0004 1.0007 1.0001 0.9905 2.0074 1.9893 2.0424 1.9893 1.9980 Sample number 11 12 13 14 15 16 17 18 19 20 Desired output 3 3 3 3 3 4 4 4 4 4 Actual output 2.9858 2.9844 3.0324 2.9064 3.0705 3.9992 4.0000 3.9973 4.0005 3.9989 Table 4. Basic data of projects Schedule control/day Cost control/million yuan Quality control score Security/‰ Project number Construction area/m 2 Plan time Actual time Contract price Settlement price Plan Fact Plan Fact 1 109480 430 426 42632.00 42590.98 80 77 3 2 2 38962 485 487 5706.71 5610.00 80 80 3 2 3 212156 460 455 14808.53 14800.00 80 81 3 2 4 56766 365 334 9082.57 9078.13 90 85 3 0 5 130792 730 700 35655.12 35650.80 90 90 3 0 6 59004 550 548 21880.00 21850.56 87 87 3 0 7 72055 800 791 18542.00 18510.00 80 77 3 3 8 47797 355 335 7920.00 7856.00 75 69 3 1 9 98000 360 335 12000.00 11890.67 75 65 3 2 10 90009 560 547 1112.80 1112.02 75 72 3 1 Table 5. Results of performance evaluation Project number 1 2 3 4 5 6 7 8 9 10 Output of network 2.9685 3.1004 2.9372 1.0166 2.1092 2.9166 3.1209 2.0630 2.9191 3.0247 Evaluate result 3 3 3 1 2 3 3 2 3 3 Seen from Table 5, all these ten projects have reached more than qualified rating. One of them is excellent and two of them are good. Evaluation results can be used as the basis of the plan implementation of future projects, progress control, cost assessment, quality control and security control, and it is helpful to enhance the level of integrated management. 4. Conclusions Started from the purpose and requirements of project management performance evaluation, using the charac- teristics of wavelet neural networks which can describe the complex and nonlinear relationship, the relationship model between evaluation indexes and project manage- ment performance evaluation is established. The followed three conclusions are obtained: 1) There is no need to determine the weights by peo- ple using wavelet neural network model in the evalua- tion process, so the defects brought by experts when de- termining the weight is eliminated, therefore the accuracy and objectivity of the evaluation result is improved. 2) In order to avoid wavelet neural network training being at a local minimum, entropy function is taken as cost function of the network instead of the mean square error to accelerate the learning speed of the network .The testing proves the method feasible. 3) Performance evaluation model based on wavelet neural network explores a new way for project manage- ment performance evaluation, and enriches the perform- ance evaluation method. The model has strong feasibility and accuracy which can be used as a scientific and ra- tional basis for performance evaluation. Table 5. Results of performance evaluation Project number 1 2 3 4 5 6 7 8 9 10 Output of network 2.9685 3.1004 2.9372 1.0166 2.1092 2.9166 3.1209 2.0630 2.9191 3.0247 Evaluate result 3 3 3 1 2 3 3 2 3 3  14 QINGHUA ZHANG, QIANG FU Copyright © 2009 SciRes JSSM REFERENCES [1] L. X. Zhang, “Fuzzy comprehensive evaluation of the expressway project management performance evalua- tion,” Road traffic technology (applications) 5, pp. 169 - 171, 2007. [2] S. H. Cai, M. Y. Zhou, and Z. C. Ye, “Fuzzy integrative evaluation method of management performance of engi- neering project,” Journal of YangZhou university (natural science), 5, pp. 57 - 60, 2002. [3] V. Ireland, “The role of management actions in the cost, time and quality performance of high-rise commer cial building projects,” Construction Management and Economics, 3, pp. 59 - 87, 1985. [4] T. Brian and H. Szu, “Adaptive wavelet classification of acoustic backscatter and imagery,” Optical Engineering, 7, pp. 2192 - 2202, 1994. [5] Q. H. Zhang and A. Benveniste, “Wavelet networks,” IEEE Transactions on Neural Networds, 6, 889 - 898, 1992. [6] X. Y. Zhao., Q. Fu, and Z. X. Xing, “Application of pro- jection pursuit grade evaluation model in comprehensive evaluation of changes in soil quality,” Acta Pedologica Sinica. 1, pp. 164 - 168, 2007. (Edited by Vivian and Ann) |