 Advances in Applied Sociology 2012. Vol.2, No.4, 325-343 Published Online December 2012 in SciRes (http://www.SciRP.org/journal/aasoci) http://dx.doi.org/10.4236/aasoci.2012.24043 Copyright © 2012 SciRes . 325 China’s Energy Diplomacy: SOE Relations in the Context of Global Distribution and Investment Pattern Hui-Chi Yeh1, Chi-Wei Yu2 1Politics and International Relations, Un i v ersity of Southampton, Southampton, UK 2Department of Politics, N ational Taiwan University, Taipei, Taiwan Email: H.Yeh@soton.ac.uk Received September 23rd, 2012; revi se d Oc t ob e r 24th, 2012; accepted November 7th, 2012 This article addresses the mercantilist connotations of China’s energy diplomacy through empirical and quantitative approaches by arguing that: firstly, the economic logic motivating Chinese enterprises is not the key variable in the formulation of foreign investment decisions; secondly, the energy security policies of the Chinese government are key variables which decide the distribution of SOEs’ foreign investment; thirdly, China’s energy diplomacy is mercantilist in nature due to the weakness of its SOEs in the struc- ture of the international market; finally, under the premise of satisfying its government’s energy security policy, SOEs have autonomy in their approaches to investment. Therefore, it may be reasoned that under specific conditions, mercantilism and liberalism can both explain China’s energy diplomacy. This article provides compelling evidence supporting this reasoning, through analyzing cases studies in the Middle East, Central Asia and Africa. Keywords: Mercantilism; China’s Energy Diplomacy; State Owned Enterprises (SOEs) Introduction China’s establishment of energy strategies and diplomacy principles based on concepts of diversification and outreach, initiated the entry of its major state-owned companies into global markets and propagated substantial increases in global energy prices. Some viewed this in neo-colonialist terms, as it deepened the dependency of energy rich developing nations on China (Blair, 2007) and contributed little to poverty alleviation (Polgreen & French, 2007). Others viewed such investments as mercantilist and aimed at strengthening national power. Never- theless, both views fail to represent fully the overseas invest- ments of Chinese energy corporations. There has been limited academic research on the geographical composition of Chinese energy diplomacy, most of which has been conducted by entre- preneurs and executives in Chinese energy corporations. Xu Xiaojie, the former director of the Office of Overseas Invest- ment for the state-owned China National Petroleum Corpora- tion (CNPC), discussed the role of China in future global en- ergy strategies, and emphasized the relationship between the energy rich nations of Central Asia and the Middle East and China’s energy security (Xu, 1998). Director Xin Zhang of the International Division of the CNPC and Deputy Wang Jiashu of the Mining Resources Committee of the China Mining Asso- ciation (CMA) highlighted the significant role that the Middle East plays in China’s energy diplomacy and security strategy (Wang, 2004; Li, 2003; Zekun, 2004). The development of Chinese energy corporations has lagged behind Western counterparts, due in part to international mechanisms and systems for controlling energy prices by Mid- dle Eastern nations. This makes regional investment decisions costly, and also contradicts the principle of diversification, which aims to reduce the risk of interference in domestic mar- ket prices. However, from recent global investment patterns of Chinese energy corporations, the number of cases where ex- traction and ownership permits were purchased from oil pro- ducing countries greatly exceeded the number of direct oil pur- chase cases. This casts doubt on literature which emphasizes the Middle East’s role in building energy security. This article aims to test the dominant theory that China’s en- ergy diplomacy exhibits mercantilism, in order to adequately explain China’s relations with energy rich developing nations. This article examines the contracts made by the CNPC, the China National Offshore Oil Corporation (CNOOC), and the China Petroleum & Chemical Corporation (CPCC) with energy rich nations from 1993 to 2008, and analyzes the relationships between both private and public sectors. In examining these relations, it is important to recognize re- gional dynamics, as resource endowments vary regionally. Consequently, selected regions should be endowed with sub- stantial gas and petroleum resources. Therefore, Europe, Asia- Pacific and South Asia are excluded. Secondly, mercantilism places strong emphasis on national/governmental interference in market principles or economic order. So when a host coun- try’s national power exceeds that of China, two sets of variables (interference from both the host country and Chinese govern- ment) may occur in testing processes. Consequently, the case studies selected focus upon Central Asia, the Middle East, and Africa. Mercantilism and the Growth of Neo-Mercantilism Despite the importance of mercantilism in international po- litical economics, no universal definition exists (Mcdermott, 1999). Robert Gilpin cited economic nationalism when con- ceptualizing mercantilism and neo-mercantilism (Lairson & Skidmore, 2002; Gilpin, 1987). Goldstein argued that economic  H.-C. YEH, C.-W. YU activities represent national development and interests (Gold- stein, 2003). Mercantilism originated from European nations’ overseas expansion between 1500 and 1776, which was viewed as a nation’s pursuit of power and wealth. In countries with declining economic performance, rent-seeking actors would adopt free trade and modern political economic measures to enhance national power economically. In these early stages of mercantilism, gold and silver represented national power and wealth, and led to over-emphasized protectionism (Schmiege- low & Schmiegelow, 1975), through attempts to simultaneously increase import costs and exports (Buzan & Little, 2009). This resulted in zero-sum schemes in the international economy. However, from 1750 onwards, many countries were affected by the excessive importation of British products, which prompted less developed countries to embrace trade and do- mestic industry protectionism. Scholars, like Frederick List, who advocated protectionism and state interference, were termed neo-mercantilists. Unlike mercantilists, neo-mercantil- ists believed that nations should seek rare resources and poten- tial markets abroad, in addition to determining national power through alternative measures including population, transporta- tion systems, and wider definitions for economic power, rather than in terms of gold and silver (Bohning, 1979). According to the definitions of mercantilism and neo-mer- cantilism, their characteristics could be categorized accordingly: firstly, the core concept conceived that economic activities depended on national development or interests (Goldstein, 2003); secondly, economic activities aimed to increase social welfare and national interests, and all national industries should be protected (Gilpin, 1987); thirdly, economic strategies advo- cated by mercantilism focused on protecting or developing domestic industries. These strategies include the provision of foreign aid or subsidies to boost domestic economic develop- ment, strengthen tariff or non-tariff barriers to protect domestic industries, or strengthen international competitiveness of do- mestic industries through economic or political subsidies; fourth, the concept of power and wealth was interchangeable (Dougherty & Pfaltzgraff, 2002); finally, industrialization pro- moted economic development. Sound economic power was fundamental to protecting national sovereignty while industri- alization further strengthened national military power (Gilpin, 1987). Following WWII, when global economic markets embraced liberalization, the General Agreement on Tariffs and Trade (GATT) and World Trade Organization (WTO) began consoli- dating and implementing free trade, and progressively elimi- nating mercantilism. Moreover, the measurement of national power in gold and silver terms became outdated; like currency, these commodities became merely trading tools. In facing similar critiques, mercantilism faced strong opposition and led protectionism advocates to pursue alternative ideas, primarily in specialized or technology-intensive industries like energy, communication technology, and aviation (Held, Mcgrew, Gold- blatt, & Perraton, 1999). Economic development began in East Asia after WWII, through the adoption of the development strategy of “Rational Planning”, directing markets when appropriate, protecting new and high technology industries, and integrating resources into technological growth (Wang, 2003). The theories associated with this development strategy were neo-protectionism and strategic trade theory. Neo-protectionism emphasized increas- ing import-export profits, while strategic trade theory criticized free trade theory and overlooked associated developmental weaknesses (Brander, 1995a). It focused on studying imperfect competition whilst emphasizing market structure in oligopolies (Markusen, Melvin, Kaempfer, & Maskus, 1995). Krugman argued that liberal opposition to US President Reagan contributed to the rise of strategic trade theory (Krug- man, 1994). Different from conventional free trade policies, strategic trade theory stressed that active state interference in trade policies nurtured national power and economic develop- ment (Krugman, 1986); such factors are interdependent charac- teristics of oligopolies (Brander, 1995b). Consequently, profits from one firm might directly affect the decisions of another. In imperfect competitive markets, firms are mutually interde- pendent while governments could increase domestic industrial competitiveness through appropriate trade policies. Strategic trade theory stresses the government’s role in do- mestic industrial development. While conventional free trade theory promotes constant comparative advantage, strategic trade theory advocates dynamic comparative advantage, and suggests that government and industry are capable of fine-tun- ing comparative advantage. Two examples include investment in the Japanese semiconductor industry and support for the European aviation industry (Reimer & Steigert, 2006). More- over, comparative advantage might be altered by governmental and industrial accomplishments. This implies that under perfect free trade regulations, increased competitiveness could be achievable through governmental market interference. Thus, competition serves as the basis for international economic rela- tionships. However, in imperfect competitive markets, the ef- forts of one government and industry to increase competitive- ness might be offset by another, ultimately, propagating an “an eye for an eye” scenario in international economic relationships (Thurow, 1992). Hypothesis The hypothesis of this article conceives that Chinese energy diplomacy exhibits neo-mercantilism. This article developed four sub-hypotheses based on neo-mercantilist theory and re- cent developments in Chinese energy corporations and energy diplomacy. The first sub-hypothesis conceptualizes that economic activi- ties represe n t national interest s. Thus, the key factor influencing economic activity is national interest rather than individual profits. For net oil importing countries, basic interests regard strengthening energy security. If the energy diplomacy of the target country resembles neo-mercantilism, the costs of invest- ment and profits are not principal issues for energy corporations when making overseas investments. Therefore, the first sub- hypothesis is: the costs of investment and profits are not key issues for Chinese energy corporations when making overseas investments. The relationships are rather weak and insignificant, and since another major claim of neo-mercantilism, advocating development through “Rational Planning”, then state interfer- ence and resource integration for boosting industrial develop- ment are appropriate. It is widely accepted that profit and in- vestment decisions of individual firms may be mutually in- compatible with the interests and decision-making logic of the nation. Therefore, under these conditions, it is expected that individual firms play comparatively less significant roles in making overseas investment decisions. Hence, the second sub-hypothesis is: when making overseas investment decisions, Copyright © 2012 SciRe s . 326 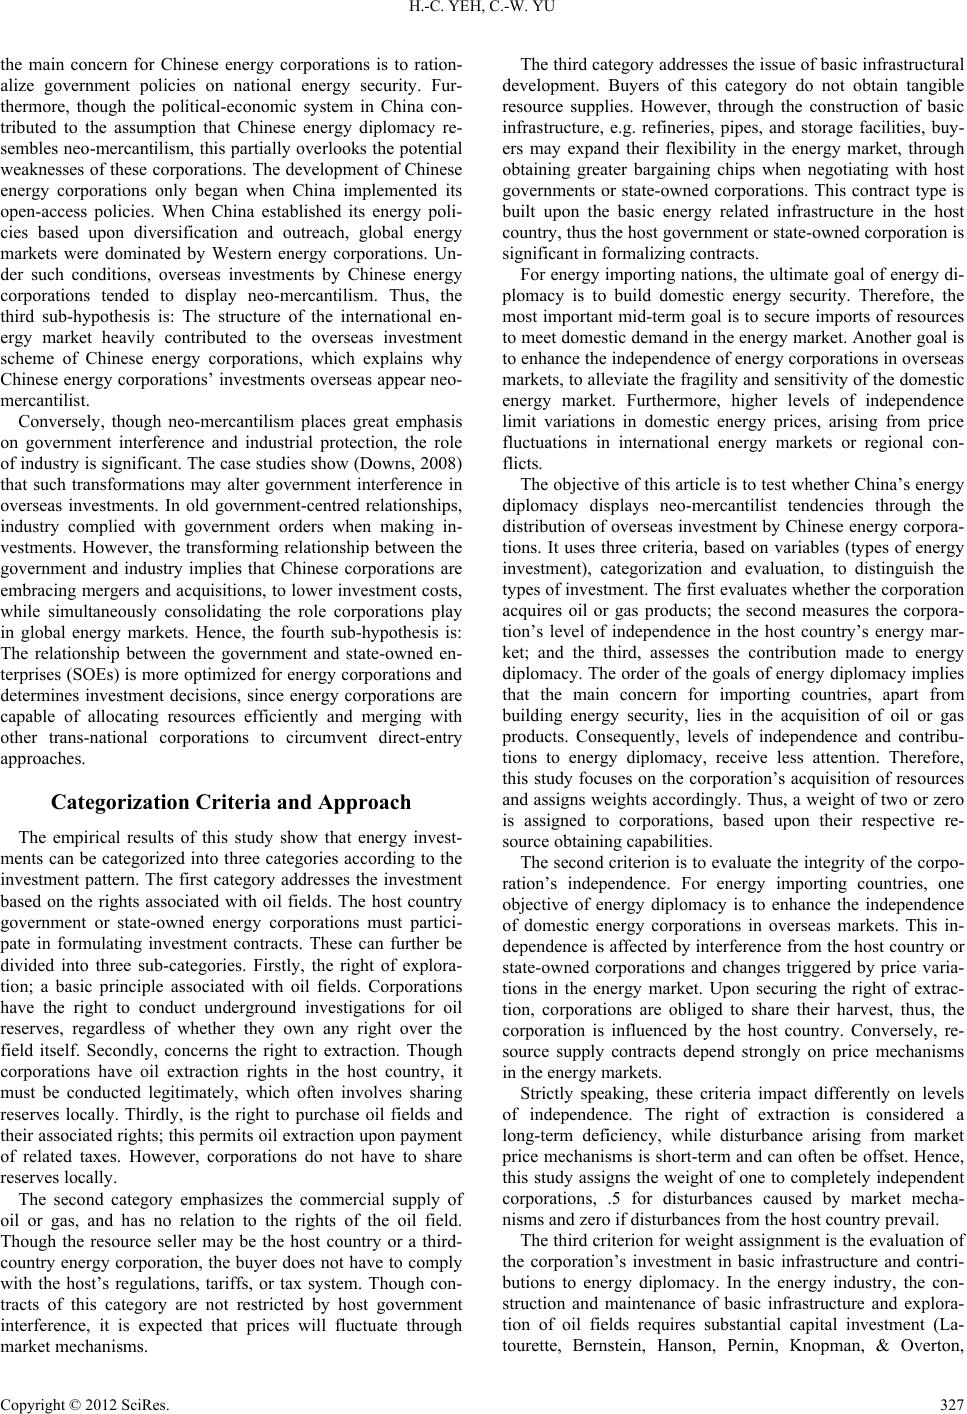 H.-C. YEH, C.-W. YU the main concern for Chinese energy corporations is to ration- alize government policies on national energy security. Fur- thermore, though the political-economic system in China con- tributed to the assumption that Chinese energy diplomacy re- sembles neo-mercantilism, this partially overlooks the potential weaknesses of these corporations. The development of Chinese energy corporations only began when China implemented its open-access policies. When China established its energy poli- cies based upon diversification and outreach, global energy markets were dominated by Western energy corporations. Un- der such conditions, overseas investments by Chinese energy corporations tended to display neo-mercantilism. Thus, the third sub-hypothesis is: The structure of the international en- ergy market heavily contributed to the overseas investment scheme of Chinese energy corporations, which explains why Chinese energy corporations’ investments overseas appear neo- mercantilist. Conversely, though neo-mercantilism places great emphasis on government interference and industrial protection, the role of industry is significant. The case studies show (Downs, 2008) that such transformations may alter government interference in overseas investments. In old government-centred relationships, industry complied with government orders when making in- vestments. However, the transforming relationship between the government and industry implies that Chinese corporations are embracing mergers and acquisitions, to lower investment costs, while simultaneously consolidating the role corporations play in global energy markets. Hence, the fourth sub-hypothesis is: The relationship between the government and state-owned en- terprises (SOEs) is more optimized for energy corporations and determines investment decisions, since energy corporations are capable of allocating resources efficiently and merging with other trans-national corporations to circumvent direct-entry approaches. Categorization Criteria and Approach The empirical results of this study show that energy invest- ments can be categorized into three categories according to the investment pattern. The first category addresses the investment based on the rights associated with oil fields. The host country government or state-owned energy corporations must partici- pate in formulating investment contracts. These can further be divided into three sub-categories. Firstly, the right of explora- tion; a basic principle associated with oil fields. Corporations have the right to conduct underground investigations for oil reserves, regardless of whether they own any right over the field itself. Secondly, concerns the right to extraction. Though corporations have oil extraction rights in the host country, it must be conducted legitimately, which often involves sharing reserves locally. Thirdly, is the right to purchase oil fields and their associated rights; this permits oil extraction upon payment of related taxes. However, corporations do not have to share reserves locally. The second category emphasizes the commercial supply of oil or gas, and has no relation to the rights of the oil field. Though the resource seller may be the host country or a third- country energy corporation, the buyer does not have to comply with the host’s regulations, tariffs, or tax system. Though con- tracts of this category are not restricted by host government interference, it is expected that prices will fluctuate through market mechanisms. The third category addresses the issue of basic infrastructural development. Buyers of this category do not obtain tangible resource supplies. However, through the construction of basic infrastructure, e.g. refineries, pipes, and storage facilities, buy- ers may expand their flexibility in the energy market, through obtaining greater bargaining chips when negotiating with host governments or state-owned corporations. This contract type is built upon the basic energy related infrastructure in the host country, thus the host government or state-owned corporation is significant in formalizing contracts. For energy importing nations, the ultimate goal of energy di- plomacy is to build domestic energy security. Therefore, the most important mid-term goal is to secure imports of resources to meet domestic demand in the energy market. Another goal is to enhance the independence of energy corporations in overseas markets, to alleviate the fragility and sensitivity of the domestic energy market. Furthermore, higher levels of independence limit variations in domestic energy prices, arising from price fluctuations in international energy markets or regional con- flicts. The objective of this article is to test whether China’s energy diplomacy displays neo-mercantilist tendencies through the distribution of overseas investment by Chinese energy corpora- tions. It uses three criteria, based on variables (types of energy investment), categorization and evaluation, to distinguish the types of i nvestment . The first evaluates whether the corporation acquires oil or gas products; the second measures the corpora- tion’s level of independence in the host country’s energy mar- ket; and the third, assesses the contribution made to energy diplomacy. The order of the goals of energy diplomacy implies that the main concern for importing countries, apart from building energy security, lies in the acquisition of oil or gas products. Consequently, levels of independence and contribu- tions to energy diplomacy, receive less attention. Therefore, this study focuses on the corporation’s acquisition of resources and assigns weights accordingly. Thus, a weight of two or zero is assigned to corporations, based upon their respective re- source obtaining capabilities. The second criterion is to evaluate the integrity of the corpo- ration’s independence. For energy importing countries, one objective of energy diplomacy is to enhance the independence of domestic energy corporations in overseas markets. This in- dependence is affected by interference from the host country or state-owned corporations and changes triggered by price varia- tions in the energy market. Upon securing the right of extrac- tion, corporations are obliged to share their harvest, thus, the corporation is influenced by the host country. Conversely, re- source supply contracts depend strongly on price mechanisms in the energy markets. Strictly speaking, these criteria impact differently on levels of independence. The right of extraction is considered a long-term deficiency, while disturbance arising from market price mechanisms is short-term and can often be offset. Hence, this study assigns the weight of one to completely independent corporations, .5 for disturbances caused by market mecha- nisms and zero if disturbances from the host country prevail. The third criterion for weight assignment is the evaluation of the corporation’s investment in basic infrastructure and contri- butions to energy diplomacy. In the energy industry, the con- struction and maintenance of basic infrastructure and explora- tion of oil fields requires substantial capital investment (La- tourette, Bernstein, Hanson, Pernin, Knopman, & Overton, Copyright © 2012 SciRe s . 327 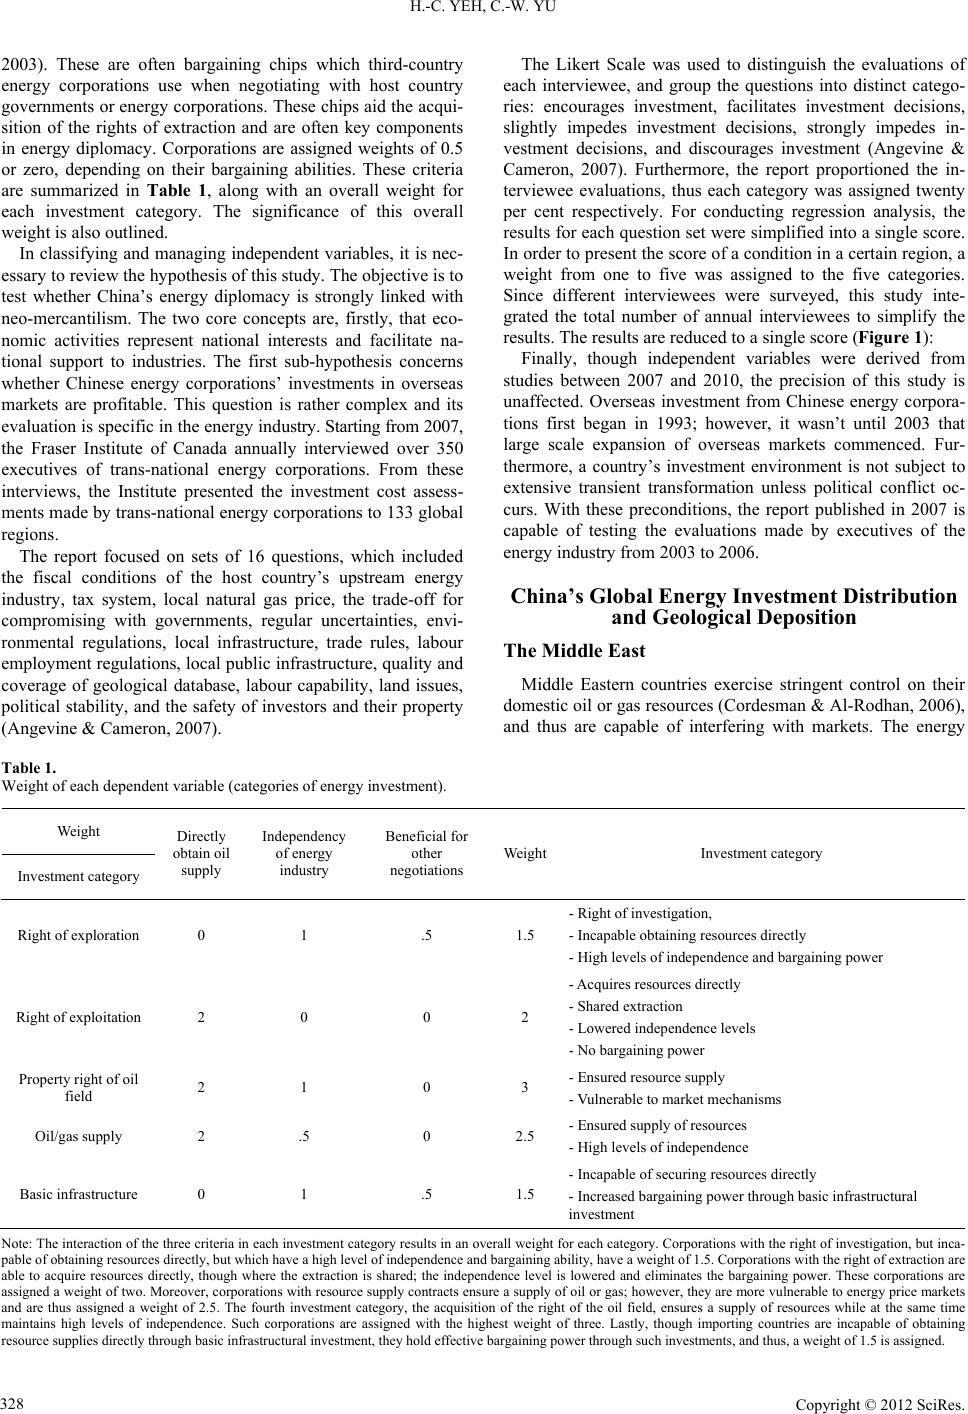 H.-C. YEH, C.-W. YU Copyright © 2012 SciRe s . 328 2003). These are often bargaining chips which third-country energy corporations use when negotiating with host country governments or energy corporations. These chips aid the acqui- sition of the rights of extraction and are often key components in energy diplomacy. Corporations are assigned weights of 0.5 or zero, depending on their bargaining abilities. These criteria are summarized in Table 1, along with an overall weight for each investment category. The significance of this overall weight is also outlined. In classifying and managing independent variables, it is nec- essary to review the hypothesis of this study. The objective is to test whether China’s energy diplomacy is strongly linked with neo-mercantilism. The two core concepts are, firstly, that eco- nomic activities represent national interests and facilitate na- tional support to industries. The first sub-hypothesis concerns whether Chinese energy corporations’ investments in overseas markets are profitable. This question is rather complex and its evaluation is specific in the energy industry. Starting from 2007, the Fraser Institute of Canada annually interviewed over 350 executives of trans-national energy corporations. From these interviews, the Institute presented the investment cost assess- ments made by trans-national energy corporations to 133 global regions. The report focused on sets of 16 questions, which included the fiscal conditions of the host country’s upstream energy industry, tax system, local natural gas price, the trade-off for compromising with governments, regular uncertainties, envi- ronmental regulations, local infrastructure, trade rules, labour employment regulations, local public infrastructure, quality and coverage of geological database, labour capability, land issues, political stability, and the safety of investors and their property (Angevine & Cameron, 2007). The Likert Scale was used to distinguish the evaluations of each interviewee, and group the questions into distinct catego- ries: encourages investment, facilitates investment decisions, slightly impedes investment decisions, strongly impedes in- vestment decisions, and discourages investment (Angevine & Cameron, 2007). Furthermore, the report proportioned the in- terviewee evaluations, thus each category was assigned twenty per cent respectively. For conducting regression analysis, the results for each question set were simplified into a single score. In order to present the score of a condition in a certain region, a weight from one to five was assigned to the five categories. Since different interviewees were surveyed, this study inte- grated the total number of annual interviewees to simplify the results. The results are reduced to a single score (Figure 1): Finally, though independent variables were derived from studies between 2007 and 2010, the precision of this study is unaffected. Overseas investment from Chinese energy corpora- tions first began in 1993; however, it wasn’t until 2003 that large scale expansion of overseas markets commenced. Fur- thermore, a country’s investment environment is not subject to extensive transient transformation unless political conflict oc- curs. With these preconditions, the report published in 2007 is capable of testing the evaluations made by executives of the energy industry from 2003 to 2006. China’s Global Energy Investment Distribution and Geological Deposition The Middle East Middle Eastern countries exercise stringent control on their domestic oil or gas resources (Cordesman & Al-Rodhan, 2006), and thus are capable of interfering with markets. The energy Table 1. Weight of each dependent variable (categories of energy investment). Weight Investm ent category Directly obtain oil supply Independency of energy industry Beneficial for other negotiations WeightInvestm ent category Right of exploration 0 1 .5 1.5 - Right of investigation, - Incapable obtaining resources directly - High levels of independence and ba rgaining power Right of exploitation 2 0 0 2 - Acquires resources directly - Shared extraction - Lowered in d epende nce levels - No bargaining power Property right of oil field 2 1 0 3 - Ensured resource supply - Vulnerable to market mechanisms Oil/gas supply 2 .5 0 2.5 - Ensured supply of resourc es - High levels of indepe nd ence Basic infrastr ucture 0 1 .5 1.5 - Incapable of securing resources directly - Increased bargaining power through basic infrastructural investment Note: The interaction of the three criteria in each investment category results in an overall weight for each category. Corporation s with the ri ght of invest igation, but inca- pable of obtaining resources directly, but which have a hi gh level of i ndependence and bargaining ability, have a weight of 1.5. Corporations with the right of extraction are able to acquir e resources directly, though wh ere the extraction is shared; the independence level is lowered and eliminates the bargaining power. These corp orations are assigned a weight of two. Moreover, corporations with resource supply contracts ensure a supply of oil or g as; howeve r, they are more vulnerable to energy price markets and are thus assigned a weight of 2.5. The fourth investment category, the acquisition of the right of the oil field, ensures a supply of resources while at the same time maintains high levels of independence. Such corporations are assigned with the highest weight of three. Lastly, though importing countries are incapable of obtaining resource supplies directly through basic infras tructural investment, they hold effective bargaining power through such investments, and thus, a weight of 1.5 is assigned.  H.-C. YEH, C.-W. YU Figure 1. The equation for integrating independent variables market in these countries primarily depicts non-discriminating state-control where granted property rights over oil fields are refused to foreign energy enterprises. Under this condition, from 2003 to 2010, Chinese energy enterprises made 74 in- vestments in the Middle East with 146 rights of oil fields or construction work (Table 2 and Figure 2), primarily comprised from property rights over oil fields, extraction, investigation, and supply of oil or gas. Only China’s Middle Eastern investments in Qatar, UAE, and Oman were higher than global averages for the region. However, the performance of each index and total performance in Iraq and Iran were substantially below average. Chinese energy enterprises’ investments in Iraq and Iran comprised 28% of their total Middle Eastern investment. Additionally, most Chinese investments were made in Syria, where the economic performance was below the global average. According to this distribution scene, the first sub-hypothesis proposed may, par- tially, be testified. The number of investments from Chinese energy enterprises in each country reflected China’s regional difficulties (Table 3). The majority of investments went to Syria and Iran, which to- talled 56.7% of total investments. These nations are isolated internationally for political and human rights issues. Although the basic energy-related infrastructures in these countries are insufficient compared with other regional countries, they exer- cise absolute control over domestic oil fields and are well-equipped. The investment scheme made in Syria and Iran by Chinese energy corporations highlighted China’s investment targets and preferences. China’s initial investment in Syria involved cooperation be- tween Chinese energy enterprises and local government and enterprises. The Gbeibe oil fields exploited joint-investment from the CNPC, the Syrian Ministry of Oil, and Syria National Petroleum Corporation. Another investment path was coopera- tion with foreign investors, as seen by the merger of Al Furat Production Company’s stakeholders’ right to cooperate with the CNPC and the India Petroleum Natural Gas Corporation in 2005. However, from 2009, mergers and acquisitions with for- eign corporations became the principal investment path for Chinese enterprises. In 2008, the CNPC merged with Canadian Tanganyika Oil and acquired eight property rights over oil fields. In 2010, CNPC merged with a subsidiary of Shell in Syria, and acquired 40 oil fields. Conversely, the investments from Chinese energy corpora- tions in Iran emphasized mutual cooperation between govern- ments, including state-owned corporations. Reduced Western investment in Iran may also facilitate Chinese enterprises’ co- operation with host countries. However, a more critical differ- ence is that Chinese energy corporations’ investments in Iran principally focused on basic infrastructure. In the North Pars oil field, investment from the CNPC expedited liquefied natural gas factories and transportation facilities for liquefied natural gas. In 2009, the CNPC promised Iran US$6.5 billion in in- vestment for refining equipment. Hence, it can be suggested that a mutually beneficial relationship existed between Chinese energy corporations and the Iranian government. This enabled Iran to obtain the basic infrastructure needed for its oil refiner- ies, while at the same time granted China with the rights asso- ciated with Iranian oil and gas fields. Central Asia Trans-national energy enterprises were only able to increase their energy-related investments in Central Asia after the col- lapse of the USSR. Cooperation and dialog between Shanghai and the five countries of former Soviet Central Asia (Kazakh- stan, Kyrgyzstan, Uzbekistan, Tajikistan and Turkmenistan), and the Shanghai cooperation organization, strengthened mu- tual political trust between Central Asia and China. Addition- ally, no competitive relations among oil or gas exporting coun- tries existed, and therefore facilitated intensive energy-related cooperation between these countries (Nincic, 2009). Compared with the Middle East where unfavourable conditions arose due to host country interference, interference by Central Asian countries in energy markets proved beneficial to China. Table 4 and Figure 3 show how, from 2003 to 2010, a total of 43 investment projects were made in Central Asia by Chi- nese energy corporations, which included 160 right of oil fields or construction work. These were principally rights of investi- gation, extraction, property rights of oil fields, and supply of oil or gas. Investing patterns were credited in facilitating Chinese en- ergy corporations’ acquisition of 160 rights in 43 investment projects. The main approach for Chinese energy corporations’ regional investments was the establishment of new energy cor- porations through joint-investment with host country’s enter- prises and the merger with third-country enterprises. From 2003 to 2010, Chinese energy corporations acquired 39 rights through seven merger and acquisition projects. Five joint ven- tures were established, and 84 rights obtained, through coop- eration with state-owned energy enterprises in Kazakhstan and Uzbekistan, respectively. The merger and acquisition project completed by the CNPC, in 2009, is the best example of this investment pattern. The CNPC and Khazak National Petroleum and Natural Gas Corporation, co-financed Mangistau Invest- ments B.V. in the Netherlan d s. M an g is t a u Investments B.V. purchased all the properties of Mangistau Munai Gas (MMG) and acquired 15 rights of investigation and extraction each from the Kalamkas and Zhetybai regions. The CNPC’s four oil-gas pipe construction projects in Ka- Copyright © 2012 SciRe s . 329 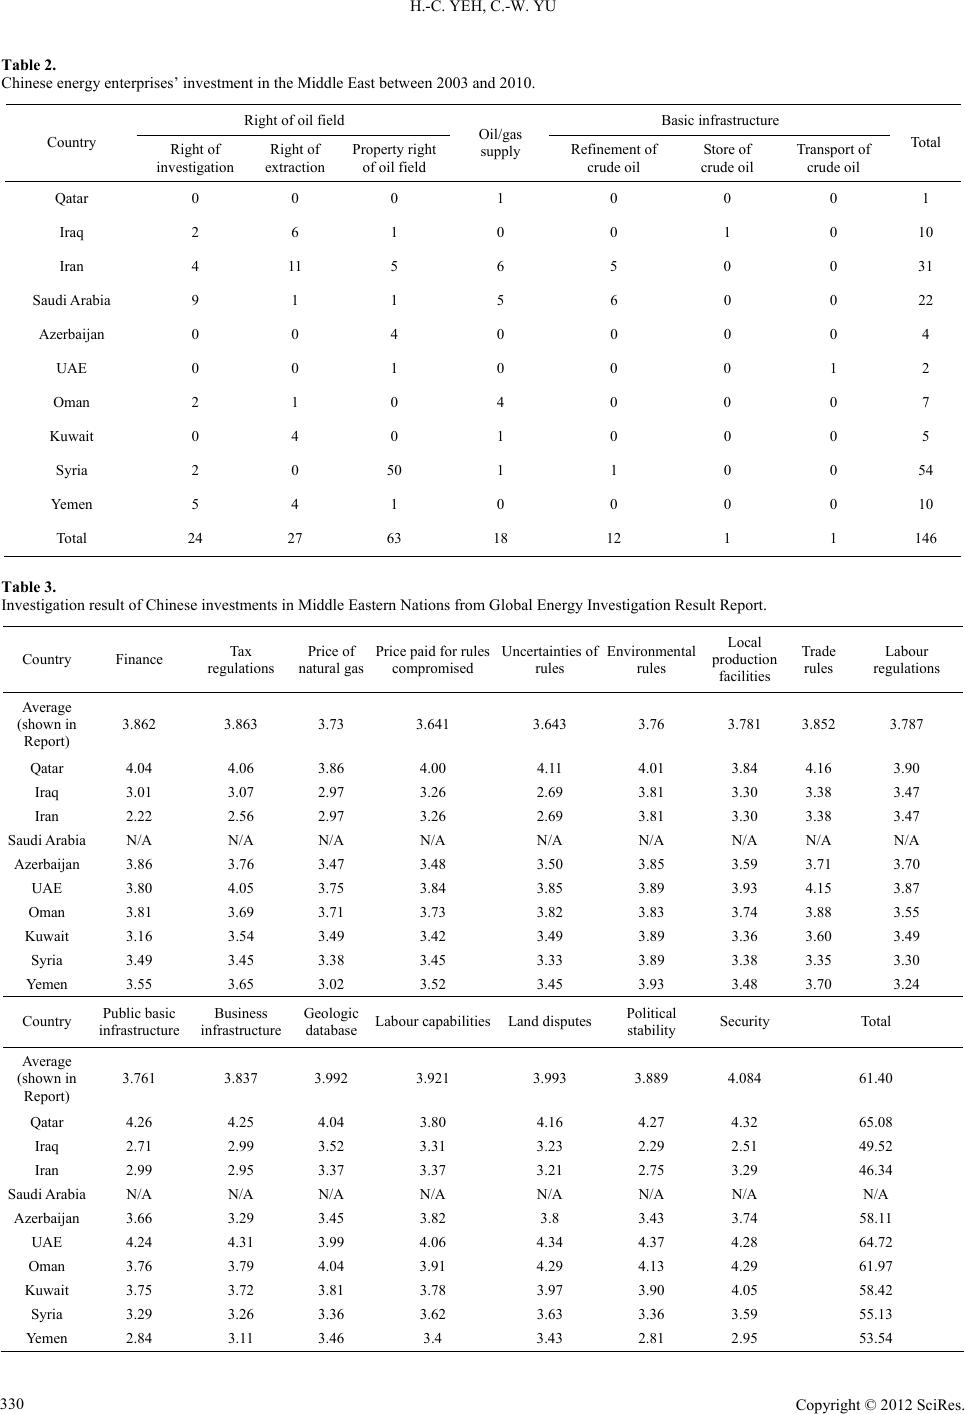 H.-C. YEH, C.-W. YU Table 2. Chinese energy enterprises’ investment in the Middle East between 2003 and 2010. Right of oil fiel d Basic infrastructure Country Right of investigation Right of extraction Property right of oil field Oil/gas supply Refinement of crude oil Store of crude oil T ra nsp ort of crude oil Total Qatar 0 0 0 1 0 0 0 1 Iraq 2 6 1 0 0 1 0 10 Iran 4 11 5 6 5 0 0 31 Saudi Arabia 9 1 1 5 6 0 0 22 Azerbaijan 0 0 4 0 0 0 0 4 UAE 0 0 1 0 0 0 1 2 Oman 2 1 0 4 0 0 0 7 Kuwait 0 4 0 1 0 0 0 5 Syria 2 0 50 1 1 0 0 54 Yemen 5 4 1 0 0 0 0 10 Total 24 27 63 18 12 1 1 146 Table 3. Investigation result of Chinese investments in Middle Eastern Nations from Global Energy Investigation Result Report. Country Finance Tax regulations Price of natural gas Price paid for rules compromised Uncertainties of rules Environmental rules Local production facilities Trade rules Labour regulations Average (shown in Report) 3.862 3.863 3.73 3.641 3.643 3.76 3.781 3.852 3.787 Qatar 4.04 4.06 3.86 4.00 4.11 4.01 3.84 4.16 3.90 Iraq 3.01 3.07 2.97 3.26 2.69 3.81 3.30 3.38 3.47 Iran 2.22 2.56 2.97 3.26 2.69 3.81 3.30 3.38 3.47 Saudi Arabia N/A N/A N/A N/A N/A N/A N/A N/A N/A Azerbaijan 3.86 3.76 3.47 3.48 3.50 3.85 3.59 3.71 3.70 UAE 3.80 4.05 3.75 3.84 3.85 3.89 3.93 4.15 3.87 Oman 3.81 3.69 3.71 3.73 3.82 3.83 3.74 3.88 3.55 Kuwait 3.16 3.54 3.49 3.42 3.49 3.89 3.36 3.60 3.49 Syria 3.49 3.45 3.38 3.45 3.33 3.89 3.38 3.35 3.30 Yemen 3.55 3.65 3.02 3.52 3.45 3.93 3.48 3.70 3.24 Country Public basic infrastructure Business infrastructure Geologic database Labour capabilit iesLand disputesPolitical stability Security Total Average (shown in Report) 3.761 3.837 3.992 3.921 3.993 3.889 4.084 61.40 Qatar 4.26 4.25 4.04 3.80 4.16 4.27 4.32 65.08 Iraq 2.71 2.99 3.52 3.31 3.23 2.29 2.51 49.52 Iran 2.99 2.95 3.37 3.37 3.21 2.75 3.29 46.34 Saudi Arabia N/A N/A N/A N/A N/A N/A N/A N/A Azerbaijan 3.66 3.29 3.45 3.82 3.8 3.43 3.74 58.11 UAE 4.24 4.31 3.99 4.06 4.34 4.37 4.28 64.72 Oman 3.76 3.79 4.04 3.91 4.29 4.13 4.29 61.97 Kuwait 3.75 3.72 3.81 3.78 3.97 3.90 4.05 58.42 Syria 3.29 3.26 3.36 3.62 3.63 3.36 3.59 55.13 Yemen 2.84 3.11 3.46 3.4 3.43 2.81 2.95 53.54 Copyright © 2012 SciRe s . 330 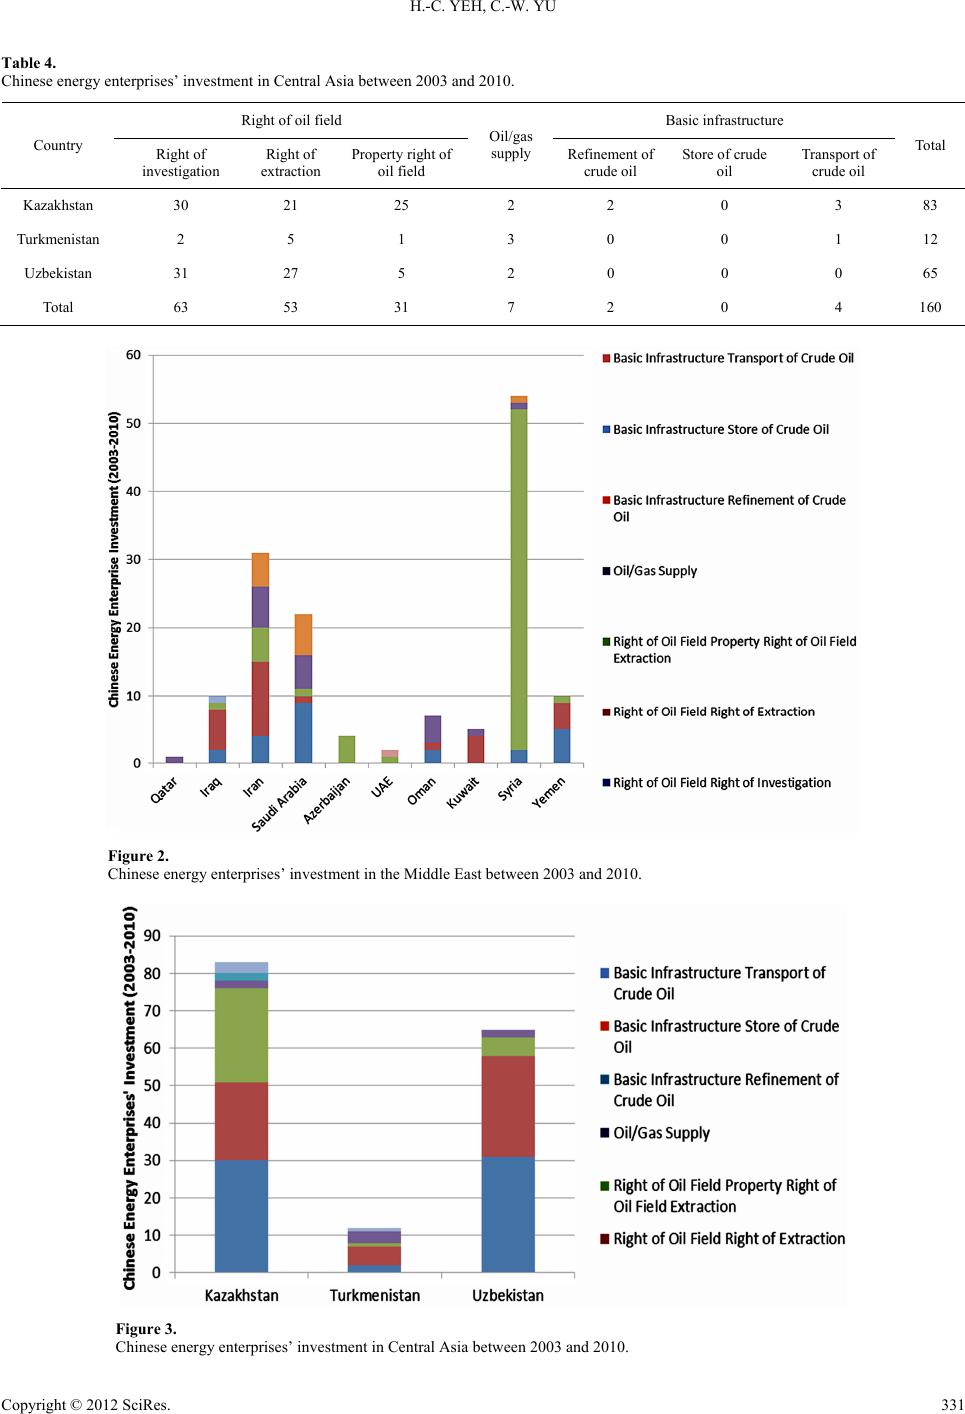 H.-C. YEH, C.-W. YU Table 4. Chinese energy enterprises’ investment in Central Asia between 2003 and 2010. Right of oil fiel d Basic infrastructure Country Right of investigation Right of extraction Property right of oil field Oil/gas supply Refinement of crude oil Store of crude oil T ra nsp ort of crude oil Total Kazakhstan 30 21 25 2 2 0 3 83 Turkmenistan 2 5 1 3 0 0 1 12 Uzbekistan 31 27 5 2 0 0 0 65 Total 63 53 31 7 2 0 4 160 Figure 2. Chinese energy enterprises’ investment in the Middle East between 2003 and 2010. Figure 3. Chinese energy enterprises’ investment in Central Asia between 2003 and 2010. Copyright © 2012 SciRe s . 331 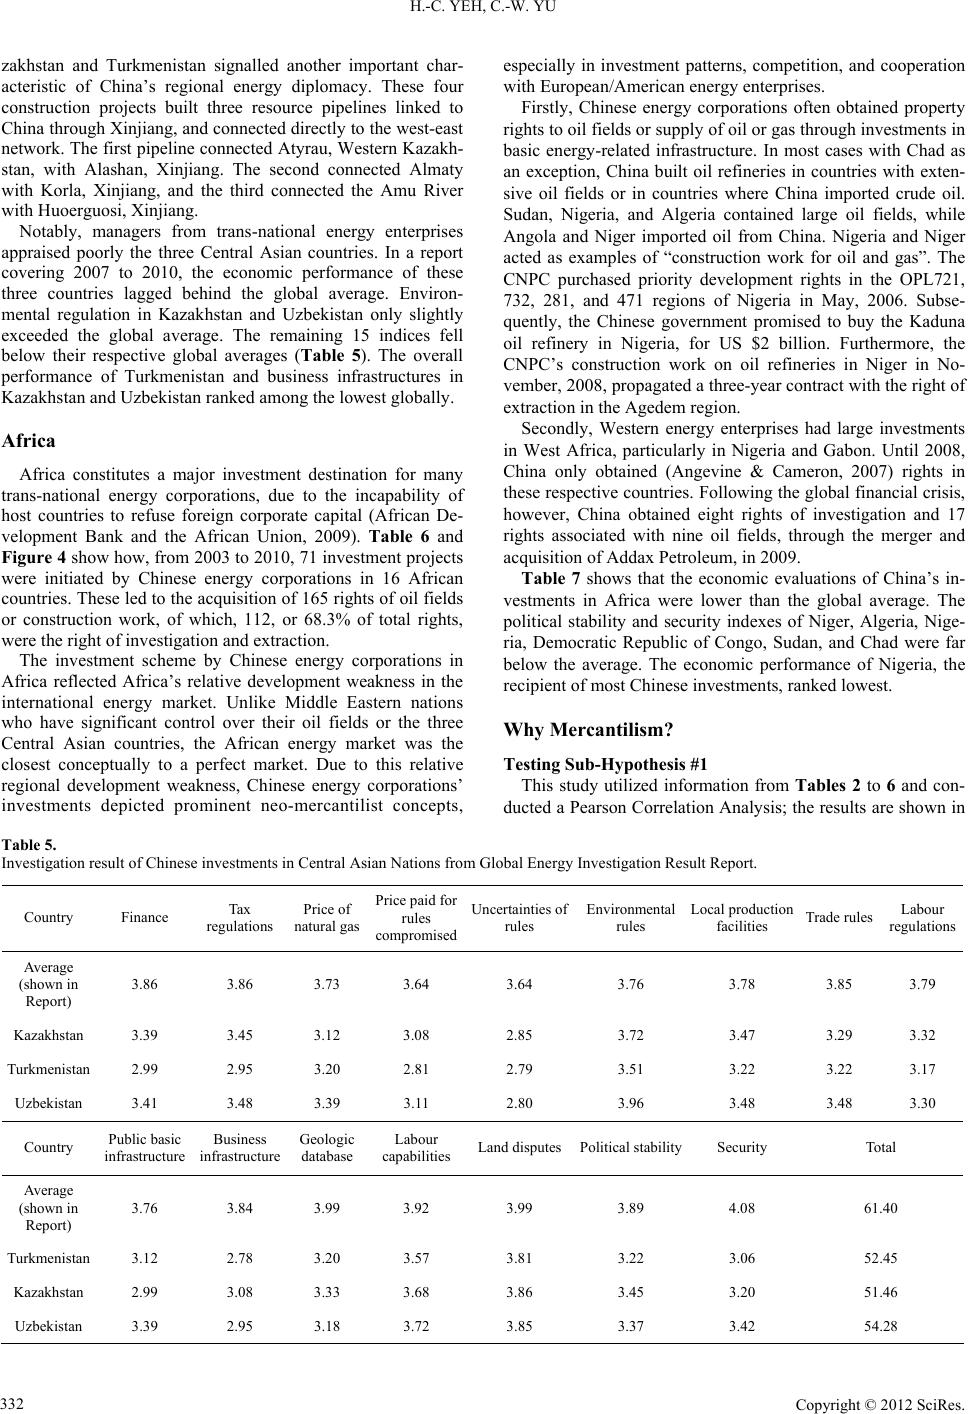 H.-C. YEH, C.-W. YU Copyright © 2012 SciRe s . 332 zakhstan and Turkmenistan signalled another important char- acteristic of China’s regional energy diplomacy. These four construction projects built three resource pipelines linked to China through Xinjiang, and connected directly to the west-east network. The first pipeline connected Atyrau, Western Kazakh- stan, with Alashan, Xinjiang. The second connected Almaty with Korla, Xinjiang, and the third connected the Amu River with Huoerguosi, Xinjiang. Notably, managers from trans-national energy enterprises appraised poorly the three Central Asian countries. In a report covering 2007 to 2010, the economic performance of these three countries lagged behind the global average. Environ- mental regulation in Kazakhstan and Uzbekistan only slightly exceeded the global average. The remaining 15 indices fell below their respective global averages (Table 5). The overall performance of Turkmenistan and business infrastructures in Kazakhstan and Uzbekistan ranke d among th e lowest globally. Africa Africa constitutes a major investment destination for many trans-national energy corporations, due to the incapability of host countries to refuse foreign corporate capital (African De- velopment Bank and the African Union, 2009). Table 6 and Figure 4 show how, from 2003 to 2010, 71 investment projects were initiated by Chinese energy corporations in 16 African countries. These led to the acquisition of 165 rights of oil fields or construction work, of which, 112, or 68.3% of total rights, were the right of investigati on and extraction. The investment scheme by Chinese energy corporations in Africa reflected Africa’s relative development weakness in the international energy market. Unlike Middle Eastern nations who have significant control over their oil fields or the three Central Asian countries, the African energy market was the closest conceptually to a perfect market. Due to this relative regional development weakness, Chinese energy corporations’ investments depicted prominent neo-mercantilist concepts, especially in investment patterns, competition, and cooperation with European/American energy enterprises. Firstly, Chinese energy corporations often obtained property rights to oil fields or supply of oil or gas through investments in basic energy-related infrastructure. In most cases with Chad as an exception, China built oil refineries in countries with exten- sive oil fields or in countries where China imported crude oil. Sudan, Nigeria, and Algeria contained large oil fields, while Angola and Niger imported oil from China. Nigeria and Niger acted as examples of “construction work for oil and gas”. The CNPC purchased priority development rights in the OPL721, 732, 281, and 471 regions of Nigeria in May, 2006. Subse- quently, the Chinese government promised to buy the Kaduna oil refinery in Nigeria, for US $2 billion. Furthermore, the CNPC’s construction work on oil refineries in Niger in No- vember, 2008, propagated a three-year contract with the right of extraction in the Agedem region. Secondly, Western energy enterprises had large investments in West Africa, particularly in Nigeria and Gabon. Until 2008, China only obtained (Angevine & Cameron, 2007) rights in these respective countries. Following the global financial crisis, however, China obtained eight rights of investigation and 17 rights associated with nine oil fields, through the merger and acquisition of Addax Petroleum, in 2009. Table 7 shows that the economic evaluations of China’s in- vestments in Africa were lower than the global average. The political stability and security indexes of Niger, Algeria, Nige- ria, Democratic Republic of Congo, Sudan, and Chad were far below the average. The economic performance of Nigeria, the recipient of most Chinese investments, ranked lowest. Why Mercantilism? Testing Sub-Hypothesis #1 This study utilized information from Tables 2 to 6 and con- ducted a Pearson Correlation Analysis; the results are shown in Table 5. Investigation result of Chi n es e in v es tments in Centra l A sian Nations from Global Energy Investigation Result Report. Country Finance Tax regulations Price of natural gas Price paid fo r rules comp ro mi se d Uncertainties of rules Environmental rules Local production facilities Trade rulesLabour regulations Average (shown in Report) 3.86 3.86 3.73 3.64 3.64 3.76 3.78 3.85 3.79 Kazakhstan 3.39 3.45 3.12 3.08 2.85 3.72 3.47 3.29 3.32 Turkmenistan 2.99 2.95 3.20 2.81 2.79 3.51 3.22 3.22 3.17 Uzbekistan 3.41 3.48 3.39 3.11 2.80 3.96 3.48 3.48 3.30 Country Public basic infrastructure Business infrastructure Geologic database Labour capabilities Land disputesPolitical stabilitySecurity Total Average (shown in Report) 3.76 3.84 3.99 3.92 3.99 3.89 4.08 61.40 Turkmenistan 3.12 2.78 3.20 3.57 3.81 3.22 3.06 52.45 Kazakhstan 2.99 3.08 3.33 3.68 3.86 3.45 3.20 51.46 Uzbekistan 3.39 2.95 3.18 3.72 3.85 3.37 3.42 54.28  H.-C. YEH, C.-W. YU Table 6. Chinese energy enterprises’ investment in Africa between 2003 and 2010. Right of oil fiel d Basic infrastructure Country Right of investigation Right of extraction Property right of oil field Oil/gas supply Refinement of crude oil Store of crude oil T ra nspo rt of crude oil Total Sudan 1 1 5 0 0 0 2 9 Algeria 3 3 2 1 3 1 0 13 Libya 1 0 0 1 0 0 2 4 Nigeria 11 12 4 1 0 0 0 28 Gabon 8 3 6 1 0 0 0 18 Tunisia 14 14 1 0 0 0 0 29 Mauritania 6 4 1 1 0 0 0 12 Morocco 3 0 0 0 0 0 0 3 Kenya 6 0 0 0 0 0 4 10 Angola 4 1 5 0 1 0 0 11 Somalia 1 0 0 0 0 0 0 1 Niger 2 2 0 0 2 0 2 8 Equatoria l Guinea 1 1 0 0 0 0 0 2 Cameroon 2 0 0 0 0 0 0 2 Chad 3 3 3 0 2 0 1 12 Republic of C ongo 2 0 0 0 0 0 0 2 Total 68 44 27 5 8 1 11 164 Figure 4. Chinese energy enterprises’ investment in Africa between 2003 and 2010. Copyright © 2012 SciRe s . 333 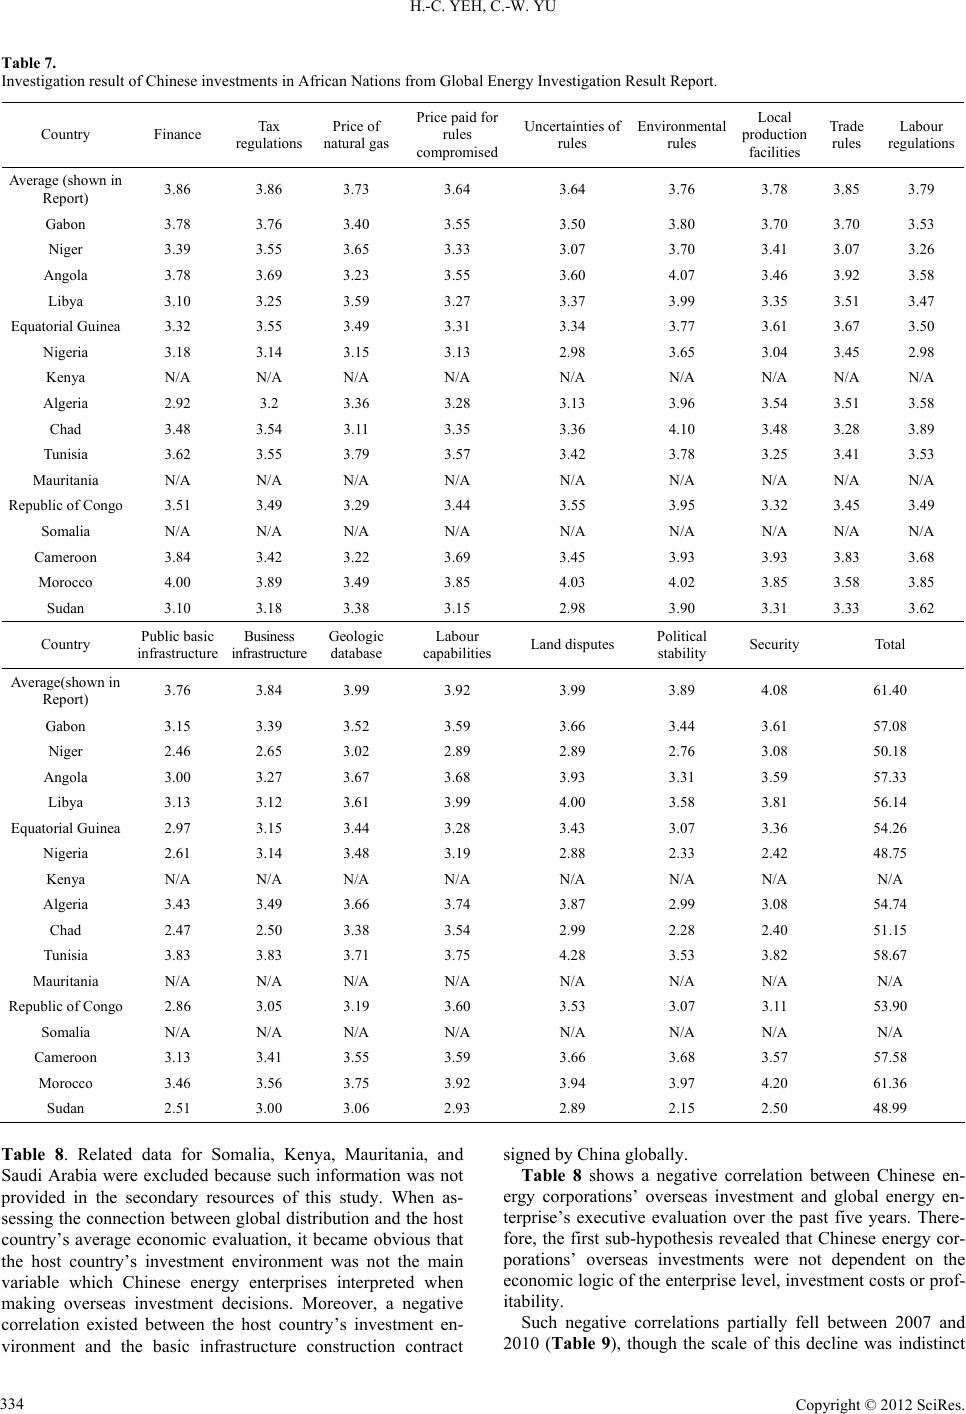 H.-C. YEH, C.-W. YU Copyright © 2012 SciRe s . 334 Table 7. Investigation result of Chinese investments in African Nations from Global Energy Investigation Result Report. Country Finance Tax regulations Price of natural gas Price paid fo r rules compromised Uncertaintie s of rules Environmental rules Local production facilities Trade rules Labour regulations Average (shown in Report) 3.86 3.86 3.73 3.64 3.64 3.76 3.78 3.85 3.79 Gabon 3.78 3.76 3.40 3.55 3.50 3.80 3.70 3.70 3.53 Niger 3.39 3.55 3.65 3.33 3.07 3.70 3.41 3.07 3.26 Angola 3.78 3.69 3.23 3.55 3.60 4.07 3.46 3.92 3.58 Libya 3.10 3.25 3.59 3.27 3.37 3.99 3.35 3.51 3.47 Equatorial Guinea 3.32 3.55 3.49 3.31 3.34 3.77 3.61 3.67 3.50 Nigeria 3.18 3.14 3.15 3.13 2.98 3.65 3.04 3.45 2.98 Kenya N/A N/A N/A N/A N/A N/A N/A N/A N/A Algeria 2.92 3.2 3.36 3.28 3.13 3.96 3.54 3.51 3.58 Chad 3.48 3.54 3.11 3.35 3.36 4.10 3.48 3.28 3.89 Tunisia 3.62 3.55 3.79 3.57 3.42 3.78 3.25 3.41 3.53 Mauritania N/A N/A N/A N/A N/A N/A N/A N/A N/A Republic of Congo 3.51 3.49 3.29 3.44 3.55 3.95 3.32 3.45 3.49 Somalia N/A N/A N/A N/A N/A N/A N/A N/A N/A Cameroon 3.84 3.42 3.22 3.69 3.45 3.93 3.93 3.83 3.68 Morocco 4.00 3.89 3.49 3.85 4.03 4.02 3.85 3.58 3.85 Sudan 3.10 3.18 3.38 3.15 2.98 3.90 3.31 3.33 3.62 Country Public basic infrastructure Business infrastructure Geologic database Labour capabilities Land disputes Political stability Security Total Average(shown in Report) 3.76 3.84 3.99 3.92 3.99 3.89 4.08 61.40 Gabon 3.15 3.39 3.52 3.59 3.66 3.44 3.61 57.08 Niger 2.46 2.65 3.02 2.89 2.89 2.76 3.08 50.18 Angola 3.00 3.27 3.67 3.68 3.93 3.31 3.59 57.33 Libya 3.13 3.12 3.61 3.99 4.00 3.58 3.81 56.14 Equatorial Guinea 2.97 3.15 3.44 3.28 3.43 3.07 3.36 54.26 Nigeria 2.61 3.14 3.48 3.19 2.88 2.33 2.42 48.75 Kenya N/A N/A N/A N/A N/A N/A N/A N/A Algeria 3.43 3.49 3.66 3.74 3.87 2.99 3.08 54.74 Chad 2.47 2.50 3.38 3.54 2.99 2.28 2.40 51.15 Tunisia 3.83 3.83 3.71 3.75 4.28 3.53 3.82 58.67 Mauritania N/A N/A N/A N/A N/A N/A N/A N/A Republic of Congo 2.86 3.05 3.19 3.60 3.53 3.07 3.11 53.90 Somalia N/A N/A N/A N/A N/A N/A N/A N/A Cameroon 3.13 3.41 3.55 3.59 3.66 3.68 3.57 57.58 Morocco 3.46 3.56 3.75 3.92 3.94 3.97 4.20 61.36 Sudan 2.51 3.00 3.06 2.93 2.89 2.15 2.50 48.99 Table 8. Related data for Somalia, Kenya, Mauritania, and Saudi Arabia were excluded because such information was not provided in the secondary resources of this study. When as- sessing the connection between global distribution and the host country’s average economic evaluation, it became obvious that the host country’s investment environment was not the main variable which Chinese energy enterprises interpreted when making overseas investment decisions. Moreover, a negative correlation existed between the host country’s investment en- vironment and the basic infrastructure construction contract signed by China globally. Table 8 shows a negative correlation between Chinese en- ergy corporations’ overseas investment and global energy en- terprise’s executive evaluation over the past five years. There- fore, the first sub-hypothesis revealed that Chinese energy cor- porations’ overseas investments were not dependent on the economic logic of the enterprise level, investment costs or prof- itability. Such negative correlations partially fell between 2007 and 2010 (Table 9), though the scale of this decline was indistinct 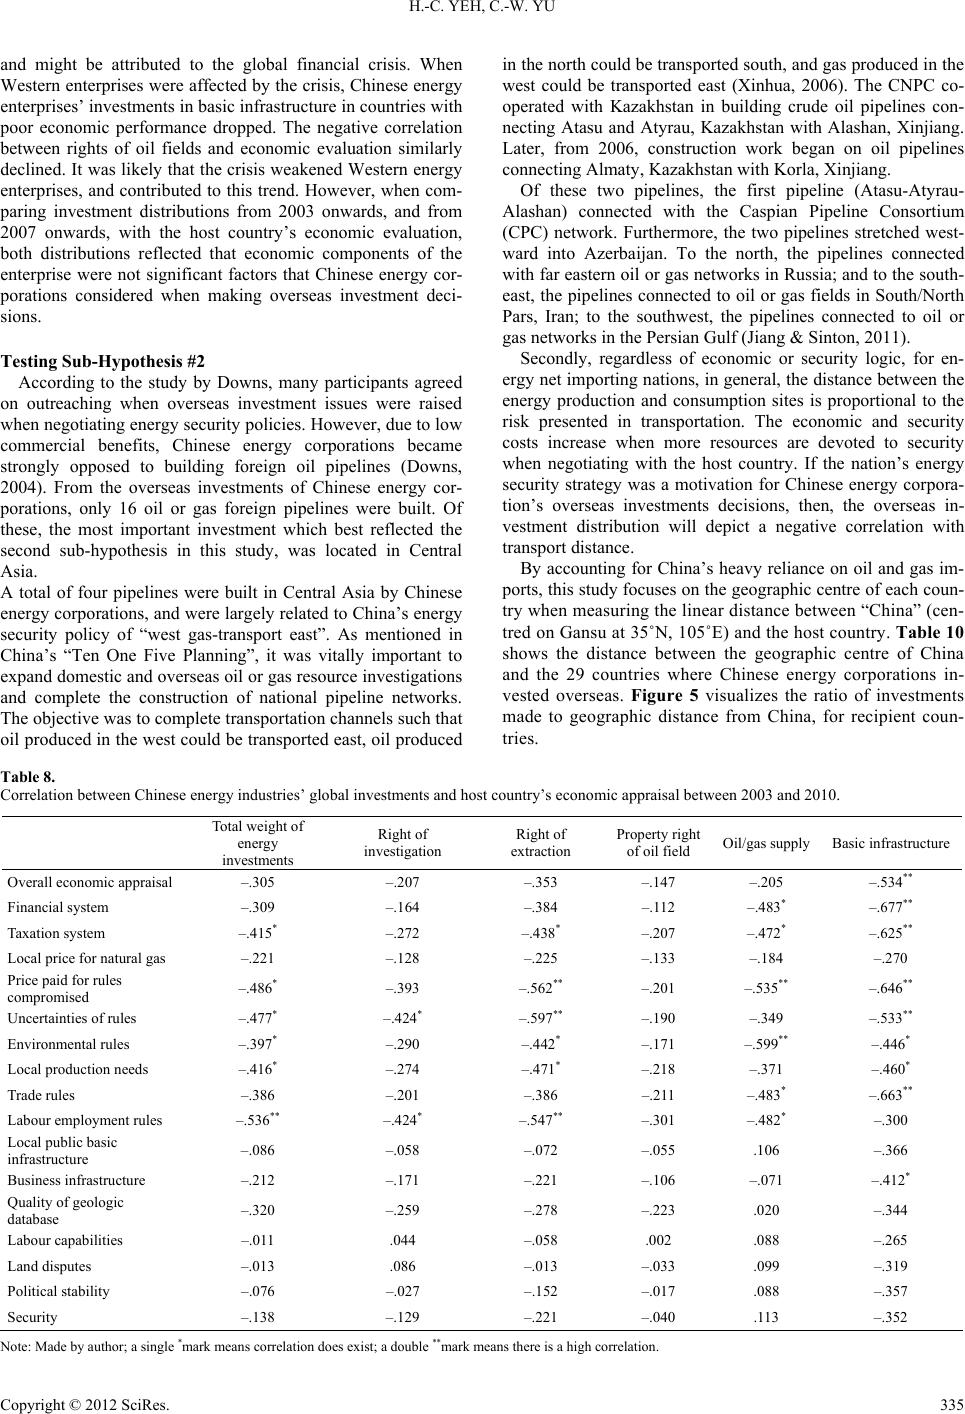 H.-C. YEH, C.-W. YU and might be attributed to the global financial crisis. When Western enterprises were affected by the crisis, Chinese energy enterprises’ investments in basic infrastructure in countries with poor economic performance dropped. The negative correlation between rights of oil fields and economic evaluation similarly declined. It was likely that the crisis weakened Western energy enterprises, and contributed to this trend. However, when com- paring investment distributions from 2003 onwards, and from 2007 onwards, with the host country’s economic evaluation, both distributions reflected that economic components of the enterprise were not significant factors that Chinese energy cor- porations considered when making overseas investment deci- sions. Testing Sub-Hypothesis #2 According to the study by Downs, many participants agreed on outreaching when overseas investment issues were raised when negotiating energy security policies. However, due to low commercial benefits, Chinese energy corporations became strongly opposed to building foreign oil pipelines (Downs, 2004). From the overseas investments of Chinese energy cor- porations, only 16 oil or gas foreign pipelines were built. Of these, the most important investment which best reflected the second sub-hypothesis in this study, was located in Central Asia. A total of four pipelines were built in Central Asia by Chinese energy corporations, and were largely related to China’s energy security policy of “west gas-transport east”. As mentioned in China’s “Ten One Five Planning”, it was vitally important to expand domestic and overseas oil or gas resource investigations and complete the construction of national pipeline networks. The objective was to complete transportation channels such that oil produced in the west could be transported east, oil produced in the north could be transported south, and gas produced in the west could be transported east (Xinhua, 2006). The CNPC co- operated with Kazakhstan in building crude oil pipelines con- necting Atasu and Atyrau, Kazakhstan with Alashan, Xinjiang. Later, from 2006, construction work began on oil pipelines connecting Almaty, Kazakhstan with Korla, Xinjiang. Of these two pipelines, the first pipeline (Atasu-Atyrau- Alashan) connected with the Caspian Pipeline Consortium (CPC) network. Furthermore, the two pipelines stretched west- ward into Azerbaijan. To the north, the pipelines connected with far eastern oil or gas networks in Russia; and to the south- east, the pipelines connected to oil or gas fields in South/North Pars, Iran; to the southwest, the pipelines connected to oil or gas networks in the Persian Gulf (Jiang & Sinton, 2011). Secondly, regardless of economic or security logic, for en- ergy net importing nations, in general, the distance between the energy production and consumption sites is proportional to the risk presented in transportation. The economic and security costs increase when more resources are devoted to security when negotiating with the host country. If the nation’s energy security strategy was a motivation for Chinese energy corpora- tion’s overseas investments decisions, then, the overseas in- vestment distribution will depict a negative correlation with transport distance. By accounting for China’s heavy reliance on oil and gas im- ports, this study focuses on the geographic centre of each coun- try when measuring the linear distance between “China” (cen- tred on Gansu at 35˚N, 105˚E) and the host country. Table 10 shows the distance between the geographic centre of China and the 29 countries where Chinese energy corporations in- vested overseas. Figure 5 visualizes the ratio of investments made to geographic distance from China, for recipient coun- tries. Table 8. Correlation between Ch i n ese energy industries ’ global investments and host country’s economic apprai sal between 2003 and 2010. Total weight of energy investments Right of investigation Right of extraction Property right of oil field Oil/gas supply Basic infrastruc t u r e Overall economic appraisal –.305 –.207 –.353 –.147 –.205 –.534 ** Financial sy st em –.309 –.164 –.384 –.112 –.483* –.677** Taxation system –.415* –.272 –.438* –.207 –.472* –.625** Local price for natura l gas –.22 1 –.128 –.225 –.133 –.184 –.270 Price paid for rules compromised –.486* –.393 –.562** –.201 –.535** –.646** Uncertainties of rules –.477* –.424* –.597** –.190 –.349 –.533** Environme ntal rules –.397* –.290 –.442* –.171 –.599** –.446* Local prod u ction needs –.416* –.274 –.471* –.218 –.371 –.460* Trade rules –.386 –.201 –.386 –.211 –.483* –.663** Labour employment rules –.536** –.424* –.547** –.301 –.482* –.300 Local public basic infrastructure –.086 –.058 –.072 –.055 .106 –.366 Business infra str uc t ure –.212 –.171 –.22 1 –.106 –.071 –.412* Quality of geologic database –.320 –.259 –.278 –.223 .020 –.344 Labour ca pabilities –.011 .044 –.058 .002 .088 –.265 Land dispute s –.013 .086 –.013 –.033 .099 –.319 Political stability –. 076 –.027 – .152 –.017 .088 –.357 Security –.138 –.129 –.221 –.040 .113 –.352 Note: Made by author; a single *mark means correlation does exist; a double ** mark means there is a high correlation. Copyright © 2012 SciRe s . 335 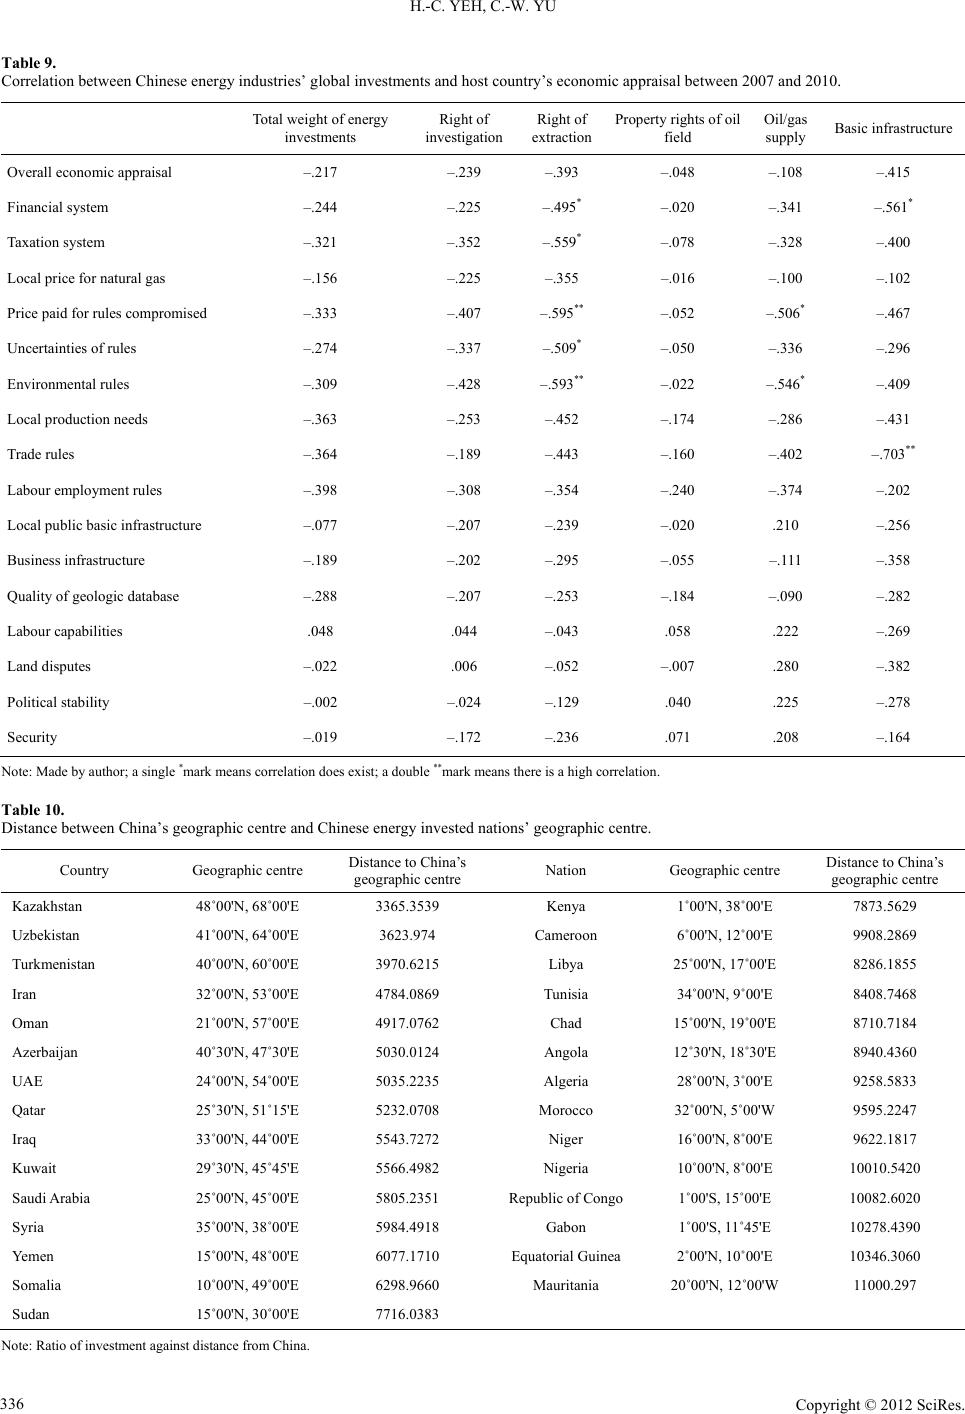 H.-C. YEH, C.-W. YU Table 9. Correlation between C h i n e s e energy industries’ global investments and host country ’s economic appraisal between 2007 and 2010. Total weight of energy investments Right of investigation Right of extraction Property rights of oil field Oil/gas supply Basic infrastructure Overall economic appraisal –.217 –.239 –.393 –.048 –.108 –.415 Financial system –.244 –.225 –.495* –.020 –.341 –.561* Taxation system –.321 –.352 –.559* –.078 –.328 –.400 Local price for natura l gas –.156 –.225 –.355 –.016 –.100 –.102 Price paid for rules compromised –.333 –.407 –.595** –.052 –.506* –.467 Uncertainties of rules –.274 –.337 –.509* –.050 –.336 –.296 Environmental rules –.309 –.428 –.593** –.022 –.546* –.409 Local production needs –.363 –.253 –.452 –.174 –.286 –.431 Trade rules –.364 –.189 –.443 –.160 –.402 –.703** Labour employment rule s –.398 –.308 –.354 –.240 –.374 –.202 Local public basic infrastructure –.077 –.207 –.239 –.0 20 .210 –.256 Business infra str uc t ure –.189 –.202 –.295 –.05 5 –.111 –.358 Quality of geologic database –.288 –.207 –.253 –.184 –.090 –.282 Labour ca pabilities .048 .044 –.043 .058 .222 –.269 Land disputes –.022 .006 –.052 –.007 .280 –.382 Political stability –.002 –.024 –.129 .040 .225 –.278 Security –.019 –.172 –.236 .071 .208 –.164 Note: Made by author; a single *mark means correlation does exist; a double ** mark means there is a high correlation. Table 10. Distance between China’s geographic centre and Chinese energy invested nations’ geographic centre. Country Geographic centre Distance to China’ s geographic centre Nation Geographic centre Distance to China’s geographic centre Kazakhstan 48˚00'N, 68˚00'E 3365.3539 Kenya 1˚00'N, 38˚00'E 7873.5629 Uzbekistan 41˚00'N, 64˚00'E 3623.974 Cameroon 6˚00'N, 12˚00'E 9908.2869 Turkmenistan 40˚00'N, 60˚00'E 3970.6215 Libya 25˚00'N, 17˚00'E 8286.1855 Iran 32˚00'N, 53˚00'E 4784.0869 Tunisia 34˚00'N, 9˚00'E 8408.7468 Oman 21˚00'N, 57˚00'E 4917.0762 Chad 15˚00'N, 19˚00'E 8710.7184 Azerbaijan 40˚30'N, 47˚30'E 5030.0124 Angola 12˚30'N, 18˚30'E 8940.4360 UAE 24˚00'N, 54˚00'E 5035.2235 Algeria 28˚00'N, 3˚00'E 9258.5833 Qatar 25˚30'N, 51˚15'E 5232.0708 Morocco 32˚00'N, 5˚00'W 9595.2247 Iraq 33˚00'N, 44˚00'E 5543.7272 Niger 16˚00'N, 8˚00'E 9622.1817 Kuwait 29˚30'N, 45˚45'E 5566.4982 Nigeria 10˚00'N, 8˚00'E 10010.5420 Saudi Arabia 2 5˚00'N, 45˚00'E 5805.2351 Republic of C ongo 1˚00'S, 15˚00'E 10082.6020 Syria 35˚00'N, 38˚00'E 5984.4918 Gabon 1˚00'S, 11˚45'E 10278.4390 Yemen 15˚00'N, 48˚00'E 6077.1710 Equatorial Guinea 2˚00'N, 10˚00'E 10346.3060 Somalia 10˚00'N, 49˚00'E 6298.9660 Mauritania 20˚00'N , 12˚00'W 11000.297 Sudan 15˚00'N, 30˚00'E 7716.0383 Note: Ratio of investment ag ainst distance from China. Copyright © 2012 SciRe s . 336 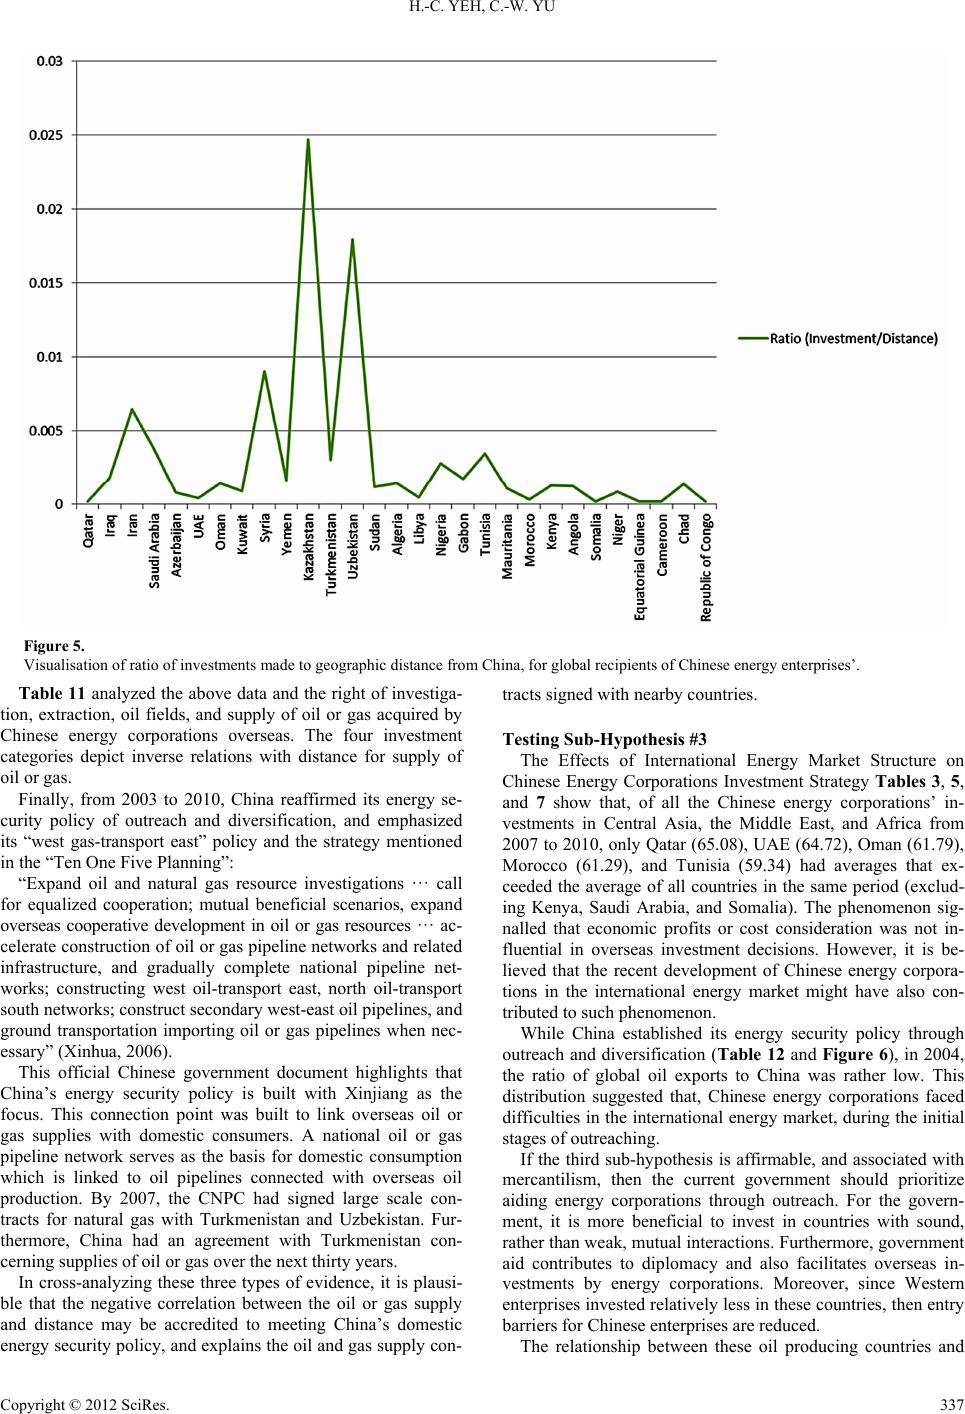 H.-C. YEH, C.-W. YU Copyright © 2012 SciRe s . 337 Figure 5. Visualisation of ratio of inv e s t ments made to geographic distance from China, for global recipients o f Chinese energy enterprises’. Table 11 analyzed the above data and the right of investiga- tion, extraction, oil fields, and supply of oil or gas acquired by Chinese energy corporations overseas. The four investment categories depict inverse relations with distance for supply of oil or gas. Finally, from 2003 to 2010, China reaffirmed its energy se- curity policy of outreach and diversification, and emphasized its “west gas-transport east” policy and the strategy mentioned in the “Ten One Five Planning”: “Expand oil and natural gas resource investigations ··· call for equalized cooperation; mutual beneficial scenarios, expand overseas cooperative development in oil or gas resources ··· ac- celerate construction of oil or gas pipeline networks and related infrastructure, and gradually complete national pipeline net- works; constructing west oil-transport east, north oil-transport south networks; construct secondary west-east oil pipelines, and ground transportation importing oil or gas pipelines when nec- essary” (Xinhua, 2006). This official Chinese government document highlights that China’s energy security policy is built with Xinjiang as the focus. This connection point was built to link overseas oil or gas supplies with domestic consumers. A national oil or gas pipeline network serves as the basis for domestic consumption which is linked to oil pipelines connected with overseas oil production. By 2007, the CNPC had signed large scale con- tracts for natural gas with Turkmenistan and Uzbekistan. Fur- thermore, China had an agreement with Turkmenistan con- cerning supplies of oil or gas over the next thirty years. In cross-analyzing these three types of evidence, it is plausi- ble that the negative correlation between the oil or gas supply and distance may be accredited to meeting China’s domestic energy security policy, and explains the oil and gas supply con- tracts signed with nearby countries. Testing Sub-Hypothesis #3 The Effects of International Energy Market Structure on Chinese Energy Corporations Investment Strategy Tables 3, 5, and 7 show that, of all the Chinese energy corporations’ in- vestments in Central Asia, the Middle East, and Africa from 2007 to 2010, only Qatar (65.08), UAE (64.72), Oman (61.79), Morocco (61.29), and Tunisia (59.34) had averages that ex- ceeded the average of all countries in the same period (exclud- ing Kenya, Saudi Arabia, and Somalia). The phenomenon sig- nalled that economic profits or cost consideration was not in- fluential in overseas investment decisions. However, it is be- lieved that the recent development of Chinese energy corpora- tions in the international energy market might have also con- tributed to such phenomenon. While China established its energy security policy through outreach and diversification (Table 12 and Figure 6), in 2004, the ratio of global oil exports to China was rather low. This distribution suggested that, Chinese energy corporations faced difficulties in the international energy market, during the initial stages of outreaching. If the third sub-hypothesis is affirmable, and associated with mercantilism, then the current government should prioritize aiding energy corporations through outreach. For the govern- ment, it is more beneficial to invest in countries with sound, rather than weak, mutual interactions. Furthermore, government aid contributes to diplomacy and also facilitates overseas in- vestments by energy corporations. Moreover, since Western enterprises invested relatively less in these countries, then entry barriers for Chinese enterprises are reduced. The relationship between these oil producing countries and 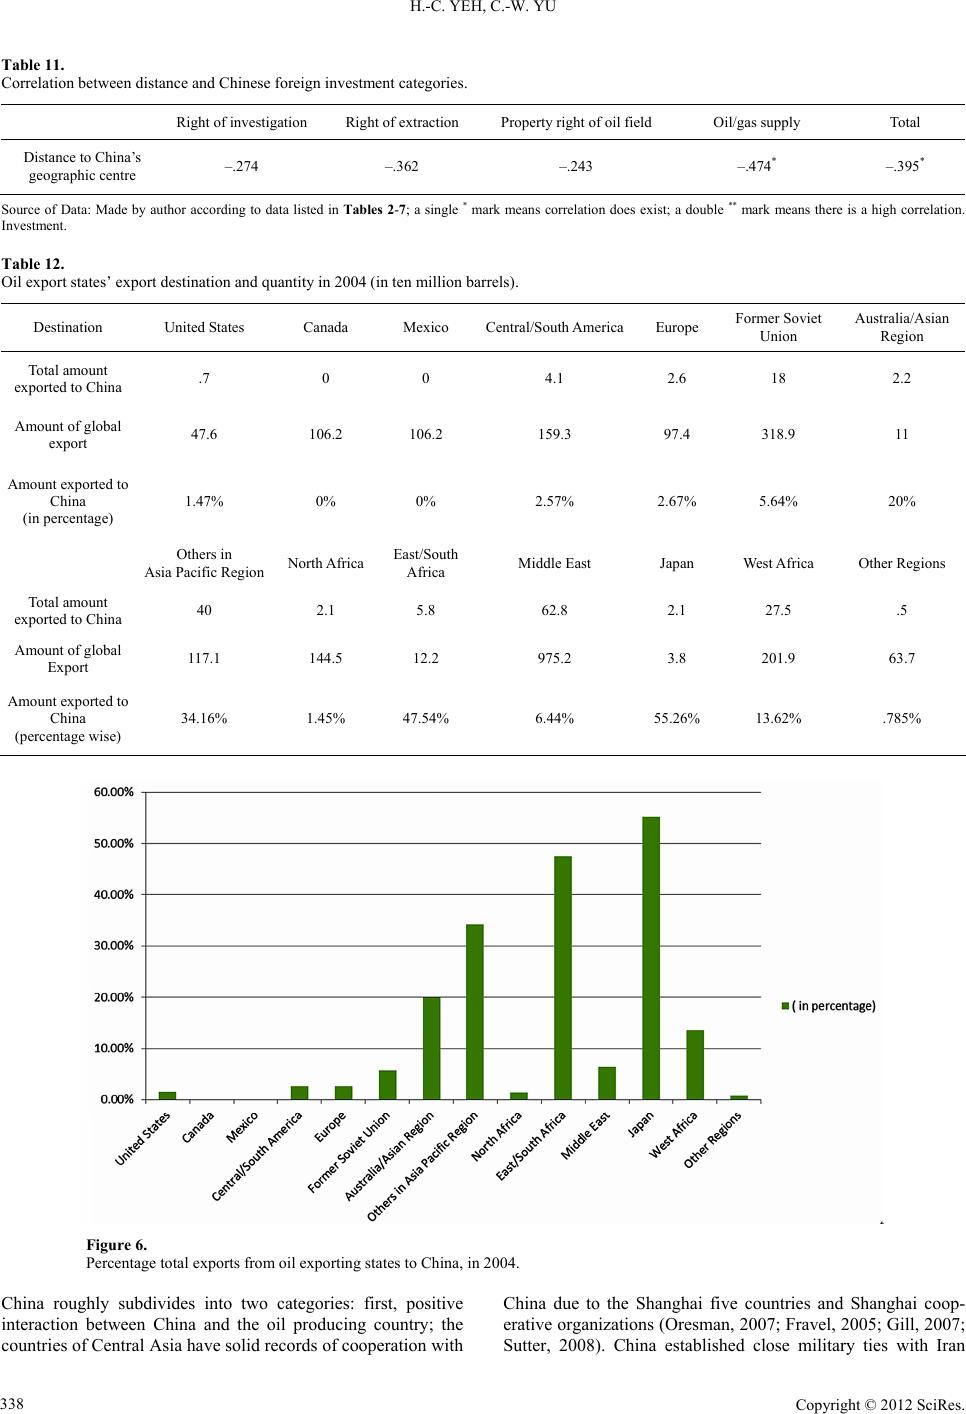 H.-C. YEH, C.-W. YU Table 11. Correlation between distance and Chinese foreign investment categories. Right of investigation Right of extraction Property right of oil field Oil/gas supply Total Distance to China’ s geographic centre –.274 –.362 –.243 –.474* –.395* Source of Data: Made by author acco rding to data listed in Tables 2-7; a single * mark means correlation does ex ist; a double ** mark means there is a high correlation. Investment. Table 12. Oil export states’ export destination and quantity in 2004 (in ten million barrels). Destination United States Canada Mexico Central/South AmericaEurope Former Soviet Union Australia/Asian Region Total amount exported to China .7 0 0 4.1 2.6 18 2.2 Amount of gl o bal export 47.6 106.2 106.2 159.3 97.4 318.9 11 Amount exported to China (in percentage) 1.47% 0% 0% 2.57% 2.67% 5.64% 20% Others in Asia Pacific Region North Africa East/South Africa Middle East Japan West Africa Other Re gions Total amount exported to China 40 2.1 5.8 62.8 2.1 27.5 .5 Amount of gl o bal Export 117.1 144.5 12.2 975.2 3.8 201.9 63.7 Amount exported to China (percentage wise) 34.16% 1.45% 47.54% 6.44% 55.26% 13.62% .785% Figure 6. Percentage total exports from oil exporting states to China, in 2004. China roughly subdivides into two categories: first, positive interaction between China and the oil producing country; the countries of Central Asia have solid records of cooperation with China due to the Shanghai five countries and Shanghai coop- erative organizations (Oresman, 2007; Fravel, 2005; Gill, 2007; Sutter, 2008). China established close military ties with Iran Copyright © 2012 SciRe s . 338 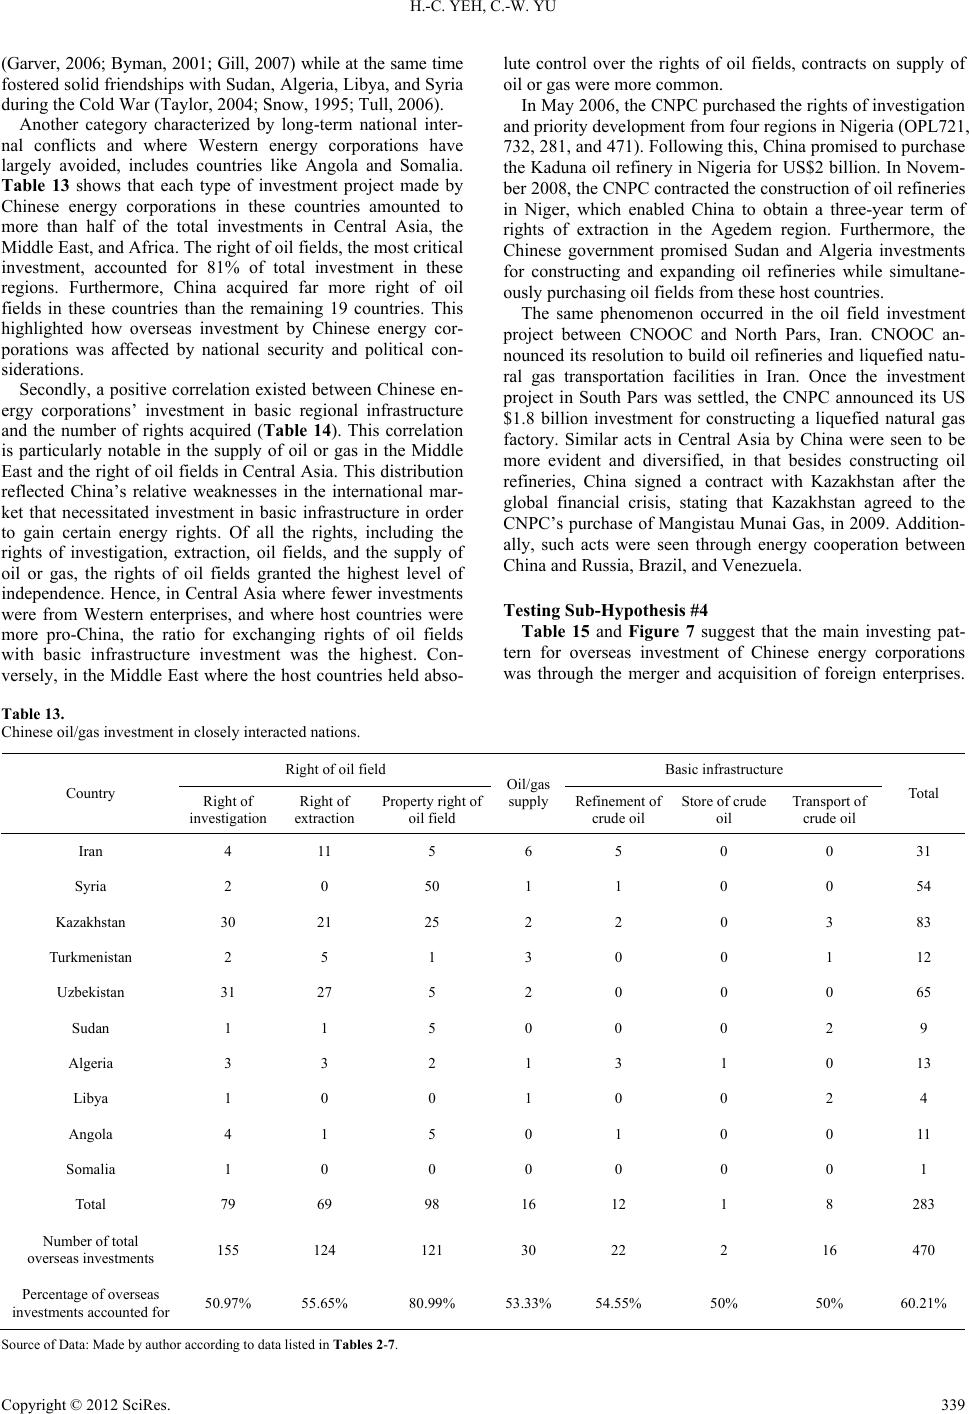 H.-C. YEH, C.-W. YU (Garver, 2006; By man, 2001; Gill, 2007) while at the same time fostered solid friendships with Sudan, Algeria, Libya, and Syria during the Cold War (Taylor, 2004; Snow, 1995; Tull, 2006). Another category characterized by long-term national inter- nal conflicts and where Western energy corporations have largely avoided, includes countries like Angola and Somalia. Table 13 shows that each type of investment project made by Chinese energy corporations in these countries amounted to more than half of the total investments in Central Asia, the Middle East, and Africa. The right of oil fields, the most critical investment, accounted for 81% of total investment in these regions. Furthermore, China acquired far more right of oil fields in these countries than the remaining 19 countries. This highlighted how overseas investment by Chinese energy cor- porations was affected by national security and political con- siderations. Secondly, a positive correlation existed between Chinese en- ergy corporations’ investment in basic regional infrastructure and the number of rights acquired (Table 14). This correlation is particularly notable in the supply of oil or gas in the Middle East and the right of oil fields in Central Asia. This distribution reflected China’s relative weaknesses in the international mar- ket that necessitated investment in basic infrastructure in order to gain certain energy rights. Of all the rights, including the rights of investigation, extraction, oil fields, and the supply of oil or gas, the rights of oil fields granted the highest level of independence. Hence, in Central Asia where fewer investments were from Western enterprises, and where host countries were more pro-China, the ratio for exchanging rights of oil fields with basic infrastructure investment was the highest. Con- versely, in the Middle East where the host countries held abso- lute control over the rights of oil fields, contracts on supply of oil or gas were more common. In May 2006, the CNPC purchased the rights of investigation and priority development from four regions in Nigeria (OPL721, 732, 281, and 471). Following this, China promised to purchase the Kaduna oil refinery in Nigeria for US$2 billion. In Novem- ber 2008, the CNPC contracted the construction of oil refineries in Niger, which enabled China to obtain a three-year term of rights of extraction in the Agedem region. Furthermore, the Chinese government promised Sudan and Algeria investments for constructing and expanding oil refineries while simultane- ously purchasing oil fields from these host countries. The same phenomenon occurred in the oil field investment project between CNOOC and North Pars, Iran. CNOOC an- nounced its resolution to build oil refineries and liquefied natu- ral gas transportation facilities in Iran. Once the investment project in South Pars was settled, the CNPC announced its US $1.8 billion investment for constructing a liquefied natural gas factory. Similar acts in Central Asia by China were seen to be more evident and diversified, in that besides constructing oil refineries, China signed a contract with Kazakhstan after the global financial crisis, stating that Kazakhstan agreed to the CNPC’s purchase of Mangistau Munai Gas, in 2009. Addition- ally, such acts were seen through energy cooperation between China and Russia, Brazil, and Venezuela. Testing Sub-Hypothesis #4 Table 15 and Figure 7 suggest that the main investing pat- tern for overseas investment of Chinese energy corporations was through the merger and acquisition of foreign enterprises. Table 13. Chinese oil/gas investment in closely interacted nations. Right of oil fiel d Basic infrastructure Country Right of investigation Right o f extraction Property right of oil field Oil/gas supply Refinement of crude oil Store of crude oil T ra nspo rt of crude oil Total Iran 4 11 5 6 5 0 0 31 Syria 2 0 50 1 1 0 0 54 Kazakhstan 30 21 25 2 2 0 3 83 Turkmenistan 2 5 1 3 0 0 1 12 Uzbekistan 31 27 5 2 0 0 0 65 Sudan 1 1 5 0 0 0 2 9 Algeria 3 3 2 1 3 1 0 13 Libya 1 0 0 1 0 0 2 4 Angola 4 1 5 0 1 0 0 11 Somalia 1 0 0 0 0 0 0 1 Total 79 69 98 16 12 1 8 283 Number of total overseas investments 155 124 121 30 22 2 16 470 Percentage of overseas investmen ts accounted for 50.97% 55.65% 80.99% 53.33%54.55% 50% 50% 60.21% Source of Data: Made by author according to data listed in Tables 2-7. Copyright © 2012 SciRe s . 339 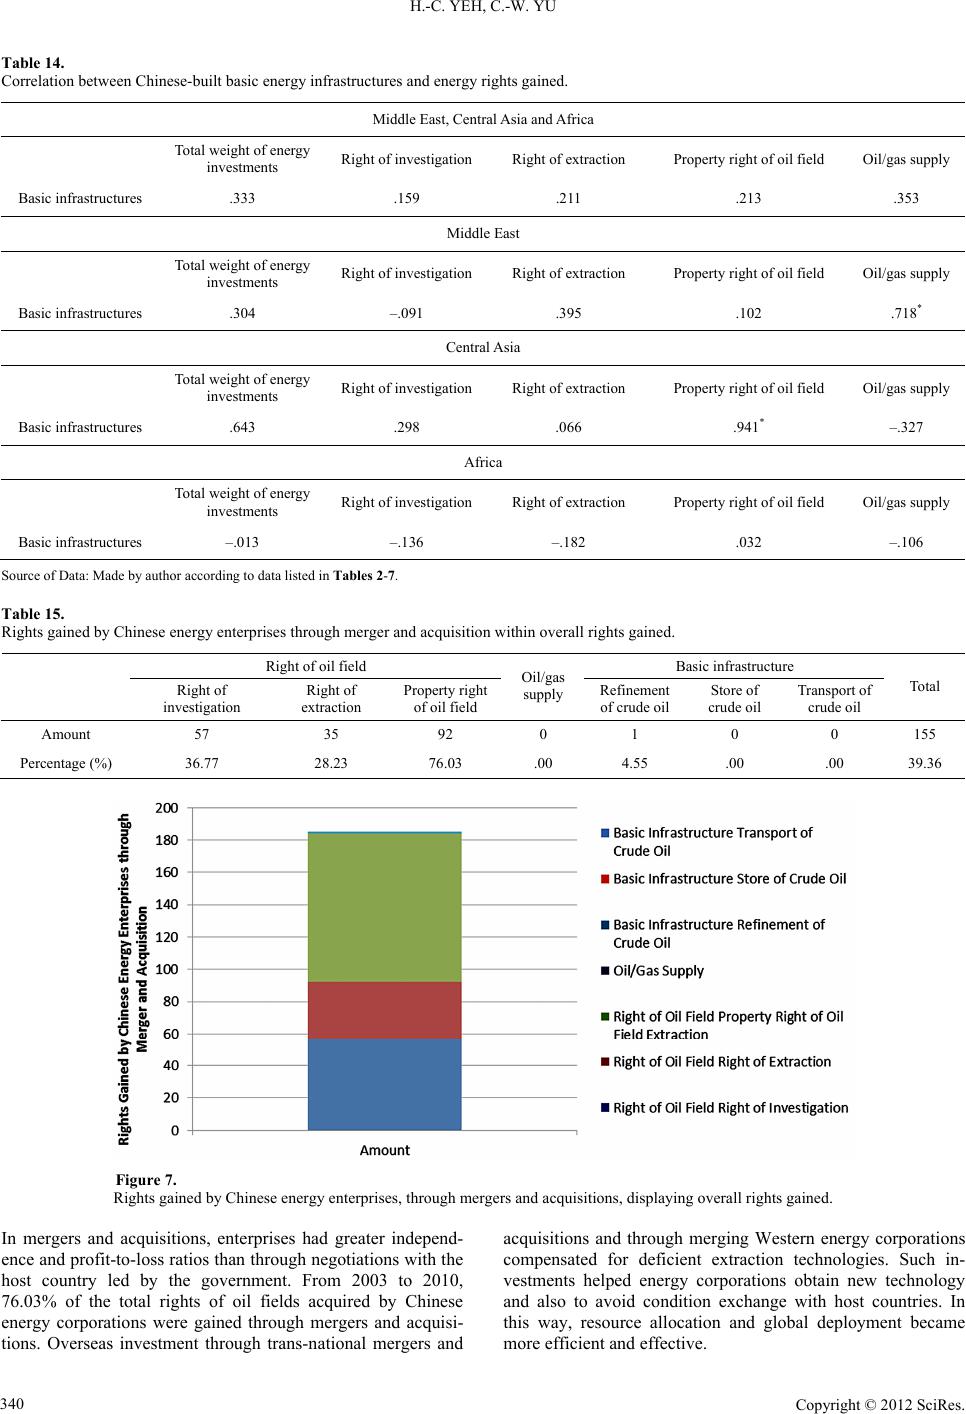 H.-C. YEH, C.-W. YU Table 14. Correlation between Chinese-built basic energy infrastructures and energy rights gained. Middle East, Central Asia and Africa Total weight of energy investments Right of investigation Right of extraction Property right of oil field Oil/gas supply Basic infrast ructures .333 .159 .211 .213 .353 Middle East Total weight of energy investments Right of investigation Right of extraction Property right of oil field Oil/gas supply Basic infrast ructures .304 –.091 .395 .102 .718* Central Asia Total weight of energy investments Right of investigation Right of extraction Property right of oil field Oil/gas supply Basic infra st ructures .643 .298 .066 .941* –.327 Africa Total weight of energy investments Right of investigation Right of extraction Property right of oil field Oil/gas supply Basic infra s tructures –.013 –.136 –.182 .032 –.106 Source of Data: Made by author according to data listed in Tables 2-7. Table 15. Rights gained by Chinese energy enterprises through merger and acqui s ition within overall rights gained. Right of oil fiel d Basic infrastructure Right of investigation Right of extraction Property right of oil field Oil/gas supply Refinement of crude oilStore of crude oil T ransp ort of crude oil Total Amount 57 35 92 0 1 0 0 155 Percentage (%) 36.7 7 28.23 76.03 .00 4.55 .00 .00 39.36 Figure 7. Rights gained by Chinese energy enterprises, throug h mergers and acquisitions, displaying overall rights gained. In mergers and acquisitions, enterprises had greater independ- ence and profit-to-loss ratios than through negotiations with the host country led by the government. From 2003 to 2010, 76.03% of the total rights of oil fields acquired by Chinese energy corporations were gained through mergers and acquisi- tions. Overseas investment through trans-national mergers and acquisitions and through merging Western energy corporations compensated for deficient extraction technologies. Such in- vestments helped energy corporations obtain new technology and also to avoid condition exchange with host countries. In this way, resource allocation and global deployment became more efficient and effective. Copyright © 2012 SciRe s . 340 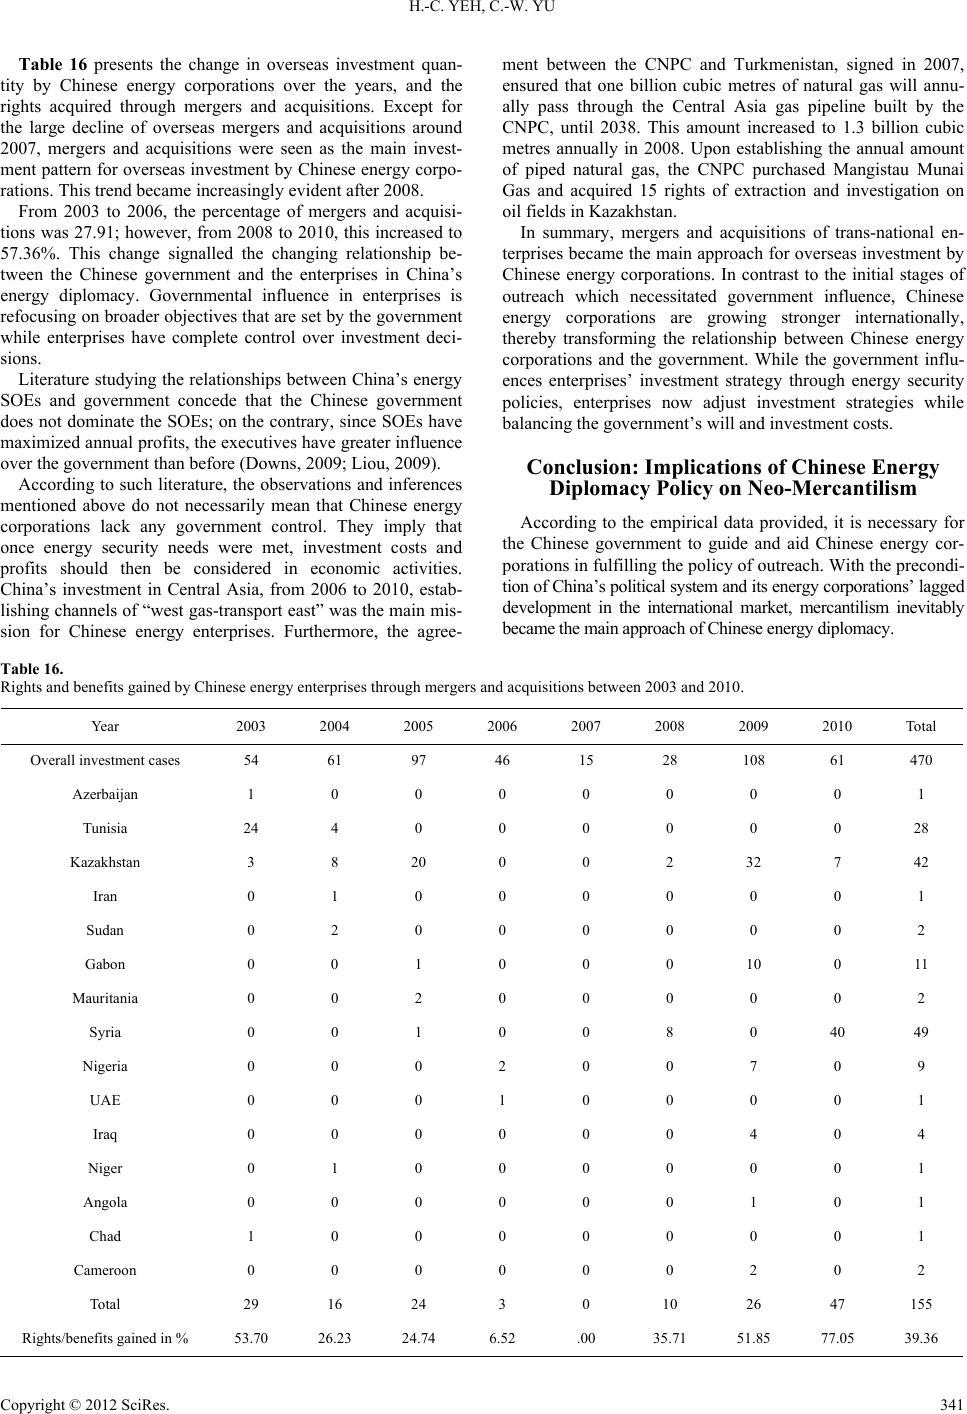 H.-C. YEH, C.-W. YU Table 16 presents the change in overseas investment quan- tity by Chinese energy corporations over the years, and the rights acquired through mergers and acquisitions. Except for the large decline of overseas mergers and acquisitions around 2007, mergers and acquisitions were seen as the main invest- ment pattern for overseas investment by Chinese energy corpo- rations. This trend became increasingly evident after 2008. From 2003 to 2006, the percentage of mergers and acquisi- tions was 27.91; however, from 2008 to 2010, this increased to 57.36%. This change signalled the changing relationship be- tween the Chinese government and the enterprises in China’s energy diplomacy. Governmental influence in enterprises is refocusing on broader objectives that are set by the government while enterprises have complete control over investment deci- sions. Literature studying the relationships between China’s energy SOEs and government concede that the Chinese government does not dominate the SOEs; on the contrary, since SOEs have maximized annual profits, the executives have greater influence over the government than before (Downs, 2009; Liou, 2009). According to such literature, the observations and inferences mentioned above do not necessarily mean that Chinese energy corporations lack any government control. They imply that once energy security needs were met, investment costs and profits should then be considered in economic activities. China’s investment in Central Asia, from 2006 to 2010, estab- lishing channels of “west gas-transport east” was the main mis- sion for Chinese energy enterprises. Furthermore, the agree- ment between the CNPC and Turkmenistan, signed in 2007, ensured that one billion cubic metres of natural gas will annu- ally pass through the Central Asia gas pipeline built by the CNPC, until 2038. This amount increased to 1.3 billion cubic metres annually in 2008. Upon establishing the annual amount of piped natural gas, the CNPC purchased Mangistau Munai Gas and acquired 15 rights of extraction and investigation on oil fields in Kazakhstan. In summary, mergers and acquisitions of trans-national en- terprises became the main approach for overseas investment by Chinese energy corporations. In contrast to the initial stages of outreach which necessitated government influence, Chinese energy corporations are growing stronger internationally, thereby transforming the relationship between Chinese energy corporations and the government. While the government influ- ences enterprises’ investment strategy through energy security policies, enterprises now adjust investment strategies while balancing the government’s will and investment costs. Conclusion: Implications of Chinese Energy Diplomacy Policy on Neo-Mercantilism According to the empirical data provided, it is necessary for the Chinese government to guide and aid Chinese energy cor- porations in fulfilling the policy of outreach. With the precondi- tion of C hi na ’ s poli tic a l sy st e m and its energy corporations’ lagged development in the international market, mercantilism inevitably became the main approach of Chinese energy diplomacy. Table 16. Rights and benefits gained by Chinese energy enterprises through mergers and acquisitions b etween 2003 and 2010. Year 2003 2004 2005 2006 2007 2008 2009 2010 Total Overall investment cases 54 61 97 46 15 28 108 61 470 Azerbaijan 1 0 0 0 0 0 0 0 1 Tunisia 24 4 0 0 0 0 0 0 28 Kazakhstan 3 8 20 0 0 2 32 7 42 Iran 0 1 0 0 0 0 0 0 1 Sudan 0 2 0 0 0 0 0 0 2 Gabon 0 0 1 0 0 0 10 0 11 Mauritania 0 0 2 0 0 0 0 0 2 Syria 0 0 1 0 0 8 0 40 49 Nigeria 0 0 0 2 0 0 7 0 9 UAE 0 0 0 1 0 0 0 0 1 Iraq 0 0 0 0 0 0 4 0 4 Niger 0 1 0 0 0 0 0 0 1 Angola 0 0 0 0 0 0 1 0 1 Chad 1 0 0 0 0 0 0 0 1 Cameroon 0 0 0 0 0 0 2 0 2 Total 29 16 24 3 0 10 26 47 155 Rights/benefits gain ed in % 53.70 26.23 24.74 6.52 .00 35.71 51.85 77.05 39.36 Copyright © 2012 SciRe s . 341  H.-C. YEH, C.-W. YU However, the government and enterprises view overseas en- ergy investments differently. The government places greater concern on whether such investment decisions fulfil energy security policies, whereas, enterprises focus on profitability. With Chinese energy corporations’ increasing international development and the recovery of Western enterprises following the global financial crisis, the investment strategies of Chinese energy corporations are transforming. Though these strategies for overseas investment are still based on governmental energy security policies, Chinese energy corporations are capable of pioneering numerous key factors and hence achieving effi- ciency. One key adjustment is to gradually decrease negotia- tions between the host and Chinese government. Instead, Chi- nese energy corporations are expanding overseas investment through mergers and acquisitions. In implementing such energy security policies, upon meeting partial demands outlined in the policy, Chinese energy corpora- tions adopt more efficient ways to expand overseas investments. Based on the government’s energy security policy, Chinese energy corporations seek more efficient mergers and acquisi- tions thereby transforming energy diplomacy from state-based to economy-based. Moreover, the implementation of such ac- tions moves initiatives from the government to enterprises. Enterprises no longer need to depend on negotiations between governments; they may negotiate directly with the host gov- ernment, state-owned enterprise, or Western enterprises. These changes allow Chinese energy diplomacy to attain higher effi- ciency and more importantly, enrich the connotations embed- ded within mercantilism. Mercantilism emphasized the role of the nation, while liber- alism believes that nations play a minimal role. Hence, the case with Chinese energy corporations seems to challenge both mercantilism and liberalism. According to the empirical re- search on Chinese energy diplomacy and the overseas invest- ment of Chinese energy corporations, it is possible for mercan- tilism and liberalism to pre-conditionally co-exist. The precon- dition holds that enterprises require a degree of independence in strategy mapping, while fulfilling governmental policy, and that investment decisions should be based on economic evaluations. However, despite considering that prices in the energy mar- ket are not determined by the supply-demand curve, the energy market is monopolized by trans-national corporations and in- ternational organizations. The phenomenon may be the result of government considerations, since direct mergers and acquisi- tions of trans-national corporations can gain rights associated with oil fields, and also enhance the nation’s status internation- ally. Furthermore, with this enhanced status, the government can take greater control in agenda setting. In order to test this hypothesis, a more complete and holistic picture of the struc- tural change in international energy markets is needed, along with more interviews analyzing the will of the Chinese gov- ernment. These issues may be the focus of future studies and investigations. REFERENCES African Development Bank & the African Union (2009). Oil and gas in Africa (pp. 80-81) . New York: O xfo r d University Press. Angevine, G. & Cameron, B. (2007). Fraser institute global petroleum survey (pp. 9-11). Toronto: Fraser Institute Press. Blair, D. (2007). Why China is trying to colonize Africa? The Tele- graph, 31 August. Bohning, W. R. (1979). International migration and the international economic order. Journal of International Affairs, 33, p. 188. Brander, J. (1995a). Strategic trade policy, NBER working papers, No. 5020 (pp. 65-66). Cambridge: National Bureau of Economic Re- search. Brander, J. A. (1995b). Strategic trade policy. In G. Grossman, & K. Rogoff (Eds.), Handbook of International Economics, Vol. III (p. 1397). New York: Nort h Holland Press. Buzan, B., & Little, R. (2000). International systems in world history: Remaking the study of international relations (pp. 293-294). New York: Oxford University Press. Byman, D., Chubin, S., Ehteshami, A., & Green, J. (2001) Iran’s secu- rity in the post-revolutionary era (pp. 62-64). Santa Monica, CA: Rand Corporation P ress. Cordesman, A. H., & Al-Rodhan, K. R. (2006). The changing dynamic of energy in Middle East (p. 168). Washington DC: Center for Inter- national Strategies and Studies Press. Dougherty, J. E., & Pfaltzgraff, R. L. (2002). Contending theories of international relations: A comprehensive survey (p. 428). New York: Longman press. Downs, E. S. (2004). The Chinese energy security debate. The China Quarterly, 177, 37. doi:10.1017/S0305741004000037 Downs, E. S. (2009). Business interest groups in Chinese politics: The case of the oil companies. In C. Li (Ed.), China’s changing political landscape: Prospects for democracy (pp. 121-141). Washington DC: The Brookings Institution Press. Fravel, M. T. (2005). Regime insecurity and international coop eration: Explaining China’s compromises in territorial disputes. International Security, 30, 80. doi:10.1162/016228805775124534 Garver, J. (2006). China and Iran: Ancient partners in a post-imperial world (pp. 95-128). Seattle, WA: University of Washington Press. Gill, B. (2007). Rising star: Chin a ’s new security diplomacy (pp. 37-52, 165). Washington DC: Brookings Institution Press. Gilpin, R. (1987). The political economy of international relations (pp. 32-37, 180). P rinceton, NJ: Princeton University Press. Goldstein, J. S. (2003). International relations (p. 306). New York: Longman. Held, D., Mcgrew, A., Goldblatt, D., & Perraton, J. (1999) Global transformations: Politics, economic and culture (p. 183). London: Blackwell Publisher Ltd. Jiang, J., & Sinton, J. (2011) Overseas investment by Chinese national oil companies: Assessing the drivers and impacts (pp. 17-20). Paris: International Energy Agency. Krugman, P. R. (1986). Introduction: New thinking about trade policy. In P. R. Krugman (Ed.), Strategic trade policy and the new interna- tional economics (p. 12). Massachusetts: The Massachusetts Institute of Technology Press. Krugman, P. R. (1994). Peddling prosperity: Economic sense and non- sense in the age of diminished expectations (p. 247). New York: W.W. Norton. Lairson, T. D., & Skidmore, D. (2002). International political economy: The struggle for power and wealth (p. 12). Belmont, CA: Wadsworth Publishing Press. Latourrette, T., Bernstein, M., Hanson, M., Pernin, C., Knopman, D., & Overton, A. (2003) Assessing natural gas and oil resources: An ex- ample of a new approach in the Greater Green River Basin (pp. 23-26). Santa Monica, CA : Ra n d C o op e ration Press. Li, D. (2003). The Strategy of energy security: Going out forever. Out- look Weekly, 34, 38-40. Liou, C.-S. (2009). Bureaucratic Politics and Overseas Investment by state-owned oil companies: Illusory champions. Asian Survey, 49, 4, 670-690. doi:10.1525/as.2009.49.4.670 Markusen, J. R., Melvin, J. R., Kaempfer, W. M., & Maskus, K. E. (1995). International trade: Theory and evidence (p. 374). New York: McGraw-Hill. Mcdermott, J. (1999). Mercantilism and modern growth. Journal of Economic Growth, 4, 56. doi:10.1023/A:1009878625417 Nincic, D. J. (2009) Troubled waters: Energy security as maritime security. In G. Luft, & A. Korin (Eds.), Energy security challenges for the 21st century: A reference handbook (p. 98). Santa Barbara, CA: Greenwood Publishing Group Press. Oresman, M. (2007) Repaving the silk road: China’s emergence in Copyright © 2012 SciRe s . 342  H.-C. YEH, C.-W. YU Central Asia. In J. Eisenman, et al. (Eds.), China and the developing world: Beijing’s strategy for the twenty-first century (pp. 60-83). New York: M.E. Sharpe Press. Polgreen, L., & French, H. W. (2007). New power in Africa: China’s trade in Africa carries a price tag. New York Times, 21 August. Reimer, J. J., & Stiegert, K. W. (2006). Evidence on imperfect compe- tition and strategic trade theory: Evidence for international food and agricultural markets, Journal of Agricultural & Food Industrial Or- ganization, 4, 1136-1137. Schmiegelow, H., & Schmiegelow, M. (1975). The new mercantilism in international relations: The case of France’s external monetary policy. International Or g a ni z a t i ons, 29, 369. doi:10.1017/S002081830000494X Snow, P. (1995). China and Africa: Consensus and camouflage. In T. W. Robinson, & D. Shambaugh (Eds.), Chinese foreign policy: The- ory and practice (pp. 285-287). Oxford: Clarendon Press. Sutter, R. G. (2008). Chinese foreign relations: Power and policy since the Cold War (p. 309). Maryland: Rowman & Littlef ield, Inc. Taylor, I. (2004). The “all-weather friend”? Sino-African interaction in the twenty-first century. In I. Taylor, & P. Williams (Eds.), Africa in international politics: External involvement on the continent (pp. 84-87). New York: Routledge Press. Thurow, L. (1992). Head to head: The coming economic battle among Japan, Europe, and America (pp. 245-58). New York: William Mor- row. Tull, D. M. (2006). China’s engagement in Africa: Scope, significance, and consequences. The Journal of Modern African Studies, 44, 460- 462. doi:10.1017/S0022278X06001856 Wang, J. (2004). China petroleum security and geography politics. Resources and Industri e s , 6, 3-7. Wang, J.-H. (2003). Globalization and latecomers: Implications of the East Asian development model and its transition. Taiwanese Journal of Sociology, 31, 1-45. Xinhua (2006). The 11 th fi ve -year plan. Xinhua, 28 February. http://service2.xinhuanet.com/cgi-bin/redirect.cgi?refresh=http://engl ish.gov.cn/special/2006_11th.htm Xu, X. (1998). The geopolitics of oil and gas in the new century: China’s opportunities and challenges. Beijing: Social Sciences Aca- demic Press (China). Zekun, C. (2004). The problem of petroleum security under new global geovisions on petroleum and the strategic thinking about China’s pe- troleum security. International Studies, 2, 67-69. Copyright © 2012 SciRe s . 343
|