 Journal of Service Science and Management, 2012, 5, 318-330 http://dx.doi.org/10.4236/jssm.2012.54038 Published Online December 2012 (http://www.SciRP.org/journal/jssm) Qualifying and Quantifying IT Services Added Values in Outsourcing Assignments—Service Value Agreement Merat Ziyarazavi1,2, Christer Magnusson1, Torbjörn Tergesten2 1Department of Computer and System Sciences, Stockholm University, Stockholm, Sweden; 2Department of Managed Services and Transformation (Application Management and Application Service Management), Tieto, Stockholm, Sweden. Email: merat.ziyarazavi@tieto.com, seye-ziy@fc.dsv.su.se, cmagnus@dsv.su.se, torbjorn.tergesten@tieto.com Received October 8th, 2012; revised November 6th, 2012; accepted November 15th, 2012 ABSTRACT Traditionally, a Service Level Agreement (SLA) including service level metrics is used as an appendix in IT Service Management agreements to define the terms and conditions of delivery and set expectations. However, SLA neither implies nor guarantees the added values that are expected by the customer. Besides, due to the nature of IT services, there always exists uncertainty about the agreed services due to which the perceived risk for both customer and provider is high. Moreover, the quality and quantity of deliv ered values are mostly hidden by hazy marketing slogans. In order to guarantee the values of an offered service, the deliverable added values should be characterized properly, quantified by means of measurable metrics, and agreed upon between the two parties. Such comprehensive material, including the deliverable added values along with their measurable metrics, is called Service Value Agreement (SVA). This research proposes a platform for IT service offerings based on added values by identifying, as well as quantifying, an organiza- tion’s objectives in purchasing Application Management (AM) services from a provider firm. Keywords: IT Outsourcin g; A d ded Value; Global Delivery Model; Service Level Agreement; Service Value Agreement; Application Management Service; Information Technology Infrastructure Library 1. Introduction The primary processes and tasks in most organizations have become strongly IT service dependent [1]. Conse- quently, operational, tactical, and strategic concerns about IT services have become of supreme importance. Through- out this evolution, the concept “service management” has advance d r apidly . On the other hand, multinational organizations as well as government agencies are shifting their focus away from traditional models of delivering IT services to a delivering strategy that is based on global Information and Communication Technology (ICT) resources. The upward trend of global delivery models, where service providers utilize both near- and off-shoring to provide their customers with ICT services, has originated due to environmental demands that push for cost cutting re- quirements [2-4]. Reducing cost, globalization, new en- trants [5], and most recently adding value to the custom- ers’ businesses are pressures which service providers are dealing with. This trend is easily perceptible from cita- tions such as “global sourcing is the next wave of global- ization” [6] and statistics; in 2007, IBM’s revenue from service sector was $54B [7] w hile in 2011 it had gon e up to $144B [8]. While the external and internal pressures initiated the movement toward global delivery models, the conver- gence of hardware, software, and services has also accel- erated the adoption of this model and has the potential to entirely transform the models of IT service delivery. In- deed, this convergence is likely to be driving the long- term growth of the IT services delivery sector. This con- vergence of technology, people, and processes including software, hardware and services, changes the expecta- tions, governance structures and strategies of players, both suppliers and customers over time [4]. Apart from the motivations of outsourcing and what- ever the organizational strategy is, during the outsourcing project, organizations have to enter to a new world, ex- perience new types of engagements and try to catch a win-win situation in which both parties gain benefit. For this purpose, the contract is an essential component. Tra- ditionally, Service Level Agreement (SLA), at the heart of service management [1], is one of the main appendices of the contract which is used as an agreement between service provider and customer. An SLA defines the terms and conditions for both parties in order to set the expec- tations as well as boundaries and measure whether the customer-provider relationship is working [9]. However, an SLA does not evaluate the added value to the business Copyright © 2012 SciRes. JSSM  Qualifying and Quantifying IT Services Added Values in Outsourcing Assignments—Service Value Agreement 319 precisely and, therefore, a platform for IT service offer- ings based on added values is needed. Service Value Agreement (SVA) identifies the high level business added values required by organizations and quantifies the extent of their achievements by means of metrics. 1.1. Tieto as Research Environment Tieto is one of the largest IT service companies in Northern Europe providing IT outsourcing, consulting and product engineering services. Tieto aims to become a leading service integrator creating the best service ex- perience in IT. The company’s customers are from dif- ferent sectors such as automotive, financial services, telecom & media, healthcare & welfare, forest, energy, manufacturing, retail & logistics, and the public sector. Tieto is considered a serious competitor for global ser- vice providers such as IBM and Accenture. Being in such an aggressive market makes Tieto to put extra effort into research and development projects to gain competitive advantage. Gaining customer satisfac- tion can be the most powerful competitive advantage and this would not be achievable unless customers conceive high levels of value and business efficiency out of their relationship with the IT service provider. Absorbing more satisfaction and, consequently, more customers would be enough to motivate Tieto to go forward to bet- ter understand their customers’ values and a way to quantify them. Therefore, the following questions are investigated: 1) What are the deliverable added values in an offered service; 2) How they can be quantified by means of metrics? 1.2. Research Outline The objective of this article, which is extracted from a project conducted in cooperation with Tieto, is to pro- pose a platform for IT service offerings, based on added values for customers. The paper is framed as follows. Section two describes the research methodology, data collection as well as vali- dation methods utilized by the authors in conducting the study. This section is followed by section three in which a short theoretical background around the nature of an SLA and its shortcomings in the competitive environ- ment of today, as well as the concept of “value” in deliv- ering IT services is outlin ed. In other words, section three provides appropriate reasons to motivate conducting this study and highlight the necessity of utilizing findings presented in section four. Section four is considered as the core of this study. It is divided into two main parts: generic added values and customized added values. The first segment presents the identified added values along with their measureable metrics that are generic and can be used in any Application Management (AM) service. The second segment discusses the identified added val- ues utilized for a specific AM service i.e. Change Man- agement service. In section five all identified values are gathered in the form of a comprehensive table showing service added values in a nu tshell. Finally, in section six, concluding remarks together with suggestions for further research are provided. 2. Research Methodology The research conducted in Tieto is based on interaction with senior managers, reports and internal documenta- tions. In this study interaction research [10] is utilized in which learning from a firm-based study with “reflective practitioners” [11], literatu re review, and experiences are combined The research process is made up of three phases: 1) pre-understanding phase during which the initial primary as well as secondary data on value creation and value delivery are collected; 2) interpretation phase in which the theoretical and empirical collected data are analyzed and the conclusion remarks for the third phase are drawn; 3) the SVA development phase aimed at introducing the identified “values” and developing the correspondent metrics. Between the first and second phase, the authors participated in a workshop facilitated by the firm in which the authors gained the complementary knowledge about how value is created practically and what consti- tutes value. The research process is elucidated in detail in Table 1. The validity of the proposed SVA has been evaluated by means of a Focus Group [12] that is conducted jointly by participation of a customer executive, project manager and a delivery mentor of the firm. The three persons are not selected randomly; rather they are chosen according to the recommendations proposed by [13]. To follow Barnet’s recommendations, firstly, the participants are considered as experienced with b rilliant reputation in the company. Secondly, they have close relationships with different sorts of customers so they are aware of real pains and needs. The customer executive and the sales specialist have been involved with several customer cases and the project manager had been employed by a customer previously. Thirdly, they observe the dilemmas from both provider’s and customer’s perspectives, and hence they are very open to conceive the obstacles and make assessments impartially. 3. Literature Review 3.1. What Is SLA and Why SLA? Information Technology Infrastructure Library (ITIL) is a collection of best practices of IT services delivery and s usually used as a reference for practitioners [1]. SLA is i Copyright © 2012 SciRes. JSSM 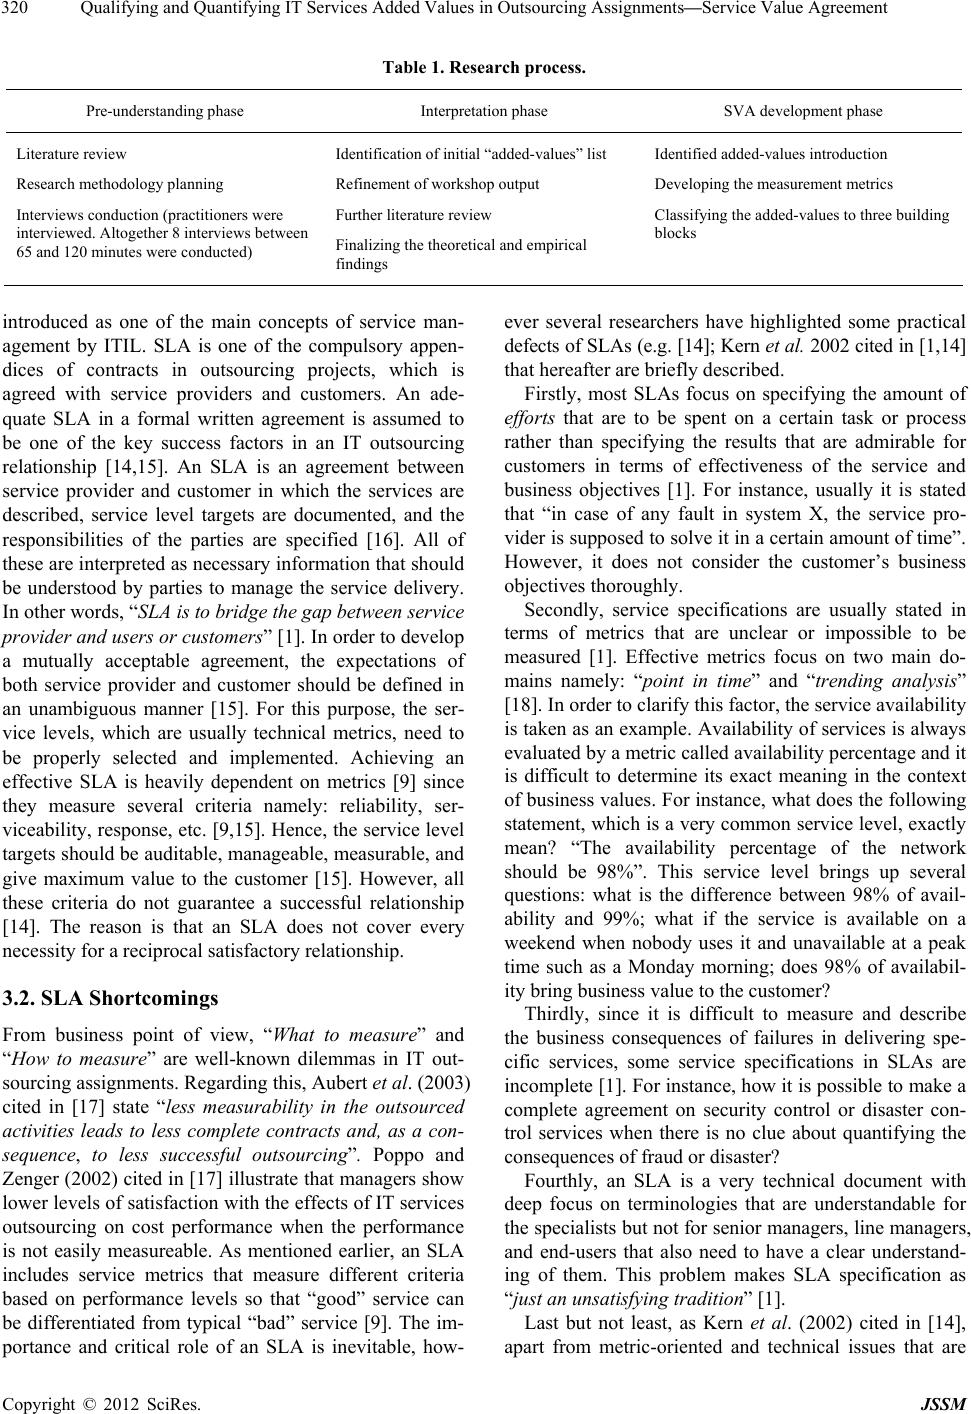 Qualifying and Quantifying IT Services Added Values in Outsourcing Assignments—Service Value Agreement Copyright © 2012 SciRes. JSSM 320 Table 1. Research process. Pre-underst anding phase Interpretation phase SVA development phase Literature review Research methodology planning Interviews conduction (practitioners were interviewed. Altogether 8 interviews between 65 and 120 min utes were conducted) Identification of initial “added-values” list Refinement o f w o rk s ho p output Further literature review Finalizing the theoretical and empirical findings Identified added-values introduction Developing the measurement me trics Classifying the added-values to three building blocks introduced as one of the main concepts of service man- agement by ITIL. SLA is one of the compulsory appen- dices of contracts in outsourcing projects, which is agreed with service providers and customers. An ade- quate SLA in a formal written agreement is assumed to be one of the key success factors in an IT outsourcing relationship [14,15]. An SLA is an agreement between service provider and customer in which the services are described, service level targets are documented, and the responsibilities of the parties are specified [16]. All of these are interpreted as necessary information that should be understood by parties to manage the service delivery. In other words, “SLA is to bridge the gap between service provider and users o r cu stomers ” [1]. In o rder to de v elo p a mutually acceptable agreement, the expectations of both service provider and customer should be defined in an unambiguous manner [15]. For this purpose, the ser- vice levels, which are usually technical metrics, need to be properly selected and implemented. Achieving an effective SLA is heavily dependent on metrics [9] since they measure several criteria namely: reliability, ser- viceability, response, etc. [9,15]. Hence, the service level targets should be auditable, manageable, measurable, and give maximum value to the customer [15]. However, all these criteria do not guarantee a successful relationship [14]. The reason is that an SLA does not cover every necessity for a reciprocal satisfactory relationship. 3.2. SLA Shortcomings From business point of view, “What to measure” and “How to measure” are well-known dilemmas in IT out- sourcing assignments. Regard ing th is, Aubert et al. (2003) cited in [17] state “less measurability in the outsourced activities leads to less complete contracts and, as a con- sequence, to less successful outsourcing”. Poppo and Zenger (2002) cited in [17] illustrate that managers show lower levels of satisfaction with the effects of IT services outsourcing on cost performance when the performance is not easily measureable. As mentioned earlier, an SLA includes service metrics that measure different criteria based on performance levels so that “good” service can be differentiated from typical “bad” service [9]. The im- portance and critical role of an SLA is inevitable, how- ever several researchers have highlighted some practical defects of SLAs (e.g. [14]; Kern et al. 2002 cited in [1,14] that hereafter are briefly described. Firstly, most SLAs focus on specifying the amount of efforts that are to be spent on a certain task or process rather than specifying the results that are admirable for customers in terms of effectiveness of the service and business objectives [1]. For instance, usually it is stated that “in case of any fault in system X, the service pro- vider is supposed to solve it in a certain amount of time”. However, it does not consider the customer’s business objectives thoroughly. Secondly, service specifications are usually stated in terms of metrics that are unclear or impossible to be measured [1]. Effective metrics focus on two main do- mains namely: “point in time” and “trending analysis” [18]. In order to clarify this factor, the service availab ility is taken as an example. Availability of services is always evaluated by a metric called availab ility p ercen tage and it is difficult to determine its exact meaning in the context of business values. For instance, what does the following statement, which is a very commo n service level, exactly mean? “The availability percentage of the network should be 98%”. This service level brings up several questions: what is the difference between 98% of avail- ability and 99%; what if the service is available on a weekend when nobody uses it and unavailable at a peak time such as a Monday morning; does 98% of availabil- ity bring business value to the customer? Thirdly, since it is difficult to measure and describe the business consequences of failures in delivering spe- cific services, some service specifications in SLAs are incomplete [1]. For instance, how it is possible to make a complete agreement on security control or disaster con- trol services when there is no clue about quantifying the consequences of frau d or disaster? Fourthly, an SLA is a very technical document with deep focus on terminologies that are understandable for the specialists but not for senior managers, line managers, and end-users that also need to have a clear understand- ing of them. This problem makes SLA specification as “just an unsatisfying tradition” [1]. Last but not least, as Kern et al. (2002) cited in [14], apart from metric-oriented and technical issues that are  Qualifying and Quantifying IT Services Added Values in Outsourcing Assignments—Service Value Agreement 321 not fully supported by SLA, there are some intangible benefits that can be delivered but have been ignored by SLAs. Effective provider-customer relationship and gov- ernance-oriented concerns like communication mecha- nisms, joint decision-making processes, partnership, mu- tual trust, and the “feeling” that a provider gives to a customer are examples of such intangible benefits. Re- spectively, the numeric metrics seem essential in agree- ments though the real problems and dissatisfactions mostly depend on intangible values. 3.3. What Constitutes Value? The core purpose in business-to-business relationships is exchanging value between parties so that both customer and provider gain as much advantages as possible out of this relationship. Moreover, due to commoditization of product market, the value creation process has moved towards service market [19]. Regarding this trend, as [19] illustrates, a central strategic and marketing theme in service provider firms is the ability to provide value for customers continuously. As Osterm et al. (2010) cited in [20] have also emphasized, proposing tools for “captur- ing value in use” and “communicating value to custom- ers” are two upmost considerations in managers’ agenda. Traditionally, cost reduction was distinguished as the core value in all firms [21] while as [22] explicitly dem- onstrated, price does not bring much differentiation anymore and, instead, service support, skills, close rela- tionship, and more abstract “know-how” process have become core. This idea is directly reflected from the Ser- vice-Dominant logic (S-D logic) perspective expressed by Vargo and Lusch where competence, value proposition and value co-creation are highlighted interactivel y [19] . The term “value” is defined from different perspec- tives in different IT contexts e.g. from “service” or “cus- tomer point” of views (e.g. [16,23]) however the concept of “value” is still elusive and always gives rise to lots of questions, for example: how the value should be ex- pressed [24]; how to clarify the complicated character of value [25]; how do the parties know if they gain their desired value and for whom the value is created [24]? These questions will become even more complex in IT outsourcing relationships in which the level of risk and uncertainty of outcome upon the contract is high (Wilson et al., 1991 and Henthorne et al., 1993 cited in [26]) and, relatively, provider and customer cannot come to an agreement on what constitutes “value” [20,25]. Service Value Agreement by creating a framework for identifying and measuring the business added values that organizations aim to achieve, addresses this problem. SVA defines metrics in order to assess the maturity of service providers in value delivery and resolves the am- biguities concerning “to what extent should values be delivered?” 4. Deliverable Added Values In order to address the SLA defects highlighted in Sec- tion 3.2 and provide a common ground for service pro- viders and customers to understand the term “value”, the following question should be answered: “What are the added values desired by customers that should be deliv- ered by providers?” This section aims to identify and quantify a set of de- liverable values. These values are divided into two cate- gories based on their nature and the message which is expressed by them, namely: generic added values which can be utilized in any IT services; customized added values which are developed specifically for one of the widely used AM services i.e. Change Management ser- vice. Each proposed added value is motivated and sup- ported by short theoretical as well as practical back- ground in order to ensure the importance and criticality of the value. 4.1. Generic Added Values 4.1.1. Process Audi ti ng What has been discussed thoroughly in this project is delivering added values to the customers. But how is the so called “value” supposed to be delivered? In order to answer this question, ITIL definition has been considered. From the general point of view, service is “a means of delivering value to customers by facilitating outcomes customers want to achieve, without the ownership of spe- cific costs and risks” [27] where the service itself is set of capabilities delivered by means of processes. Processes, including activities and sub-processes, are types of “closed-loop systems” and have several characteristics. A process should be measurable, have a specific result, deliver an outcome to a specific user, and established for responding to an event (p. 12). As it is shown in Figure 1, in order to deliver a reasonable service (delivering a valid value to the customer) the processes shou ld run perfectly and their quality monitored. Figure 1. A basic process (adopted from [27]). Copyright © 2012 SciRes. JSSM  Qualifying and Quantifying IT Services Added Values in Outsourcing Assignments—Service Value Agreement 322 Providers need to audit processes to ensu re the service is delivered as it is planned and according to the defined processes. As fundamental definitions convey, process performance assessment is the starting point, or it is bet- ter to say a pre-requisite, for service performance evalua- tion. For this purpose, the extent of processes implemen- tation is observed and potential corrections should be made. The auditing process is referred to differently by various providers, although it is called Process Imple- mentation Level (PIL) by Tieto. PIL includes questions reflecting the minimum requirements for investigating the performance of a basic process. Hence, PIL meas- urement, which is usually carried out by surveys, verifies the compliance of the service provider in process imple- mentation. If a customer requirement would be service delivery based on their own processes, auditing can also be done on customer processes in order to find the needed improvements for delivering services. According to the existing method for process evalua- tion, the authors believe PIL measurement can also be used as a tool for assessing the maturity and capability of service providers in utilizing the agreed processes and, consequently, agreed services. In other words, since ser- vices are based on a set of processes, the quality of de- livered services relies highly on quality of processes im- plementation. So, it is not unreasonable to conclude that PIL measurement indirectly evaluates the quality of ser- vice. In order to assess the result of PIL, the authors propose the following KPI i.e. Equation (1) in which the threshold is settled based on nature of the service and customer’s priorities. To conclude, the result of auditin g shows the degree to which processes comply with minimum requirements. Process auditing can be done during the contract peri- odically or when the delivery team is established. 4.1.2. On-Ti me Deli ver y The importance of “time” in delivering IT services has been mentioned by various literatures ([3,5], etc.) as well as practitioners. Timely service delivery, along with rea- sonable price, are two of the most important success fac- tors in competitive environments [28] so that requiring rapid service solutions in critical situations does not let customers get trapped by inflexible providers [29]. On the other hand, market dynamics including new competitors, new regulations, and specifically new mar- ket requirements leaves organizations struggling to “re- duce their time to market” in order to meet customer’s demands [5]. Consequently, the IT service providers need to be flexible as well as agile in response to newly emerged issues. From a practical point of view and according to end user satisfaction surveys conducted by the service pro- vider, on-time delivery ranked as one of the most impor- tant factors in customer satisfaction. On-time service delivery, which is well known as “keeping the release timetable” among practitioners, is an instance of process maturity as well. In other words, one of the outcomes of mature processes is to be on time and flexib le in deliver- ing requests. Regarding this, [30] recommended imple- menting an index to measure how long for a service pro- vider takes to satisfy customer requests. By considering this recommendation and affiliate it to AM, this study proposes the following index for calculating ability of provider in responding to requests. On-time deliv e red requests Time Accuracy IndexTotal requests received (2) This index provides the possibility to assess the extent to which provid ers are responsive and their processes are mature. It is worth mentioning that the term “request” is considered as a general concept so that the proposed in- dex can be used for estimating the percentage of on-time delivered projects, critical standard changes, customer’s new demands, requests for information, or on-time re- solved incidents. 4.1.3. Stand ardization By increasing the complexity of market needs and busi- ness processes, both service providers and customers are seeking operational eminence by automation along with standardizing the way of doing things [31]. Process stan- dardization as the alliance of business processes aims to designate transparent and identical process activities across the value chain [17]. As [32] described, a process is completely standardized whenever each time it is exe- cuted in optimal predetermine way thus performing ex- actly the same tasks and creating the identical output. In other words, standard process is repeated constantly, in- cludes predefined input, and produces forecasted output. There are different motivations for standardization stated by varies theoretical literature as well as practical guide- lines. Reference [17] highlighted the role of standardiza- tion as a prerequisite for outsourcing and a procedure for increasing performance. Reference [31] confirmed the former element mentioned by Wüllenweber and com- plemented it by two other factors, namely automation and streamlining processes. On the other hand, [33] in- dicated increase control over execution, increased effi- ciency, and professionalism as initial incentives of stan- No. ofdeviationsfromprocessutilizationrequirements PIL Measurement IndexTotalno. ofprocessutilizationrequirements (1) Copyright © 2012 SciRes. JSSM  Qualifying and Quantifying IT Services Added Values in Outsourcing Assignments—Service Value Agreement 323 dardization. Reference [32], by approving the previously conducted studies, add controllability, transparency, and risk reduction as the main motivation factors for stan- dardization. To move forward from a theoretical outlook through practical perspective, ITIL, as a well-founded reference among practitioners, emphasize the critical roles of stan- dardization along with automation in cost reduction so that they shrink the complexity o f processes and simplify tasks [16]. As ITIL discussed, standardization can be used for “supporting services to leverage economies of scale and to reduce operating costs” [16] meaning that standardization helps to manage resources in a more prope r way and, therefo re, reduce th e costs where c ost is not only considered as the operational cost but also the hidden costs [16] such as costs for identifying customer’s values and customer’s priorities costs of transaction, quality criteria. From a resources point of view, ITIL also mentioned standardization as a factor for increasing ser- vice potential [16]. By considering the customer perspec- tive, standardization leads to costs reduction and what is more, it gives the opportunity to spread the tasks between several providers and easily switch between them [16]. As it is clear, vast amounts of studies have been con- ducted on standardizatio n, its components, tools, policies, and different strategies for their implementation. It is praised by practitioners as a crucial factor in IT service outsourcing as well. Considering the advantages of stan- dardization and the incremental trend of market demand, convinced authors to consider it as a vital component. Hence, automated tasks and standardized processes, which collaborate in delivering a service, are prominent added values for customers. Apart from all benefits and motivations stimulating standardization, it is easier to say than to do. So, practi- tioners face vast range of challenges [31]. As [32] pro- pose in their process standardization model, process complexity and standardization effort are two important factors that have a direct effect on process standardiza- tion. As they discussed, processes need different levels of effort for standardization due to different complexity levels that they have; the more complex a process is, the more effort it requires. However, there is no generally accepted method or instrument for scaling the process complexity and estimating the amount of effort that is needed for specific pro cess implementation [32]. For this purpose, as previous studies have suggested, the authors proposes a survey as a means for gaining fairly structured understanding about the lev el of complexity of processes and the needed effort for standardization. Finally, a separate survey assesses the extent to which the proc- esses have been standardized. The survey including the questions is documented in Table 2. The validity and efficiency of the survey is confirmed since the questions are designed based on PIL measurement used by service providers (see Section 4. 1.1) and [32]’s study . The following index assesses the ability of service provider in standardizing processes. The current stage of process standardization, process complexity, and the needed effort for performing stan- dardization should be assessed by means of “bar survey”. In each segment the score is calculated by getting aver- age meaning that, for instance, the score for extent of process complexity is the average of grades that are given to survey questions in complexity section and so forth. According to the result of first survey, a certain level of standardization, which should be met, is agreed between parties and the proper actions will be considered by the provider. Finally, the standardization survey is conducted again and the output will be compared with the initial result. This can be done iteratively in order to monitor the level of improvement. In this way, the capa- bility of a provider in performing standardization and implementing standard processes is evaluated. 4.1.4. Relati o n shi p Management Customer-provider relationship has been widely dis- cussed by researchers ([5,19,26,34]; etc.) and praised as one of the critical success factors both in practice and academia. As [5] mentioned, most unsuccessful offshor- ing practices are due to customers being unprepared for offshoring relationships. On the other hand, cultural dif- ferences and new business environment of offshoring assignments make the situation even worse [5]. As [5] discussed, close relationship with customer leads to mu- tual trust, correct understanding about the business ob- jectives, and, consequently, helps deliver desirable ser- vices. Reference [35] brings this issue as a factor for customer satisfaction; according to their study, in 2009, 29% of questioned customers were not satisfied with vendors in term of enough investment in people and time in building a good relationship, compared with 25% in 2008. This indicates the incremental trend of customer’s demands on close relationship and providers’ deficiency in fulfilling it. Moreover, as an interviewed delivery manager of Ti- eto explained, the importance of team spirit, honesty and goodwill in relationships, solidarity, collaboration, and mutual trust in the provider-customer relationships are emphasized and highlighted as pre-requisites for long- Status ofprocess afterstandardizationactivities Standardization IndexStatus ofprocess before standardizationactivities (3) Copyright © 2012 SciRes. JSSM  Qualifying and Quantifying IT Services Added Values in Outsourcing Assignments—Service Value Agreement 324 Table 2. Standardization survey questions. Construct Survey Question Reference 1) To what extent do you follow a well-regulated process cycle during the execution of the business process? 2) To what extent do you document the actions of the business process? 3) To what extent the business process organized as efficient as possible? Muenstermann et al., 2010 c i t e d in [32] 4) To what extent do the roles and responsibilities of the actual process clearly understood and communicated with relevant stakeholders? PIL measurement (quality and process manageme n t, p rocess implementation) 5) To what extent does a plan exist for process implementation/process improvement and supported follow-up? (Is the execution of business process standardized?) PIL measurement (quality and process management), Muenstermann et al., 2010 cited in [32] 6) To what extent hav e you defined an d communicated a clear policy in your unit for process implementation, process performance, and quality management? PIL measurement (quality and process management) Process standardization 7) To what extent have escalation channels been defined effectively? PIL measurement (delivery governance) 1) To what extent have all involved employees totally immersed in the standardization? Lilien et al., 2004 cited in [32] 2) How many FTEs have you involved in business process standardization?Swanson & Danes, 20 00 cited in [32] 3) How many hours training have you provided for involved empl oye e s? 4) To what extent do you collect feedback including improvement proposals from the process operations in your unit? Standardization effort 5) To what extent do you consistently act on customer complaints with improvement actions that are shared with customer? PIL measurement (quality and process management) 1) To what extent do the employees executing the business process need specific experience? 2) To what extent does the business process repeat an identical procedure? Lillrank, 2003 cited in [32] 3) To what extent does the business process include uncertainty? 4) To what extent the input of the business process is alterable? (Based on nature of busine ss process, express whether the business process has a single constant input or different set of inputs) Process complexity 5) To what extent does business process produce same output? (Based on the nature of business process, express how far the business process produces the same output) Lillrank & Liukko, 2004 cited in [32] term partnership. Reference [36] confirmed the impor- tance of relationship governance as a success factor and forefront issue in business thinking in last few years. Importance of well-established governance structure is also stated in several of the documented practices in Ti- eto e.g. [37]; “governance enables elements creating business agility including awareness, flexibility, adapta- bility, and productivity to work together. In practice, this means that these components allow the business to know what is going on, how to deal with expected change, operate efficiently, and how to deal with unexpected challenges.” The governance structure that has been praised by Milling Govekar, the Vice President and Research Di- rector of Gartner Group in ICT operations, as an efficient and well-structured method is based on three levels of communication, namely delivery team, management team, and leadership team which construct the opera- tional, tactical and strategic levels of an organization Copyright © 2012 SciRes. JSSM  Qualifying and Quantifying IT Services Added Values in Outsourcing Assignments—Service Value Agreement 325 respectively. However, due to the complexity of outsourcing pro- jects, governance cannot be done without an outlined plan [38,39]. One interviewed senior advisor of the ser- vice provider illustrated that scheduled meetings in dif- ferent organizational levels between service provider and customer are at the heart of governance by which the health of delivery is confirmed and the provider-cus- tomer relationship has been kept close. “By correct gov- ernance plan, the right things are done by the right peo- ple at the right time”, the senior advisor stated. According to the proclaimed practical as well as theo- retical sources, the authors have considered governing the provider-customer relationship as a critical undertak- ing in IT services outsourcing and effective governance plan as an added value for customers. Effective govern- ance plans with escalation channels can resolve issues regarding customer-provider relationship in a wider ex- tent and, therefor e, it should be under consideration from a very early stage (i.e. agreement phase). In order to reach this goal, two indexes for controlling the govern- ance plan and its fulfillment are proposed by this study. o.ofmissed governance meetings On-time Governance ModelIndexTotalno. ofagreedgovernancemeetings (4) o. ofescalationshandledunsuccessfully On-plan Governance Model IndexTotal no.ofhandled escalations (5) The organizational level in which the meetings should be held as well as number and frequency of meetings supposed to initially be agreed and scheduled in agree- ment. The escalation channels need to be defined prop- erly to ensure parties have cor rect level of understanding of them in case of any problems in terms of adherence between parties. The governance plan including defined indexes enables the parties to easily figure out “who is engaged in governance”, “how they are associated”, “what they do”, and finally “how they collaborate”. Be- sides, the risks as well as the resources are optimized and the benefits are realized. By means of the above stated indexes, the governance manag ement quality is ev aluated so that defect spots are identified and handled quickly. 4.1.5. SLA Fulfillment Increasing performance, effectiveness, and efficiency of business processes are initial goals of outsourcing IT services to IT service providers [26]. However, these terms are rather abstract terms and used in marketing context while practically there is no specific method or metric to measure these indicators, except in an SLA. As described in Section 3.1, apart from legal issues making an SLA as a “must” in agreements, an SLA consists of descriptions of technical as well as organizational targets on which parties agree [40]. Service levels monitor the extent of service objectives fulfillment and the ability of service providers to react according to contract. On the other hand, as described in Section 4.1.3, ser- vice providers and customers agree upon several meet- ings in different organizational levels, strategic-tactical- operational, in order to ensure the health of processes and mutual expectations gratification. There are several rea- sons for meetings in different levels. One of the main objectives of meetings at the delivery level is to review the extent of SLA fulfillment. Reference [30] also con- siders the gravity of SLA fulfillment and proposes as- sorted metrics on SLA in different contexts. By considering the crucial role of an SLA, goals of oper- ating teams meetings, and by getting inspiration from [30]’s metrics, this study has proposed an ind ex for assess- ing the extent of fulfillment of SLA targets by providers. No. ofrequestsmetSL Supplier Care IndexTotal no.ofrequestswithin SLAbouy A ndr (6) This index shows the ability of service providers to respond to agreed objectives within any SLA and, con- sequently, to deliver service with high perfo rmance ratio. It is worth mentioning that this index does not indicate the extent of SLA fulfillment overall, rather the SLA fulfillment is assessed per service. 4.1.6. Service Availability Availability is the foremost fundamental aspect of ser- vice, which assures value for customer while at the same time it is the most readily sensed aspect of service [16]. As ITIL elaborates, service should be designed with fault tolerance acceptable to the customer. Hence, importance of a metric for measuring the amount of availability of service is inevitable and ensures customers about reten- tion of critical processes operation. Service providers are usually quite mature in not breaching this core service level target. However, what is measured by means of the service level target is the amount of time that a service is available; it may not measure whether the availability is during business hours or not. The value of this index comes from the fact that the availability here represents the time when the service/application is actually used during business hours. Reference [30] introduces two indexes for service availability. However, these indexes have also missed this fact. As discussed by Smith, availability meant dif- ferent things for continuous and discrete services. Copyright © 2012 SciRes. JSSM 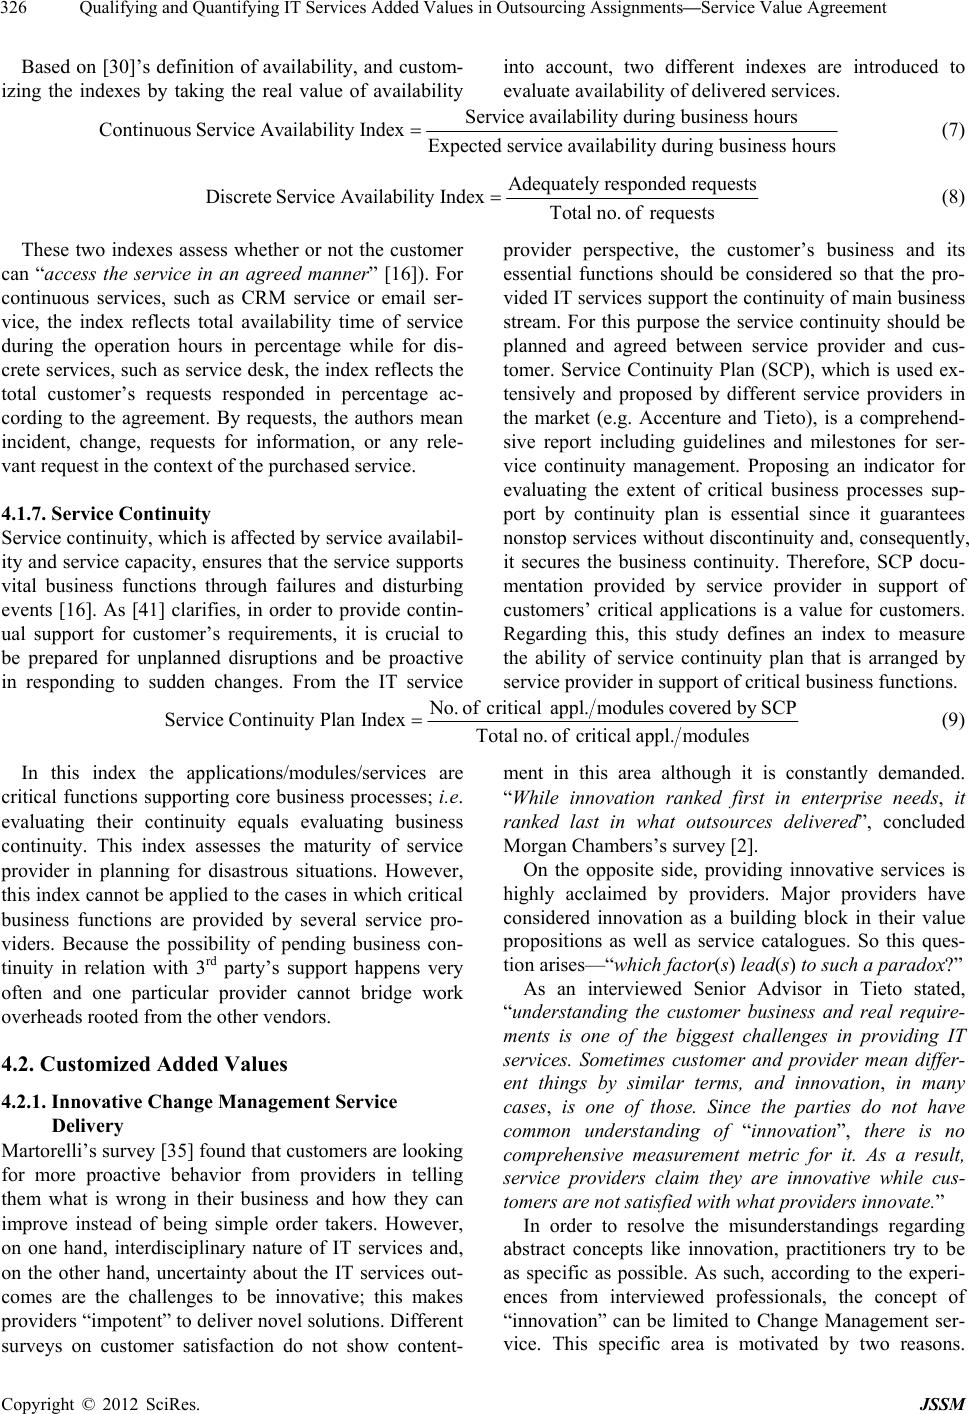 Qualifying and Quantifying IT Services Added Values in Outsourcing Assignments—Service Value Agreement 326 Based on [30]’s definition of availability, and custom- izing the indexes by taking the real value of availability into account, two different indexes are introduced to evaluate availability o f delivered services. Serviceavailability during business hours ContinuousService Availability IndexExpected serviceavailability during business hours (7) Adequatelyresponded requests DiscreteServiceAvailabilityIndexTotalno. ofrequests (8) These two indexes assess whether or not the customer can “access the service in an agreed manner” [16]). For continuous services, such as CRM service or email ser- vice, the index reflects total availability time of service during the operation hours in percentage while for dis- crete services, such as service desk, the index reflects the total customer’s requests responded in percentage ac- cording to the agreement. By requests, the authors mean incident, change, requests for information, or any rele- vant request in the context of the purchased service. 4.1.7. Service Conti nuity Service continuity, which is affected by service availabil- ity and service capacity, ensures that the service supports vital business functions through failures and disturbing events [16]. As [41] clarifies, in order to provide contin- ual support for customer’s requirements, it is crucial to be prepared for unplanned disruptions and be proactive in responding to sudden changes. From the IT service provider perspective, the customer’s business and its essential functions should be considered so that the pro- vided IT services support the continuity of main business stream. For this purpose the service continuity should be planned and agreed between service provider and cus- tomer. Service Continuity Plan (SCP), which is used ex- tensively and proposed by different service providers in the market (e.g. Accenture and Tieto), is a comprehend- sive report including guidelines and milestones for ser- vice continuity management. Proposing an indicator for evaluating the extent of critical business processes sup- port by continuity plan is essential since it guarantees nonstop services without d iscontinuity and, consequently, it secures the business continuity. Therefore, SCP docu- mentation provided by service provider in support of customers’ critical applications is a value for customers. Regarding this, this study defines an index to measure the ability of service continuity plan that is arranged by service provider in support of critical business function s. o. ofcriticalappl.modulescoveredby SCP ServiceContinuity PlanIndexTotalno. ofcriticalappl.modules (9) In this index the applications/modules/services are critical functions supporting core business processes; i.e. evaluating their continuity equals evaluating business continuity. This index assesses the maturity of service provider in planning for disastrous situations. However, this index cannot be applied to the cases in which critical business functions are provided by several service pro- viders. Because the possibility of pending business con- tinuity in relation with 3rd party’s support happens very often and one particular provider cannot bridge work overheads rooted from the other vendors. 4.2. Customized Added Values 4.2.1. Innova ti ve Ch an ge M anagement Service Delivery Martorelli’s survey [35] found that custo mers are looking for more proactive behavior from providers in telling them what is wrong in their business and how they can improve instead of being simple order takers. However, on one hand, interdisciplinary nature of IT services and, on the other hand, uncertainty about the IT services out- comes are the challenges to be innovative; this makes providers “impotent” to deliver novel solutions. Different surveys on customer satisfaction do not show content- ment in this area although it is constantly demanded. “While innovation ranked first in enterprise needs, it ranked last in what outsources delivered”, concluded Morgan Chambers’s survey [2]. On the opposite side, providing innovative services is highly acclaimed by providers. Major providers have considered innovation as a building block in their value propositions as well as service catalogues. So this ques- tion arises—“which factor(s) lead(s) to such a paradox?” As an interviewed Senior Advisor in Tieto stated, “understanding the customer business and real require- ments is one of the biggest challenges in providing IT services. Sometimes customer and provider mean differ- ent things by similar terms, and innovation, in many cases, is one of those. Since the parties do not have common understanding of “innovation”, there is no comprehensive measurement metric for it. As a result, service providers claim they are innovative while cus- tomers are not satisfied with what providers innovate.” In order to resolve the misunderstandings regarding abstract concepts like innovation, practitioners try to be as specific as possible. As such, according to the experi- ences from interviewed professionals, the concept of “innovation” can be limited to Change Management ser- vice. This specific area is motivated by two reasons. Copyright © 2012 SciRes. JSSM 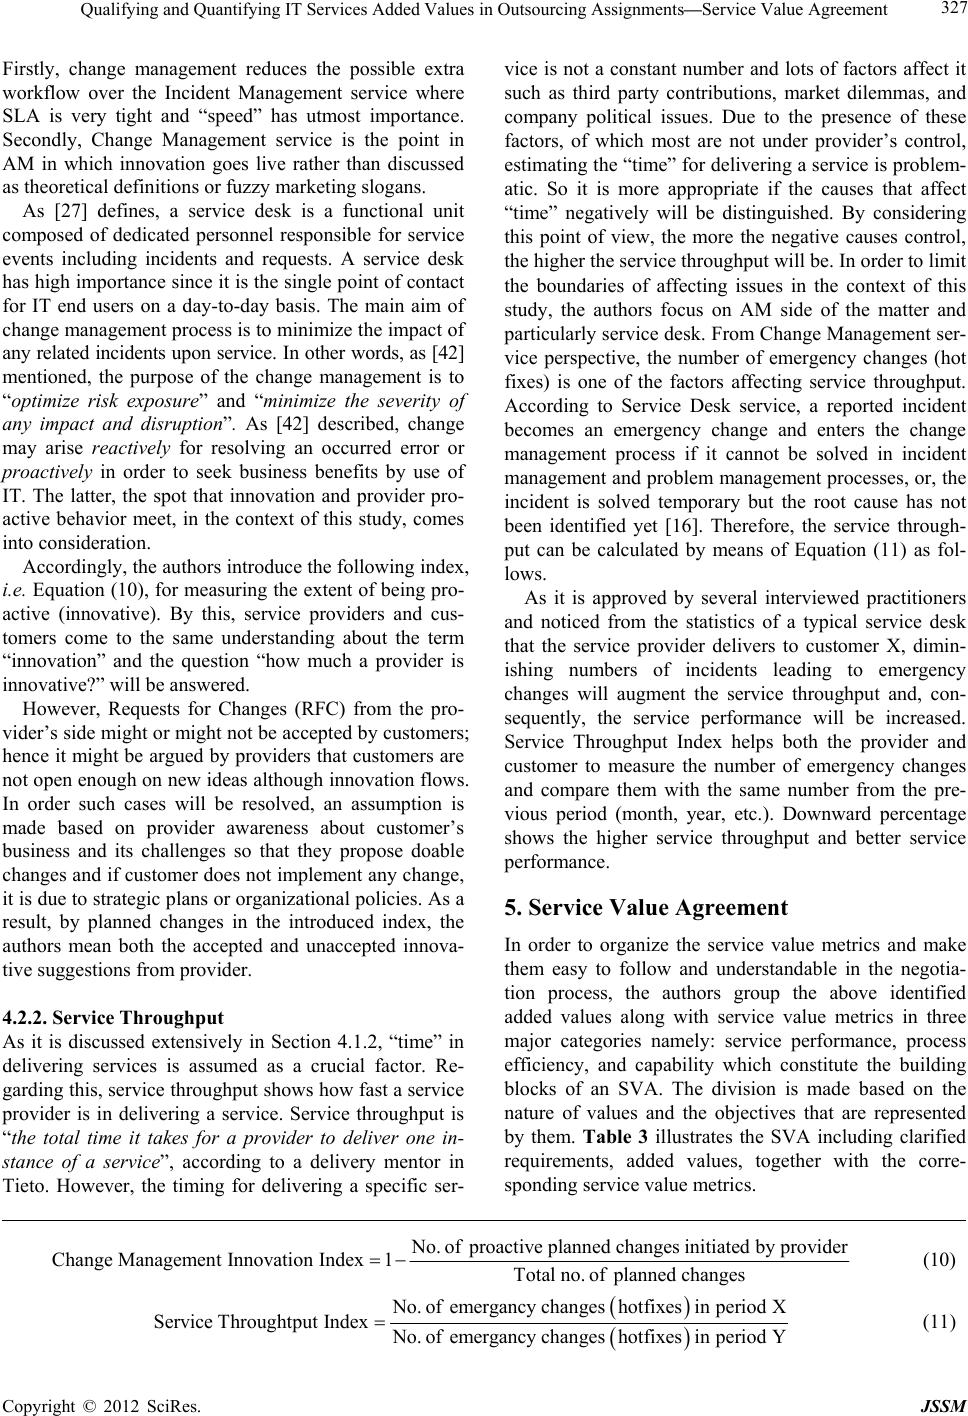 Qualifying and Quantifying IT Services Added Values in Outsourcing Assignments—Service Value Agreement 327 Firstly, change management reduces the possible extra workflow over the Incident Management service where SLA is very tight and “speed” has utmost importance. Secondly, Change Management service is the point in AM in which innovation goes live rather than discussed as theoretical definitions or fuzzy marketing slogans. As [27] defines, a service desk is a functional unit composed of dedicated personnel responsible for service events including incidents and requests. A service desk has high importance since it is th e single point of con tact for IT end users on a day-to-day basis. The main aim of change management process is to minimize the impact of any related incidents upon service. In other words, as [42] mentioned, the purpose of the change management is to “optimize risk exposure” and “minimize the severity of any impact and disruption”. As [42] described, change may arise reactively for resolving an occurred error or proactively in order to seek business benefits by use of IT. The latter, the spot that innovation and provider pro- active behavior meet, in the context of this study, comes into consideratio n. Accordingly, the autho rs intro duce the following index, i.e. Equation (10), for measuring the extent of being pro- active (innovative). By this, service providers and cus- tomers come to the same understanding about the term “innovation” and the question “how much a provider is innovative?” will be answered. However, Requests for Changes (RFC) from the pro- vider’s side might or might not be accepted by customers; hence it might be argued by providers that customers are not open enough on new ideas although innovation flows. In order such cases will be resolved, an assumption is made based on provider awareness about customer’s business and its challenges so that they propose doable changes and if customer does not implement any change, it is due to strategic plans or organizational policies. As a result, by planned changes in the introduced index, the authors mean both the accepted and unaccepted innova- tive suggestions from provider. 4.2.2. Service Throughput As it is discussed extensively in Section 4.1.2, “time” in delivering services is assumed as a crucial factor. Re- garding this, service throughpu t shows how fast a service provider is in delivering a service. Service throughput is “the total time it takes for a provider to deliver one in- stance of a service”, according to a delivery mentor in Tieto. However, the timing for delivering a specific ser- vice is not a constant number and lots of factors affect it such as third party contributions, market dilemmas, and company political issues. Due to the presence of these factors, of which most are not under provider’s control, estimating the “time” for delivering a service is problem- atic. So it is more appropriate if the causes that affect “time” negatively will be distinguished. By considering this point of view, the more the negative causes control, the higher the service throughput will b e. In ord e r to limit the boundaries of affecting issues in the context of this study, the authors focus on AM side of the matter and particularly service desk. From Change Management ser- vice perspective, the number of emergency changes (hot fixes) is one of the factors affecting service throughput. According to Service Desk service, a reported incident becomes an emergency change and enters the change management process if it cannot be solved in incident management and problem management processes, or, the incident is solved temporary but the root cause has not been identified yet [16]. Therefore, the service through- put can be calculated by means of Equation (11) as fol- lows. As it is approved by several interviewed practitioners and noticed from the statistics of a typical service desk that the service provider delivers to customer X, dimin- ishing numbers of incidents leading to emergency changes will augment the service throughput and, con- sequently, the service performance will be increased. Service Throughput Index helps both the provider and customer to measure the number of emergency changes and compare them with the same number from the pre- vious period (month, year, etc.). Downward percentage shows the higher service throughput and better service performance. 5. Service Value Agreement In order to organize the service value metrics and make them easy to follow and understandable in the negotia- tion process, the authors group the above identified added values along with service value metrics in three major categories namely: service performance, process efficiency, and capability which constitute the building blocks of an SVA. The division is made based on the nature of values and the objectives that are represented by them. Table 3 illustrates the SVA including clarified requirements, added values, together with the corre- sponding service v alue metrics. No.ofproactive planned changesinitiated by provider Change ManagementInnovationIndex1Totalno.ofplannedchanges (10) o. ofemergancychangeshotfixesinperiodX Service ThroughtputIndex o. ofemergancychangeshotfixesinperiodY (11) Copyright © 2012 SciRes. JSSM 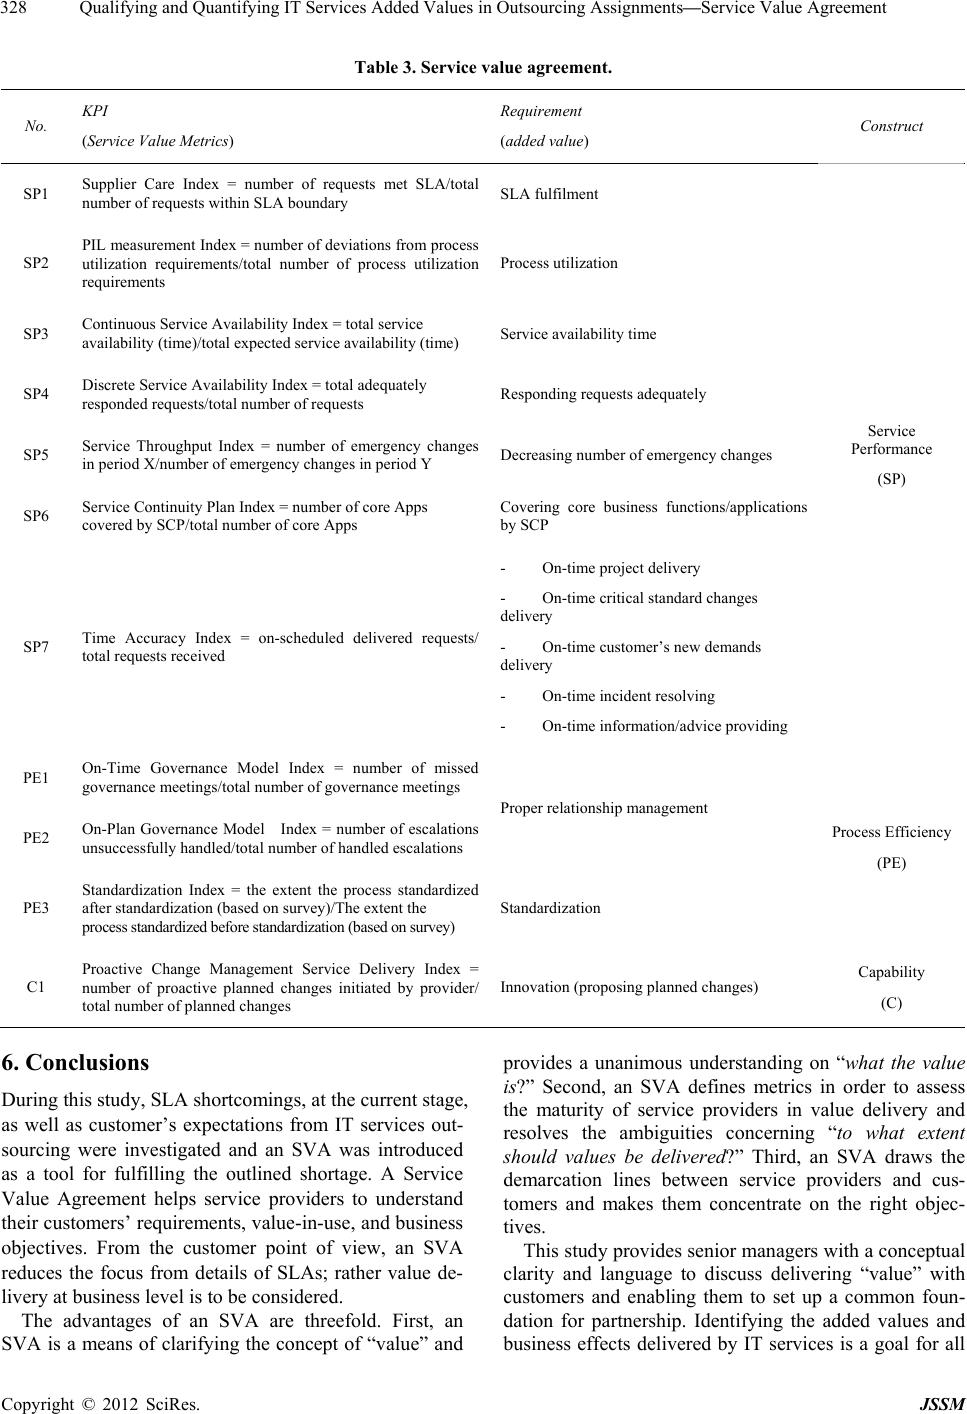 Qualifying and Quantifying IT Services Added Values in Outsourcing Assignments—Service Value Agreement 328 Table 3. Service value agreement. No. KPI (Service Value Metrics) Requirement (added value) Construct SP1 Supplier Care Index = number of requests met SLA/total number of re q u ests within SLA boundary SLA fulfilment SP2 PIL measurement Index = number of deviations from process utilization requirements/total number of process utilization requirements Process utilization SP3 Continuous Service Availability Index = total service availability (time)/total expected service availability (time) Service availabili ty time SP4 Discrete Service Availability Index = total adequately responded requests/total number of requests Responding requests adequat ely SP5 Service Throughput Index = number of emergency changes in period X/number of emergency changes in period Y Decreasing number of e mergency c hanges SP6 Service Continuity Plan Index = number of core Apps covered by SCP /total number of core Apps Covering core business functions/applications by SCP SP7 Time Accuracy Index = on-scheduled delivered requests/ total requests received - On-time project delivery - On-time critical standard changes delivery - On-time customer’s new demands delivery - On-time in ci d en t r e so l vi n g - On-time information/advice providing Service Performance (SP) PE1 On-Time Governance Model Index = number of missed governance meetings/total number of governance m e etings PE2 On-Plan Governance Model Index = number of escalations unsuccessfully handled/total number of handled esc alations Proper relationship management PE3 Standardization Index = the extent the process standardized after standardization (based on survey)/The extent the process standar dized before sta ndardiza tion (based on surve y) Standardization Process Efficiency (PE) C1 Proactive Change Management Service Delivery Index = number of proactive planned changes initiated by provider/ total number of planned changes Innovation (pr oposing planned ch anges) Capability (C) 6. Conclusions During this study, SLA sh or tcomings, at the current stage, as well as customer’s expectations from IT services out- sourcing were investigated and an SVA was introduced as a tool for fulfilling the outlined shortage. A Service Value Agreement helps service providers to understand their customers’ requirements, value-in-use, and business objectives. From the customer point of view, an SVA reduces the focus from details of SLAs; rather value de- livery at business level is to be considered. The advantages of an SVA are threefold. First, an SVA is a means of clarifying the concept of “value” and provides a unanimous understanding on “what the value is?” Second, an SVA defines metrics in order to assess the maturity of service providers in value delivery and resolves the ambiguities concerning “to what extent should values be delivered?” Third, an SVA draws the demarcation lines between service providers and cus- tomers and makes them concentrate on the right objec- tives. This study provides senior managers with a conceptual clarity and language to discuss delivering “value” with customers and enabling them to set up a common foun- dation for partnership. Identifying the added values and business effects delivered by IT services is a goal for all Copyright © 2012 SciRes. JSSM 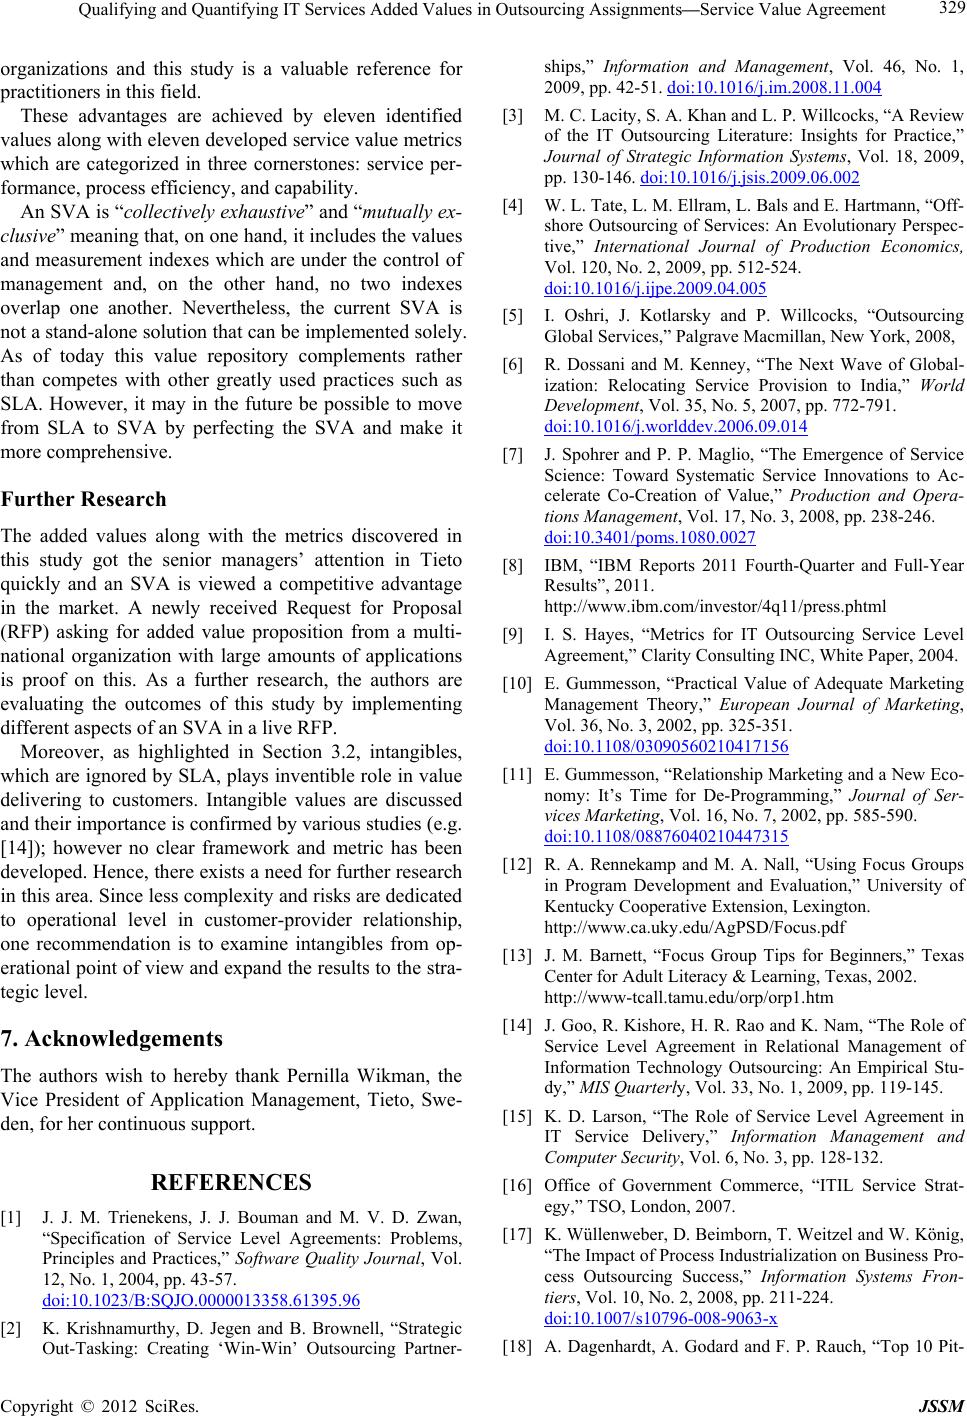 Qualifying and Quantifying IT Services Added Values in Outsourcing Assignments—Service Value Agreement 329 organizations and this study is a valuable reference for practitioners in this field. These advantages are achieved by eleven identified values along with eleven developed service value metrics which are categorized in three cornerstones: service per- formance, process efficiency, and capability. An SVA is “collectively exhaustive” and “mutually ex- clusive” meaning that, on one hand, it includes the values and measurement indexes which are under the control of management and, on the other hand, no two indexes overlap one another. Nevertheless, the current SVA is not a stand-alone solu tion th at can be implemented solely. As of today this value repository complements rather than competes with other greatly used practices such as SLA. However, it may in the future be possible to move from SLA to SVA by perfecting the SVA and make it mor e comprehens ive. Further Research The added values along with the metrics discovered in this study got the senior managers’ attention in Tieto quickly and an SVA is viewed a competitive advantage in the market. A newly received Request for Proposal (RFP) asking for added value proposition from a multi- national organization with large amounts of applications is proof on this. As a further research, the authors are evaluating the outcomes of this study by implementing different aspects of an SVA in a live RFP. Moreover, as highlighted in Section 3.2, intangibles, which are ignor ed by SLA, plays inventible role in value delivering to customers. Intangible values are discussed and their importance is confirmed by various studies (e.g. [14]); however no clear framework and metric has been developed. Hence, there exists a need for further research in this area. Since less complexity and risks are dedicated to operational level in customer-provider relationship, one recommendation is to examine intangibles from op- erational point of view and expand the results to the stra- tegic level. 7. Acknowledgements The authors wish to hereby thank Pernilla Wikman, the Vice President of Application Management, Tieto, Swe- den, for her continuous support. REFERENCES [1] J. J. M. Trienekens, J. J. Bouman and M. V. D. Zwan, “Specification of Service Level Agreements: Problems, Principles and Practices,” Software Quality Journal, Vol. 12, No. 1, 2004, pp. 43-57. doi:10.1023/B:SQJO.0000013358.61395.96 [2] K. Krishnamurthy, D. Jegen and B. Brownell, “Strategic Out-Tasking: Creating ‘Win-Win’ Outsourcing Partner- ships,” Information and Management, Vol. 46, No. 1, 2009, pp. 42-51. doi:10.1016/j.im.2008.11.004 [3] M. C. Lacity, S. A. Khan and L. P. Willcocks, “A Review of the IT Outsourcing Literature: Insights for Practice,” Journal of Strategic Information Systems, Vol. 18, 2009, pp. 130-146. doi:10.1016/j.jsis.2009.06.002 [4] W. L. Tate, L. M. Ellram, L. Bals and E. Hartmann, “Off- shore Outsourcing of Services: An Evolutionary Perspec- tive,” International Journal of Production Economics, Vol. 120, No. 2, 2009, pp. 512-524. doi:10.1016/j.ijpe.2009.04.005 [5] I. Oshri, J. Kotlarsky and P. Willcocks, “Outsourcing Global Services,” Palgrave Macmillan, New York, 2008, [6] R. Dossani and M. Kenney, “The Next Wave of Global- ization: Relocating Service Provision to India,” World Development, Vol. 35, No. 5, 2007, pp. 772-791. doi:10.1016/j.worlddev.2006.09.014 [7] J. Spohrer and P. P. Maglio, “The Emergence of Service Science: Toward Systematic Service Innovations to Ac- celerate Co-Creation of Value,” Production and Opera- tions Management, Vol. 17, No. 3, 2008, pp. 238-246. doi:10.3401/poms.1080.0027 [8] IBM, “IBM Reports 2011 Fourth-Quarter and Full-Year Results”, 2011. http://www.ibm.com/investor/4q11/press.phtml [9] I. S. Hayes, “Metrics for IT Outsourcing Service Level Agreement,” Clarity Consulting INC, White Paper, 2004. [10] E. Gummesson, “Practical Value of Adequate Marketing Management Theory,” European Journal of Marketing, Vol. 36, No. 3, 2002, pp. 325-351. doi:10.1108/03090560210417156 [11] E. Gummesson, “Relationship Marketing and a New Eco- nomy: It’s Time for De-Programming,” Journal of Ser- vices Marketing, Vol. 16, No. 7, 2002, pp. 585-590. doi:10.1108/08876040210447315 [12] R. A. Rennekamp and M. A. Nall, “Using Focus Groups in Program Development and Evaluation,” University of Kentucky Cooperative Extension, Lexington. http://www.ca.uky.edu/AgPSD/Focus.pdf [13] J. M. Barnett, “Focus Group Tips for Beginners,” Texas Center for Adult Literacy & Learning, Texas, 2002. http://www-tcall.tamu.edu/orp/orp1.htm [14] J. Goo, R. Kishore, H. R. Rao and K. Nam, “The Role of Service Level Agreement in Relational Management of Information Technology Outsourcing: An Empirical Stu- dy,” MIS Quarterly, Vol. 33, No. 1, 2009, pp. 119-145. [15] K. D. Larson, “The Role of Service Level Agreement in IT Service Delivery,” Information Management and Computer Security, Vol. 6, No. 3, pp. 128-132. [16] Office of Government Commerce, “ITIL Service Strat- egy,” TSO, London, 2007. [17] K. Wüllenweber, D. Beimborn, T. Weitzel and W. König, “The Impact of Process Industrialization on Business Pro- cess Outsourcing Success,” Information Systems Fron- tiers, Vol. 10, No. 2, 2008, pp. 211-224. doi:10.1007/s10796-008-9063-x [18] A. Dagenhardt, A. Godard and F. P. Rauch, “Top 10 Pit- Copyright © 2012 SciRes. JSSM  Qualifying and Quantifying IT Services Added Values in Outsourcing Assignments—Service Value Agreement Copyright © 2012 SciRes. JSSM 330 falls of Application Management Services,” Siemens IT Solutions and Services, White Paper, Munich, 2010. [19] P. Matthyssens and K. Vandenbempt, “Moving from Ba- sic Offering to Value-Added Solutions: Strategies and Alignment,” Industrial Marketing Management, Vol. 37, No. 3, 2008, pp. 316-328. doi:10.1016/j.indmarman.2007.07.008 [20] E. K. Macdonald, H. Wilson, V. Martinez and A. Toosi, “Assessing Value-in-Use: A Conceptual Framework and Exploratory Study,” Industrial Marketing Management, Vol. 40, No. 5, 2011, pp. 671-682. doi:10.1016/j.indmarman.2011.05.006 [21] E. Brynolfsson and S. Yang, “Information Technology and Productivity: A Review of the Literature,” Advances in Computers, Vol. 43, 1996, pp. 179-214. doi:10.1016/S0065-2458(08)60644-0 [22] W. Ulaga and A. Eggert, “Value-Based Differentiation in Business Relationships: Gaining and Sustaining Key Sup- plier Status,” Journal of Marketing, Vol. 70, No. 1, 2006, pp. 119-136. doi:10.1509/jmkg.2006.70.1.119 [23] S. L. Vargo, P. P. Maglio and M. A. Akaka, “On Value and Value Co-Creation: A Service Systems and Service Logic Perspective,” European Management Journal, Vol. 26, No. 3, 2008, pp. 145-152. doi:10.1016/j.emj.2008.04.003 [24] K. Moyle, “Total Cost of Ownership and Total Value of Ownership,” In: J. Voogt and G. Knezek, Eds., Interna- tional Handbook of Information Technology in Primary and Secondary Education, Springer Science and Business Media, Berlin, 2008, pp. 615-631. doi:10.1007/978-0-387-73315-9_36 [25] K. Möller, “Role of Competence in Creating Customer Value: A Value-Creation Logic Approach,” Industrial Marketing Management, Vol. 35, No. 8, 2006, pp. 913- 924. doi:10.1016/j.indmarman.2006.04.005 [26] K. Hurkens and F. Wynstra, “The Concept ‘Total Value of Ownership’: A Case Study Approach,” Erasmus Re- search Institute of Management, Rotterdam, 2004, pp. 51- 62. [27] Office of Government Commerce, “ITIL Service Opera- tion,” TSO, London, 2007. [28] K. C. So and J. S. Song, “Theory and Methodology: Price, Delivery Time Guarantees and Capacity Selection,” Eu- ropean Journal of Operational Research, Vol. 111, No. 1, 1998, pp. 28-49. doi:10.1016/S0377-2217(97)00314-7 [29] C. Bozarth, R. Handfield and A. Das, “Stages of Global Sourcing Strategy Evolution: An Exploratory Study,” Journal of Operations Management, Vol. 16, No. 2-3, 1998, pp. 241-255. doi:10.1016/S0272-6963(97)00040-5 [30] M. Smith, “The Gartner Business Value Model: A Frame- work for Measuring Business Performance,” Gartner Inc, Stamford, 2010. [31] C. Rosenkranz, S. Seidel, J. Mendling, M. Schaefermeyer and J. Recker, “Toward a Framework for Business Pro- cess Standardization,” 5th International Workshop in Bu- siness Process Design, Springer, Berlin, 2010, pp. 43-53. [32] M. Schäfermeyer and C. Rosenkranz, “To Standardize or Not to Standardize? Understanding the Effect of Business Process Complexity on Business Process Standardiza- tion,” 19th European Conference on Information Systems (ECIS2011), Helsinki, 9-11 June 2011. [33] H. V. Leijen, “The Role of Contextuality in Process Stan- dardization,” In: W. Baets, Ed., Knowledge Management and Management Learning: Extending the Horizons of Knowledge-Based Management (Integrated Series in In- formation Systems), Springer Science and Business Media, Berlin, 2005, pp. 251-286. [34] R. S. Kaplan and D. P. Norton, “Measuring the Strategic Readiness of Intangible Assets,” Harvard Business Re- view, Vol. 82, No. 2, 2004, pp. 52-63. [35] B. Martorelli, E. Rose and C. F. Ross, “Application Out- sourcing Clients are Satisfied, but Want More,” Forrester, Cambridge, 2010. [36] ISACA, “COBIT 5: The Framework”, ISACA, Rolling Meadows, 2011. [37] Tieto, “Service Governance—Our Key to Sourcing Rela- tionship”, Internal Documentations, Stockholm, 2012. [38] D. A. Griffith, N. Harmancioglu and C. Droge, “Gover- nance Decisions for the Offshore Outsourcing of New Product Development in Technology Intensive Market,” Journal of World Business, Vol. 44, 2009, pp. 217-224. doi:10.1016/j.jwb.2008.08.007 [39] Z. Shadid, G. Boyd and R. Brisebois, “What Is IT Gov- ernance? And Why Is It Important for the IS Auditor?” INTO IT, Toronto, 2008. [40] A. Paschke and E. Schnappinger-Gerull, “A Categoriz- ation Scheme for SLA Metrics,” Internet-Based Informa- tion Systems, Passau, 2006, pp. 25-40. [41] Accenture, “Business Process Automation Excellence with Pegasystems Technology,” 2012. http://www.accenture.com/us-en/Pages/service-automatio n-excellence-pegasystems-technology.aspx [42] Office of Government Commerce, “ITIL Service Transi- tion,” TSO, London, 2007.
|