Paper Menu >>
Journal Menu >>
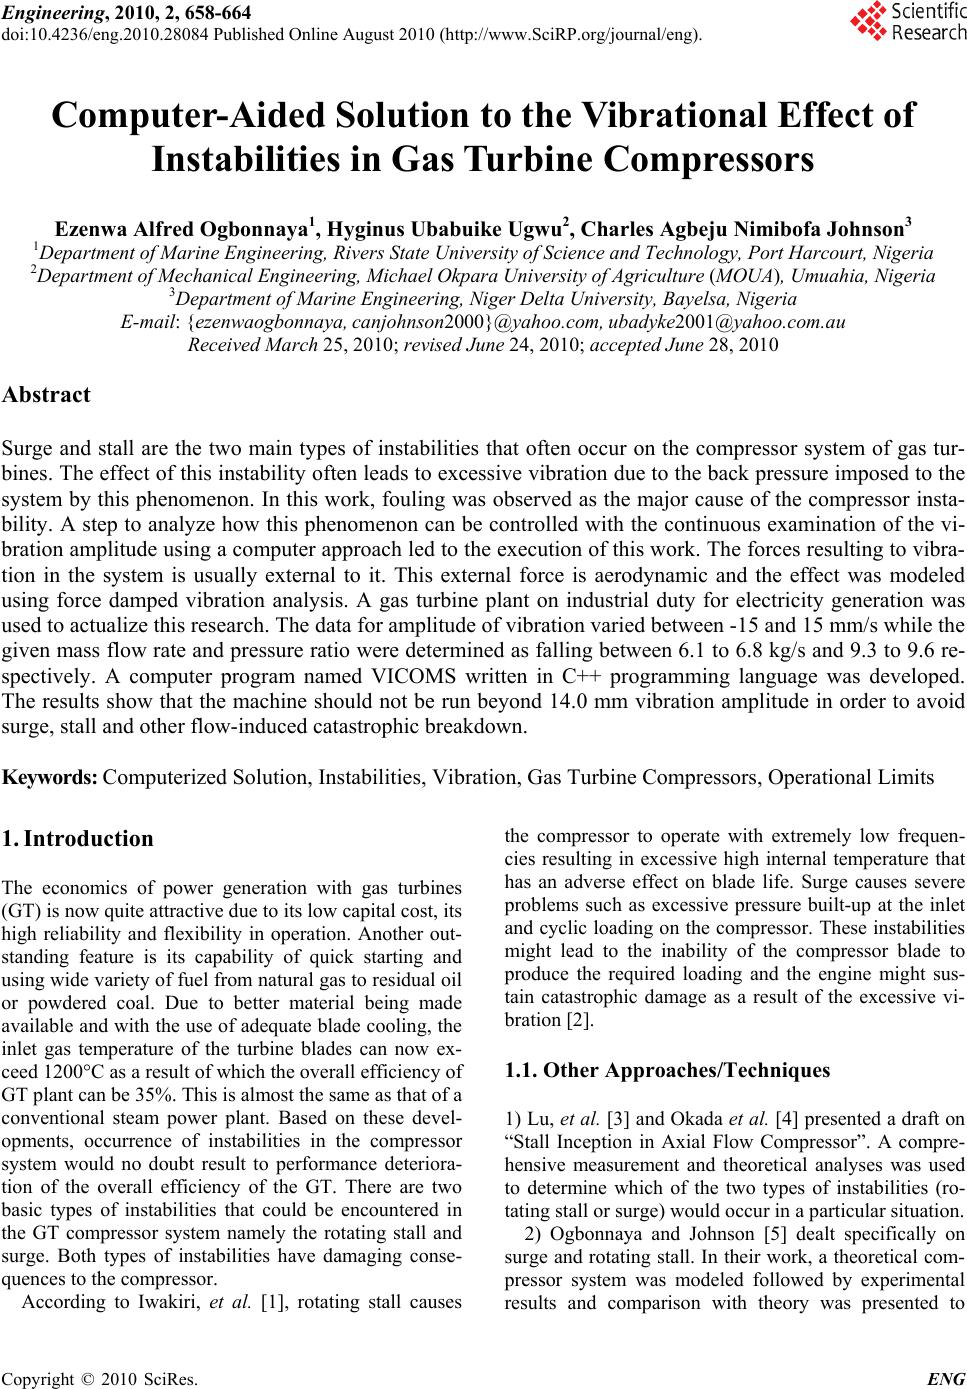 Engineering, 2010, 2, 658-664 doi:10.4236/eng.2010.28084 Published Online August 2010 (http://www.SciRP.org/journal/eng). Copyright © 2010 SciRes. ENG Computer-Aided Solution to the Vibrational Effect of Instabilities in Gas Turbine Compressors Ezenwa Alfred Ogbonnaya1, Hyginus Ubabuike Ugwu2, Charles Agbeju Nimibofa Johnson3 1Department of Marine Engineering, Rivers State University of Science and Technology, Port Harcourt, Nigeria 2Department of Mechanical Engineering, Michael Okpara University of Agriculture (MOUA), Umuahia, Nigeria 3Department of Marine Engineering, Niger Delta University, Bayelsa, Nigeria E-mail: {ezenwaogbonnaya, canjohnson2000}@yahoo.com, ubadyke2001@yahoo.com.au Received March 25, 2010; revised June 24, 2010; accepted June 28, 2010 Abstract Surge and stall are the two main types of instabilities that often occur on the compressor system of gas tur- bines. The effect of this instability often leads to excessive vibration due to the back pressure imposed to the system by this phenomenon. In this work, fouling was observed as the major cause of the compressor insta- bility. A step to analyze how this phenomenon can be controlled with the continuous examination of the vi- bration amplitude using a computer approach led to the execution of this work. The forces resulting to vibra- tion in the system is usually external to it. This external force is aerodynamic and the effect was modeled using force damped vibration analysis. A gas turbine plant on industrial duty for electricity generation was used to actualize this research. The data for amplitude of vibration varied between -15 and 15 mm/s while the given mass flow rate and pressure ratio were determined as falling between 6.1 to 6.8 kg/s and 9.3 to 9.6 re- spectively. A computer program named VICOMS written in C++ programming language was developed. The results show that the machine should not be run beyond 14.0 mm vibration amplitude in order to avoid surge, stall and other flow-induced catastrophic breakdown. Keywords: Computerized Solution, Instabilities, Vibration, Gas Turbine Compressors, Operational Limits 1. Introduction The economics of power generation with gas turbines (GT) is now quite attractive due to its low capital cost, its high reliability and flexibility in operation. Another out- standing feature is its capability of quick starting and using wide variety of fuel from natural gas to residual oil or powdered coal. Due to better material being made available and with the use of adequate blade cooling, the inlet gas temperature of the turbine blades can now ex- ceed 1200°C as a result of which the overall efficiency of GT plant can be 35%. This is almost the same as that of a conventional steam power plant. Based on these devel- opments, occurrence of instabilities in the compressor system would no doubt result to performance deteriora- tion of the overall efficiency of the GT. There are two basic types of instabilities that could be encountered in the GT compressor system namely the rotating stall and surge. Both types of instabilities have damaging conse- quences to the compressor. According to Iwakiri, et al. [1], rotating stall causes the compressor to operate with extremely low frequen- cies resulting in excessive high internal temperature that has an adverse effect on blade life. Surge causes severe problems such as excessive pressure built-up at the inlet and cyclic loading on the compressor. These instabilities might lead to the inability of the compressor blade to produce the required loading and the engine might sus- tain catastrophic damage as a result of the excessive vi- bration [2]. 1.1. Other Approaches/Techniques 1) Lu, et al. [3] and Okada et al. [4] presented a draft on “Stall Inception in Axial Flow Compressor”. A compre- hensive measurement and theoretical analyses was used to determine which of the two types of instabilities (ro- tating stall or surge) would occur in a particular situation. 2) Ogbonnaya and Johnson [5] dealt specifically on surge and rotating stall. In their work, a theoretical com- pressor system was modeled followed by experimental results and comparison with theory was presented to 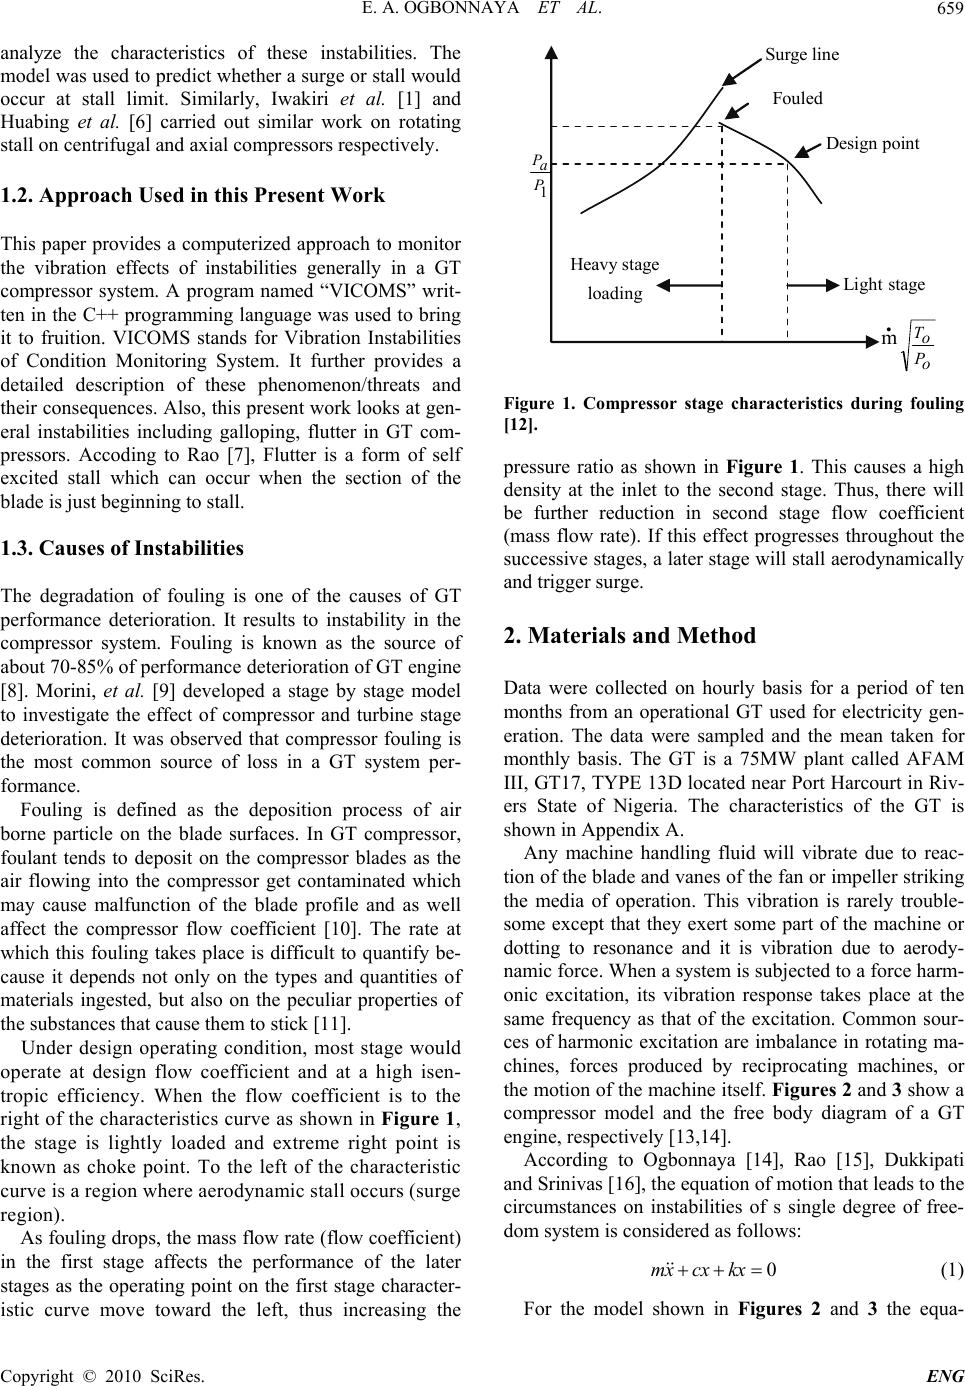 E. A. OGBONNAYA ET AL. Copyright © 2010 SciRes. ENG 659 analyze the characteristics of these instabilities. The model was used to predict whether a surge or stall would occur at stall limit. Similarly, Iwakiri et al. [1] and Huabing et al. [6] carried out similar work on rotating stall on centrifugal and axial compressors respectively. 1.2. Approach Used in this Present Work This paper provides a computerized approach to monitor the vibration effects of instabilities generally in a GT compressor system. A program named “VICOMS” writ- ten in the C++ programming language was used to bring it to fruition. VICOMS stands for Vibration Instabilities of Condition Monitoring System. It further provides a detailed description of these phenomenon/threats and their consequences. Also, this present work looks at gen- eral instabilities including galloping, flutter in GT com- pressors. Accoding to Rao [7], Flutter is a form of self excited stall which can occur when the section of the blade is just beginning to stall. 1.3. Causes of Instabilities The degradation of fouling is one of the causes of GT performance deterioration. It results to instability in the compressor system. Fouling is known as the source of about 70-85% of performance deterioration of GT engine [8]. Morini, et al. [9] developed a stage by stage model to investigate the effect of compressor and turbine stage deterioration. It was observed that compressor fouling is the most common source of loss in a GT system per- formance. Fouling is defined as the deposition process of air borne particle on the blade surfaces. In GT compressor, foulant tends to deposit on the compressor blades as the air flowing into the compressor get contaminated which may cause malfunction of the blade profile and as well affect the compressor flow coefficient [10]. The rate at which this fouling takes place is difficult to quantify be- cause it depends not only on the types and quantities of materials ingested, but also on the peculiar properties of the substances that cause them to stick [11]. Under design operating condition, most stage would operate at design flow coefficient and at a high isen- tropic efficiency. When the flow coefficient is to the right of the characteristics curve as shown in Figure 1, the stage is lightly loaded and extreme right point is known as choke point. To the left of the characteristic curve is a region where aerodynamic stall occurs (surge region). As fouling drops, the mass flow rate (flow coefficient) in the first stage affects the performance of the later stages as the operating point on the first stage character- istic curve move toward the left, thus increasing the Heavy stage loading m o P o T . Li g ht sta g e Design point Surge line 1 P a P Fouled Figure 1. Compressor stage characteristics during fouling [12]. pressure ratio as shown in Figure 1. This causes a high density at the inlet to the second stage. Thus, there will be further reduction in second stage flow coefficient (mass flow rate). If this effect progresses throughout the successive stages, a later stage will stall aerodynamically and trigger surge. 2. Materials and Method Data were collected on hourly basis for a period of ten months from an operational GT used for electricity gen- eration. The data were sampled and the mean taken for monthly basis. The GT is a 75MW plant called AFAM III, GT17, TYPE 13D located near Port Harcourt in Riv- ers State of Nigeria. The characteristics of the GT is shown in Appendix A. Any machine handling fluid will vibrate due to reac- tion of the blade and vanes of the fan or impeller striking the media of operation. This vibration is rarely trouble- some except that they exert some part of the machine or dotting to resonance and it is vibration due to aerody- namic force. When a system is subjected to a force harm- onic excitation, its vibration response takes place at the same frequency as that of the excitation. Common sour- ces of harmonic excitation are imbalance in rotating ma- chines, forces produced by reciprocating machines, or the motion of the machine itself. Figures 2 and 3 show a compressor model and the free body diagram of a GT engine, respectively [13,14]. According to Ogbonnaya [14], Rao [15], Dukkipati and Srinivas [16], the equation of motion that leads to the circumstances on instabilities of s single degree of free- dom system is considered as follows: 0mx cx kx (1) For the model shown in Figures 2 and 3 the equa- 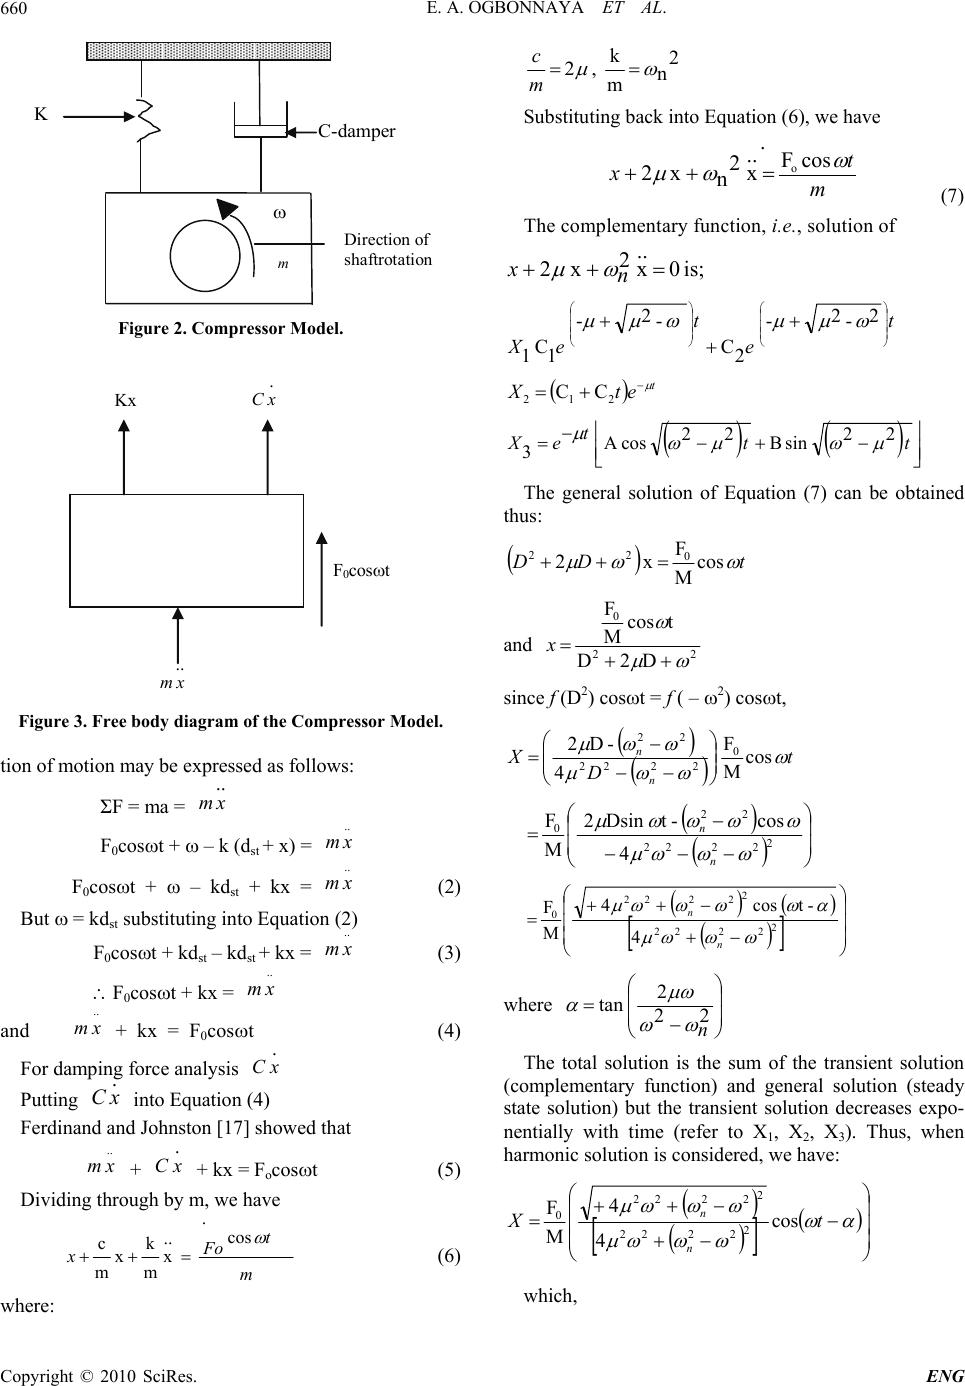 E. A. OGBONNAYA ET AL. Copyright © 2010 SciRes. ENG 660 K C-damper Direction of shaftrotation m Figure 2. Compressor Model. . xC Kx F 0 cost .. xm Figure 3. Free body diagram of the Compressor Model. tion of motion may be expressed as follows: ΣF = ma = .. xm F0cost + – k (dst + x) = .. xm F0cost + – kdst + kx = .. xm (2) But = kdst substituting into Equation (2) F0cost + kdst – kdst + kx = .. xm (3) F0cost + kx = .. xm and .. xm + kx = F0cost (4) For damping force analysis . x C Putting . x C into Equation (4) Ferdinand and Johnston [17] showed that .. xm + . xC + kx = Focost (5) Dividing through by m, we have . cos .. x m k x m c m t Fo x (6) where: 2 n m k , 2 m c Substituting back into Equation (6), we have .cosF .. x 2 n x 2 o m t x (7) The complementary function, i.e., solution of is; 0 .. x 2 x 2 n x t e t eX 2 - 2 - 2 C - 2 - 1 C 1 t etX 212 C C tt t eX 22 sin B 22 cosA 3 The general solution of Equation (7) can be obtained thus: tDD cos M F x 20 22 and 22 0 D2 D tcos M F x since f (D2) cost = f ( – 2) cost, t D X n n cos M F 4 - D2 0 2222 22 4 cos -t Dsin 2 M F 2 2222 22 0 n n 2 2222 2 2222 0 4 -t cos 4 M F n n where 22 2 tan n The total solution is the sum of the transient solution (complementary function) and general solution (steady state solution) but the transient solution decreases expo- nentially with time (refer to X1, X2, X3). Thus, when harmonic solution is considered, we have: tX n ncos 4 4 M F 2 2222 2 2222 0 which, 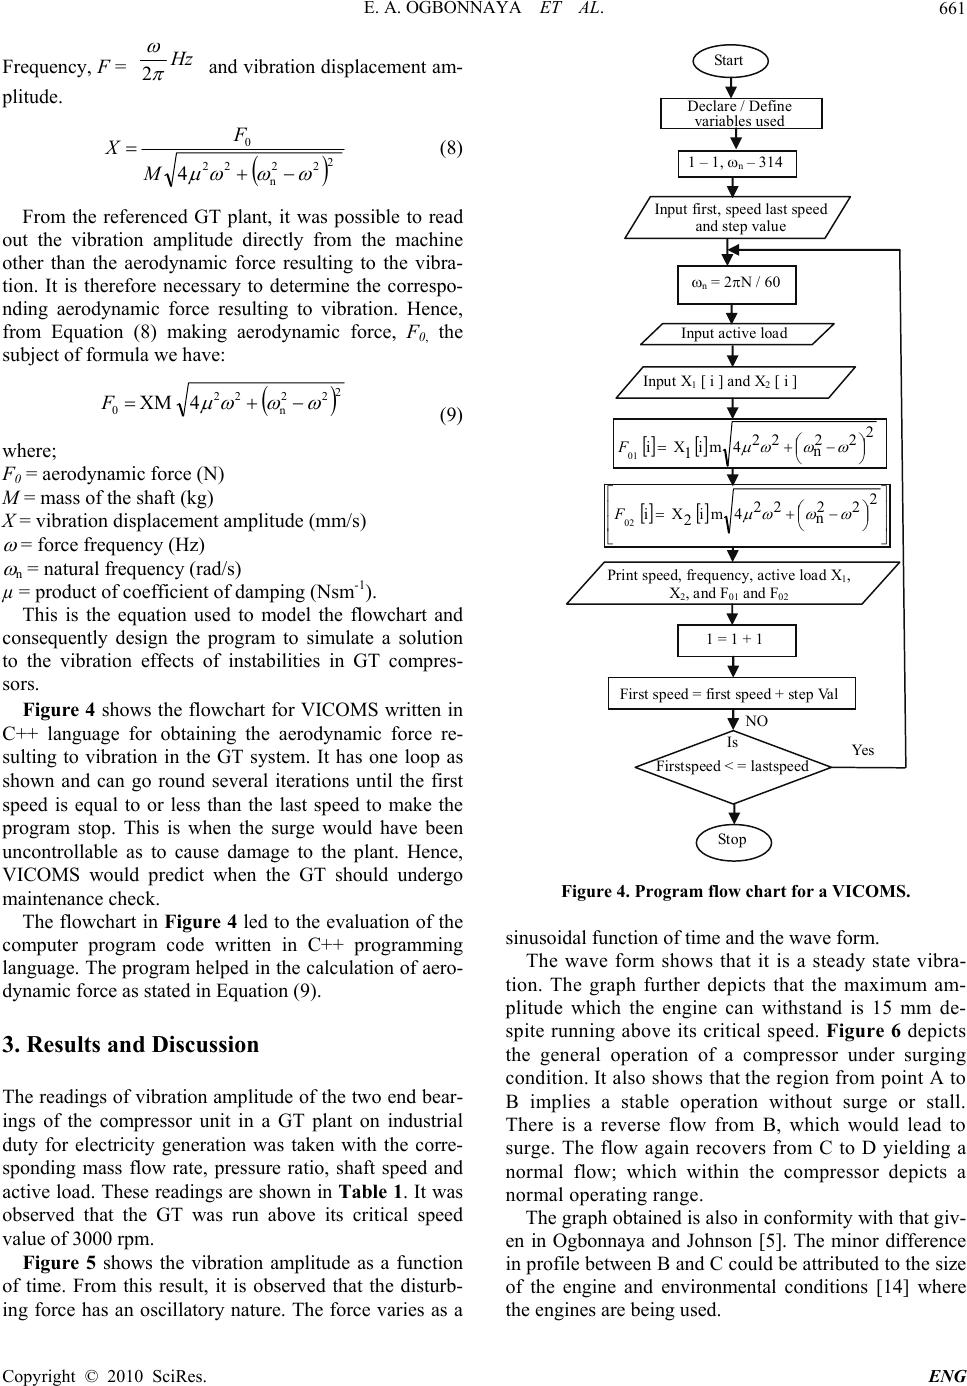 E. A. OGBONNAYA ET AL. Copyright © 2010 SciRes. ENG 661 Frequency, F = Hz 2 and vibration displacement am- plitude. 42 22 n 22 0 M F X (8) From the referenced GT plant, it was possible to read out the vibration amplitude directly from the machine other than the aerodynamic force resulting to the vibra- tion. It is therefore necessary to determine the correspo- nding aerodynamic force resulting to vibration. Hence, from Equation (8) making aerodynamic force, F0, the subject of formula we have: 2 22 n 22 0 4 XM F (9) where; F0 = aerodynamic force (N) M = mass of the shaft (kg) X = vibration displacement amplitude (mm/s) = force frequency (Hz) n = natural frequency (rad/s) µ = product of coefficient of damping (Nsm-1). This is the equation used to model the flowchart and consequently design the program to simulate a solution to the vibration effects of instabilities in GT compres- sors. Figure 4 shows the flowchart for VICOMS written in C++ language for obtaining the aerodynamic force re- sulting to vibration in the GT system. It has one loop as shown and can go round several iterations until the first speed is equal to or less than the last speed to make the program stop. This is when the surge would have been uncontrollable as to cause damage to the plant. Hence, VICOMS would predict when the GT should undergo maintenance check. The flowchart in Figure 4 led to the evaluation of the computer program code written in C++ programming language. The program helped in the calculation of aero- dynamic force as stated in Equation (9). 3. Results and Discussion The readings of vibration amplitude of the two end bear- ings of the compressor unit in a GT plant on industrial duty for electricity generation was taken with the corre- sponding mass flow rate, pressure ratio, shaft speed and active load. These readings are shown in Table 1. It was observed that the GT was run above its critical speed value of 3000 rpm. Figure 5 shows the vibration amplitude as a function of time. From this result, it is observed that the disturb- ing force has an oscillatory nature. The force varies as a Start Declare / Define variables used 1 – 1, n – 314 Input first, speed last speed and step value n = 2N / 60 Input active load Input X 1 [ i ] and X 2 [ i ] 2 22 n 22 4m i 1 X i 01 F 2 22 n 22 4m i 2 X i 02 F Print speed, frequency, active load X 1 , X 2 , and F 01 and F 02 1 = 1 + 1 First speed = first speed + step Val Is Firstspeed < = lastspeed Stop Yes N O Figure 4. Program flow chart for a VICOMS. sinusoidal function of time and the wave form. The wave form shows that it is a steady state vibra- tion. The graph further depicts that the maximum am- plitude which the engine can withstand is 15 mm de- spite running above its critical speed. Figure 6 depicts the general operation of a compressor under surging condition. It also shows that the region from point A to B implies a stable operation without surge or stall. There is a reverse flow from B, which would lead to surge. The flow again recovers from C to D yielding a normal flow; which within the compressor depicts a normal operating range. The graph obtained is also in conformity with that giv- en in Ogbonnaya and Johnson [5]. The minor difference in profile between B and C could be attributed to the size of the engine and environmental conditions [14] where the engines are being used.  E. A. OGBONNAYA ET AL. Copyright © 2010 SciRes. ENG 662 Table 1. Reading showing the data taken from AFAM III, GT 17, TYPE 13D. m (kg/s) rp Shaft Speed (RPM) Active Load Fre- quency (Hz) Vibration Amplitude (mm/sec) Brg1Brg.2 6.49 9.30 3005 50 51.2 4.8 −15.0 6.7 9.40 3053 50 51.3 4.8 15.0 6.2 9.30 3051 50 51.2 4.6 −15.0 6.8 9.50 3080 50 51.3 4.9 10.0 6.4 9.60 3063 50 51.0 4.9 15.0 6.3 9.50 3063 50 50.4 5.1 −15.0 6.1 9.40 3074 45 51.1 5.1 15.0 6.3 9.50 3076 40 51.3 5.3 7.0 6.5 9.40 3077 40 56.7 5.0 −15.0 6.66 9.40 3081 36 51.5 5.1 6.40 20 15 10 5 0 -5 -10 -20 Amplitude of Vibration (mm) Time in Hours Figure 5. Amplitude of vibration as a function of time. 3090 3080 3070 3060 3050 3040 3030 3020 3010 3000 Compressor Speed (rpm) 6 6.2 6.4 6.6 6.8 7 Mass flow Rate (kg/sec) Figure 6. Speed against flow rate. This analysis shows that running the compressor within the regions of B and C should be avoided. This region would correspond to speeds between 3051 and 3053 rpm. 4. Conclusions A work has been carried out on the computerized solu- tion of instabilities in GT compressor. The test engine is AFAM III, GT 17, TYPE 13D. The compressor system suffered surge and stall, which resulted to instabilities in the test engine due to fouling. It was shown that fouling leads to the stuffing of the compressor stages. This also results in the reduction of the compressor surge margin and dramatic instability of the operation of the whole GT compressor system, cul- minating to vibration. The mass flow rate, pressure ratio, shaft speed and vi- bration amplitude in the system were collected from the two end bearings of the compressor system in the GT plant. A model was consequently developed to analyze the data collected in order to determine the correspond- ing aerodynamic force causing vibration in the system. The mathematical model was used to run a program code named VICOMS written in C++ programming language. The results and the graph showed that the GT should not be run beyond 14 mm. 5. Acknowledgements The authors wishes to acknowledge the efforts of Messrs. Woji, John and Ebunuoha, Chigozie for their immense contributions to the success of this research project. They visited the thermal stations for the experimentations and data collection associated with this work. They are equally appreciative of the efforts of Mr. Jeffrey Mukoro and Chike in typeseting, proof-reading and editing the manuscript. 6. References [1] K. Iwakiri, M. Furukawa, S. Ibaraki and I. Tomita, “Unsteady and 3D Flow Phenomena in Transonic Centrifugal Compressor Impeller at Rotating Stall,” Pro- ceedings of ASME Turbo Expo, Orlando, Florida, 8-12 June 2009. www.teurbexpo.org [2] R. Kurz, “Surge Control Design System Design,” Pro- ceedings of ASME Turbo Expo, Orlando, Florida, 8-12 June 2009. www.teurbexpo.org [3] J.-L. Lu, W. Chu and K. Peng, “Numerical and Experi- mental Research of Stall Inception on Subsonic Axial Flow Compressor Rotor,” Journal of Aerospace Engi- neering, Vol. 48, No. 2, 2010, pp. 3-4. [4] T. Okada, A. Kawajiri, O. Yataka and O. Eisuke, “Stall Inception Process and Prospects for active Hub-Flap con- trol in Three Stage axial flow compressor,” Journal of Thermal Science, Co-Published with Springer-Varlag GmbH, 2008, pp. 4-8.  E. A. OGBONNAYA ET AL. Copyright © 2010 SciRes. ENG 663 [5] E. A. Ogbonaya, “Modeling Vibration-Based Faults in Rotor Shaft of Gas Turbine,” Ph.D. Dessertation, Depart- ment of Marine Engineering, Nigeria, 2004, pp. 20-22, 92-95, 180-181. [6] J. Huabing, Y. Wei, L. Yagun and L. Quishi, “Experi- mental Investigation of the Influence of Inlet Distortion on the Stall Inception in a Low Speed Axial Compre- ssor,” Proceedings of ASME Turbo Expo, Orlando, Flor- ida, 8-12 June 2009. www.Teurbex-po.org [7] S. S. Rao, “Mechanical Vibration,” 4th Edition, Pvt Ltd., Dorling Kingsley, Licenses of Pearson Education in South Asia. [8] C. B. Meher-Homji, M. Chaker and A. E. Brouley, “The Fouling of Axial Flow Compressor-Causes, Effects Sus- ceptibility and Sensitivity,” Proceedings of ASME Turbo Expo, Orlando, Florida, 8-12 June 2009. www.teurbexpo. org [9] M. Morini, M. Pinelli, P. R. Spina and M. Venturini, “Influence of Blade Deterioration on Compressor and Turbine Performance,” ASME Paper GT2008-50043, 2008. [10] T. W. Song, J. L. Sohn, T. S. Kim and T. R. O. Sung, “An Improved Analytic Model to Predict Fouling Phe- nomena in the Axial Flow Compressor of Gas Turbine Engines,” Proceedings of the International Gas Turbine Congress, Tokyo, 2-7 November 2003. [11] A. D. Mezherisky and A. V. Sudarev, “The Mechanism of Fouling and the Cleaning Technique in Application to Flow Parts of Power Generation Plant Compressors,” ASME Paper 90-GT-103, 1990. [12] C. B. Meher-Homji, “Gas Turbine Axial Compressor Fouling: A Unified Treatment of its Effect, Detection and Control,” International Journal of Turbo and Jet Engines, Vol. 9, No. 4, 1992, pp. 99-111. [13] E. D. Bently, C. T. Hatch and B. Grissom, “Fundamental of Rotating Machinery Diagnostics,” Bentley Pressurized Bearing Press, Minden, 2002. [14] E. A. Ogbonnaya and K. T. Johnson, “Modeling Vibra- tional Effects of Surge and Stall on GT Compressor,” Journal of International Research and Development In- stitute, 2010, pp. 142-146. [15] N. S. V. K. Rao, “Mechanical Vibration of Elastic Sys- tems,” 1st Edition, Asian Books Private Limited, Ma- havirlane, Vardhan House, Darya Lzanj, New Delhi, 2006. [16] R. V. Dukkipati and J. Srivinas, “Textbook of Mechani- cal Vibrations,” 3rd Edition, Prentice-Hall of India Pri- vate Limited, Connaught Circus, New Delhi, 2007. [17] P. B. Ferdinand and R. E. Jr. Johnston, “Vector Mechan- ics for Engineers: Static and Dynamic,” 6th Edition, McGraw-Hill Companies Inc., Boston, 2004.  E. A. OGBONNAYA ET AL. Copyright © 2010 SciRes. ENG 664 Appendix A: Characteristics of afam iii, gt 17, type 13d NAME OF EQUIPMENT:BROWN BOVIERI- SULZER TURBO MESCHINER; MANUFACTURER:ABB now ALSTOM TYPE: 13D CAPACITY: 75MW CRITICAL SPEED:3000RPM TYPE OF COMPRESSOR:VA 14017 DESISGN OF COMPRESSOR:AXIAL NO. OF STAGES:17 AIR PUMPING CAPABILITY:295 m3/s Nomenclature: M = Lumped mass of shaft (kg) X = Vibration displacement amplitude (mm) = 7 22 N = Cycle per minute F0 = Aerodynamic force (N) X = Vibration velocity amplitudes (mm/s) S = Boundary condition (varying between 1 and 2) n = Natural damped frequency (rad/s) W = Weight of the compressor rotor shaft (KN/kg) K = Shaft stiffness (KN/m) C = Damping coefficient (KN s/m) st = Elongation (m) = Frequency (Hz) α = Inlet flow angle o (degree) Eo = Cascade collection efficiency (%) rp = Pressure ratio m = Mass flow rate (kg/s) |