 Advances in Applied Sociology 2012. Vol.2, No.4, 303-308 Published Online December 2012 in SciRes (http://www.SciRP.org/journal/aasoci) http://dx.doi.org/10.4236/aasoci.2012.24039 Copyright © 2012 SciRes. 303 The State of Sexual Health in the US South: Opportunities and Challenges Yanyi K. Djamba1, Theresa C. Davidson2, Mosisa G. Aga3 1Center for Demographic Research and Department of Sociology, Auburn University at Montgomery, Montgomery, USA 2Department of Sociology, Samford University, Birmingham, USA 3Department of Mathematics, Auburn University at Montgomery, Montgomery, USA Email: ydjamba@aum.edu Received October 8th, 2012; revised November 10th, 2012; accepted November 23rd, 2012 This paper examines the socio-demographic characteristics and the state of sexual health in the US South, a region comprised of 10 states: Alabama, Georgia, Kentucky, Louisiana, Mississippi, North Carolina, South Carolina, Tennessee, Virginia, and West Virginia. The results show that the region is home to 18 percent of the US population, but its residents are statistically significantly more likely to have lower educational attainment and to live in poverty than other US residents. In addition, residents of the US South have poor sexual health compared to their counterparts living in other regions. Teenagers who live in the US South are more likely to get pregnant and have babies than teenagers in other regions. Likewise, the rates of Chlamydia and Gonorrhea among females age 15 - 19 were higher in the US South than elsewhere in the US. This poor sexual health cost the 10 US South states an estimated $2.3 billion in 2008. The paper concludes with a discussion of the sexual health challenges and opportunities in the US South in light of new federal funding streams that allow for the use of evidence-based approaches in sexual health programs. Keywords: Sexual Health; Sexually Transmitted Diseases; Teenage Births; Teenage Pregnancies; US Introduction The United States has the highest rates of teenage pregnancy and sexually transmitted diseases among all developed nations (Stanger-Hall & Hall, 2011). This is even more severe in the southern region of the US, which has higher rates of teenage pregnancy and teenage births; a higher percentage of babies of low birth weight; and higher rates of sexually transmitted infec- tions than other regions of the country. These conditions repre- sent poor sexual health. Sexual health is not simply about physical health, it also comprises fulfilling sexual relationships, the freedom to choose one’s mate, autonomy over one’s reproductive life, and much more. Sexual health affects both the individual and society. While it may be obvious that sexual health is important for an individual’s well-being, the impact of sexual health on society is often less apparent. For example, sexual health is tied to gender equality and therefore women’s access to key institu- tions such as education, housing, and the labor (Swedish Inter- national Development Cooperation Agency, SIDA, 2008). Thus, sexual health, while important for individuals, has broad consequences for communities and society at large. As stated on the Centers for Disease Control and Prevention’s (CDC) website, sexual health is: “··· a state of physical, emotional, mental and social well-being in relation to sexuality; it is not merely the absence of disease, dysfunction or infirmity. Sexual health requires a positive and respectful approach to sexuality and sexual rela- tionships, as well as the possibility of having pleasurable and safe sexual experiences, free of coercion, discrimination and violence (Centers for Disease Control and Prevention, CDC, 2011).” Sexuality is fundamental to being human, and the ability to fully develop one’s sexuality ought to be protected (SIDA, 2008). The World Association for Sexual Health incorporates in its Declaration of Sexual Rights two additional aims (World Association for Sexual Health, WAS, 2008). First is the right to sexual privacy. This ensures the right of individuals to make decisions about their sexuality and engage in intimate behavior as long as others’ rights are maintained. Second is the right to sexual information based upon scientific inquiry. Information about sex and sexuality should be produced through the scien- tific process, in an ethical manner, and disseminated appropri- ately (WAS, 2008). Rationale f or Sexual Heal t h The importance of sexual health cannot be overstated given the myriad of negative sexual outcomes that youth and young adults experience in the United States. These include sexually transmitted infections (STIs), HIV and AIDS, unintended pregnancy, and sexual abuse and violence. Identifying and pursuing a sexual health agenda should reduce the incidence of these negative outcomes. The Surgeon General’s 2001 “Call to Action to Promote Sexual Health and Responsible Sexual Behavior” reported the number of sexually transmitted infections per year at 12 million. More recently, the Guttmacher Institute (2009) reported ap- proximately 19 million new cases annually. Strikingly, roughly 65 million Americans have at least one STI, the most common 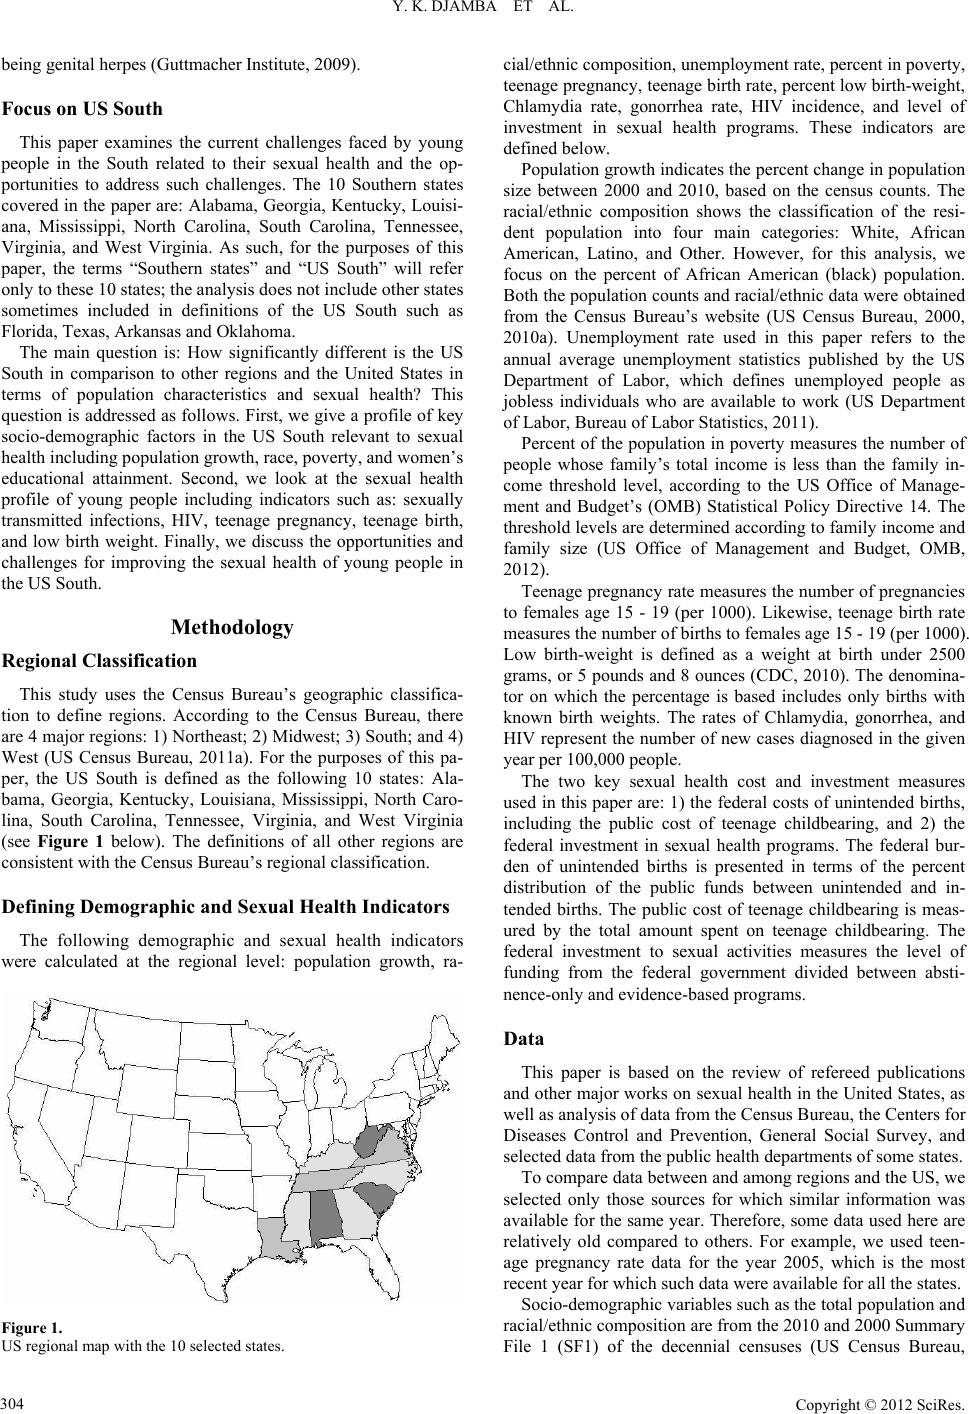 Y. K. DJAMBA ET AL. being genital herpes (Guttmacher Institute, 2009). Focus on US South This paper examines the current challenges faced by young people in the South related to their sexual health and the op- portunities to address such challenges. The 10 Southern states covered in the paper are: Alabama, Georgia, Kentucky, Louisi- ana, Mississippi, North Carolina, South Carolina, Tennessee, Virginia, and West Virginia. As such, for the purposes of this paper, the terms “Southern states” and “US South” will refer only to these 10 states; the analysis does not include other states sometimes included in definitions of the US South such as Florida, Texas, Arkansas and Oklahoma. The main question is: How significantly different is the US South in comparison to other regions and the United States in terms of population characteristics and sexual health? This question is addressed as follows. First, we give a profile of key socio-demographic factors in the US South relevant to sexual health including population growth, race, poverty, and women’s educational attainment. Second, we look at the sexual health profile of young people including indicators such as: sexually transmitted infections, HIV, teenage pregnancy, teenage birth, and low birth weight. Finally, we discuss the opportunities and challenges for improving the sexual health of young people in the US South. Methodology Regional Classification This study uses the Census Bureau’s geographic classifica- tion to define regions. According to the Census Bureau, there are 4 major regions: 1) Northeast; 2) Midwest; 3) South; and 4) West (US Census Bureau, 2011a). For the purposes of this pa- per, the US South is defined as the following 10 states: Ala- bama, Georgia, Kentucky, Louisiana, Mississippi, North Caro- lina, South Carolina, Tennessee, Virginia, and West Virginia (see Figure 1 below). The definitions of all other regions are consistent with the Census Bureau’s regional classification. Defining Demographic and Sexual Health Indicators The following demographic and sexual health indicators were calculated at the regional level: population growth, ra- Figure 1. US regional map with the 10 selected states. cial/ethnic composition, unemployment rate, percent in poverty, teenage pregnancy, teenage birth rate, percent low birth-weight, Chlamydia rate, gonorrhea rate, HIV incidence, and level of investment in sexual health programs. These indicators are defined below. Population growth indicates the percent change in population size between 2000 and 2010, based on the census counts. The racial/ethnic composition shows the classification of the resi- dent population into four main categories: White, African American, Latino, and Other. However, for this analysis, we focus on the percent of African American (black) population. Both the population counts and racial/ethnic data were obtained from the Census Bureau’s website (US Census Bureau, 2000, 2010a). Unemployment rate used in this paper refers to the annual average unemployment statistics published by the US Department of Labor, which defines unemployed people as jobless individuals who are available to work (US Department of Labor, Bureau of Labor Statistics, 2011). Percent of the population in poverty measures the number of people whose family’s total income is less than the family in- come threshold level, according to the US Office of Manage- ment and Budget’s (OMB) Statistical Policy Directive 14. The threshold levels are determined according to family income and family size (US Office of Management and Budget, OMB, 2012). Teenage pregnancy rate measures the number of pregnancies to females age 15 - 19 (per 1000). Likewise, teenage birth rate measures the number of births to females age 15 - 19 (per 1000). Low birth-weight is defined as a weight at birth under 2500 grams, or 5 pounds and 8 ounces (CDC, 2010). The denomina- tor on which the percentage is based includes only births with known birth weights. The rates of Chlamydia, gonorrhea, and HIV represent the number of new cases diagnosed in the given year per 100,000 people. The two key sexual health cost and investment measures used in this paper are: 1) the federal costs of unintended births, including the public cost of teenage childbearing, and 2) the federal investment in sexual health programs. The federal bur- den of unintended births is presented in terms of the percent distribution of the public funds between unintended and in- tended births. The public cost of teenage childbearing is meas- ured by the total amount spent on teenage childbearing. The federal investment to sexual activities measures the level of funding from the federal government divided between absti- nence-only and evidence-based programs. Data This paper is based on the review of refereed publications and other major works on sexual health in the United States, as well as analysis of data from the Census Bureau, the Centers for Diseases Control and Prevention, General Social Survey, and selected data from the public health departments of some states. To compare data between and among regions and the US, we selected only those sources for which similar information was available for the same year. Therefore, some data used here are relatively old compared to others. For example, we used teen- age pregnancy rate data for the year 2005, which is the most recent year for which such data were available for all the states. Socio-demographic variables such as the total population and racial/ethnic composition are from the 2010 and 2000 Summary File 1 (SF1) of the decennial censuses (US Census Bureau, Copyright © 2012 SciRes. 304 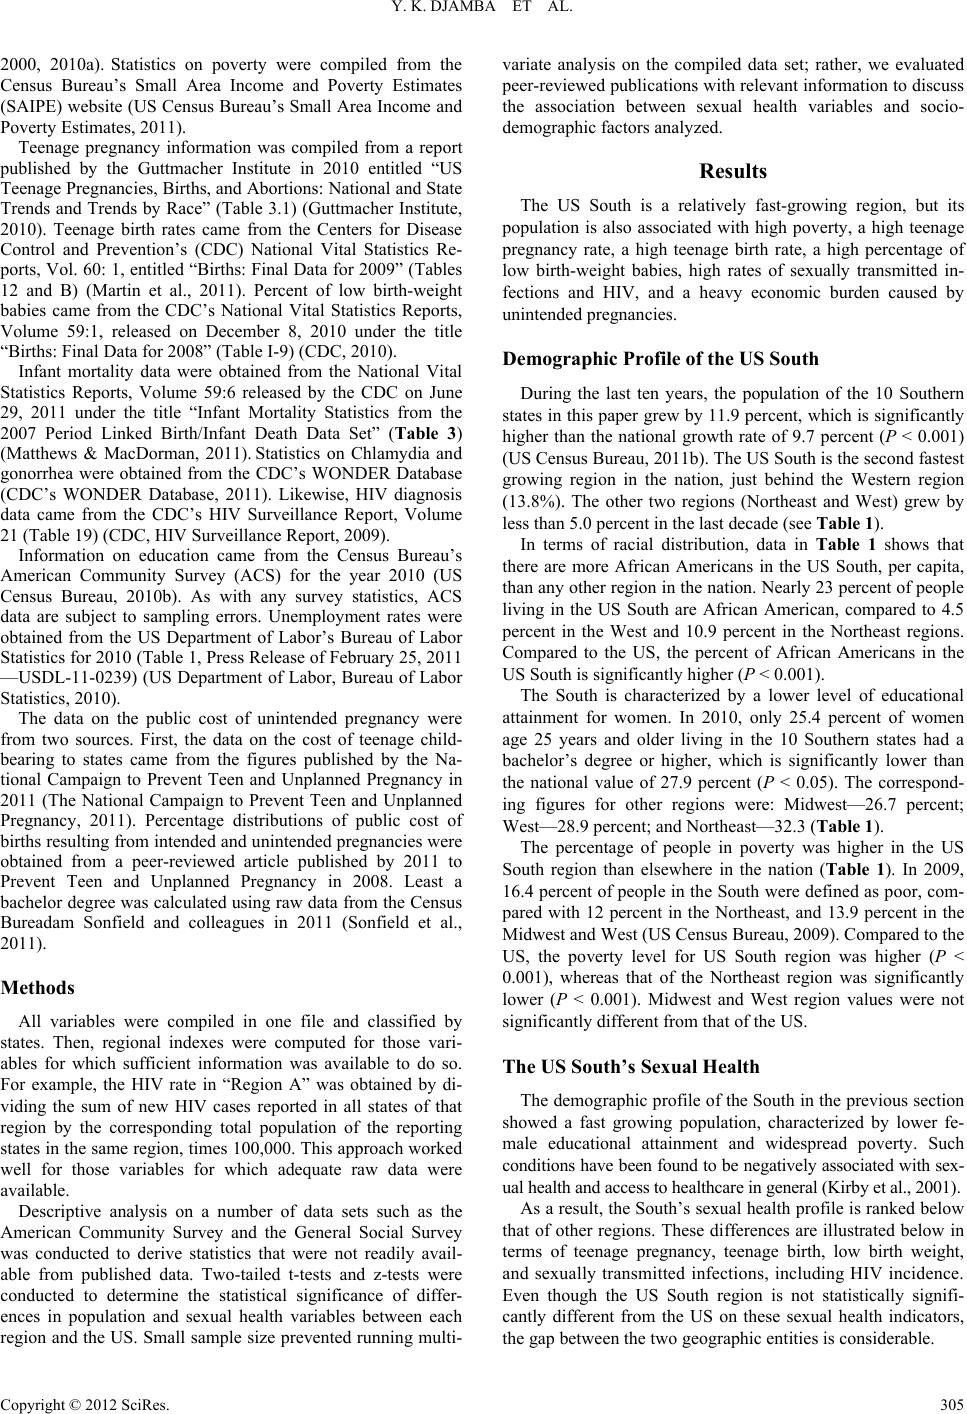 Y. K. DJAMBA ET AL. 2000, 2010a). Statistics on poverty were compiled from the Census Bureau’s Small Area Income and Poverty Estimates (SAIPE) website (US Census Bureau’s Small Area Income and Poverty Estimates, 2011). Teenage pregnancy information was compiled from a report published by the Guttmacher Institute in 2010 entitled “US Teenage Pregnancies, Births, and Abortions: National and State Trends and Trends by Race” (Table 3.1) (Guttmacher Institute, 2010). Teenage birth rates came from the Centers for Disease Control and Prevention’s (CDC) National Vital Statistics Re- ports, Vol. 60: 1, entitled “Births: Final Data for 2009” (Tables 12 and B) (Martin et al., 2011). Percent of low birth-weight babies came from the CDC’s National Vital Statistics Reports, Volume 59:1, released on December 8, 2010 under the title “Births: Final Data for 2008” (Table I-9) (CDC, 2010). Infant mortality data were obtained from the National Vital Statistics Reports, Volume 59:6 released by the CDC on June 29, 2011 under the title “Infant Mortality Statistics from the 2007 Period Linked Birth/Infant Death Data Set” (Table 3) (Matthews & MacDorman, 2011). Statistics on Chlamydia and gonorrhea were obtained from the CDC’s WONDER Database (CDC’s WONDER Database, 2011). Likewise, HIV diagnosis data came from the CDC’s HIV Surveillance Report, Volume 21 (Table 19) (CDC, HIV Surveillance Report, 2009). Information on education came from the Census Bureau’s American Community Survey (ACS) for the year 2010 (US Census Bureau, 2010b). As with any survey statistics, ACS data are subject to sampling errors. Unemployment rates were obtained from the US Department of Labor’s Bureau of Labor Statistics for 2010 (Table 1, Press Release of February 25, 2011 —USDL-11-0239) (US Department of Labor, Bureau of Labor Statistics, 2010). The data on the public cost of unintended pregnancy were from two sources. First, the data on the cost of teenage child- bearing to states came from the figures published by the Na- tional Campaign to Prevent Teen and Unplanned Pregnancy in 2011 (The National Campaign to Prevent Teen and Unplanned Pregnancy, 2011). Percentage distributions of public cost of births resulting from intended and unintended pregnancies were obtained from a peer-reviewed article published by 2011 to Prevent Teen and Unplanned Pregnancy in 2008. Least a bachelor degree was calculated using raw data from the Census Bureadam Sonfield and colleagues in 2011 (Sonfield et al., 2011). Methods All variables were compiled in one file and classified by states. Then, regional indexes were computed for those vari- ables for which sufficient information was available to do so. For example, the HIV rate in “Region A” was obtained by di- viding the sum of new HIV cases reported in all states of that region by the corresponding total population of the reporting states in the same region, times 100,000. This approach worked well for those variables for which adequate raw data were available. Descriptive analysis on a number of data sets such as the American Community Survey and the General Social Survey was conducted to derive statistics that were not readily avail- able from published data. Two-tailed t-tests and z-tests were conducted to determine the statistical significance of differ- ences in population and sexual health variables between each region and the US. Small sample size prevented running multi- variate analysis on the compiled data set; rather, we evaluated peer-reviewed publications with relevant information to discuss the association between sexual health variables and socio- demographic factors analyzed. Results The US South is a relatively fast-growing region, but its population is also associated with high poverty, a high teenage pregnancy rate, a high teenage birth rate, a high percentage of low birth-weight babies, high rates of sexually transmitted in- fections and HIV, and a heavy economic burden caused by unintended pregnancies. Demographi c Profi l e of the US So uth During the last ten years, the population of the 10 Southern states in this paper grew by 11.9 percent, which is significantly higher than the national growth rate of 9.7 percent (P < 0.001) (US Census Bureau, 2011b). The US South is the second fastest growing region in the nation, just behind the Western region (13.8%). The other two regions (Northeast and West) grew by less than 5.0 percent in the last decade (see Table 1). In terms of racial distribution, data in Table 1 shows that there are more African Americans in the US South, per capita, than any other region in the nation. Nearly 23 percent of people living in the US South are African American, compared to 4.5 percent in the West and 10.9 percent in the Northeast regions. Compared to the US, the percent of African Americans in the US South is significantly higher (P < 0.001). The South is characterized by a lower level of educational attainment for women. In 2010, only 25.4 percent of women age 25 years and older living in the 10 Southern states had a bachelor’s degree or higher, which is significantly lower than the national value of 27.9 percent (P < 0.05). The correspond- ing figures for other regions were: Midwest—26.7 percent; West—28.9 percent; and Northeast—32.3 (Table 1). The percentage of people in poverty was higher in the US South region than elsewhere in the nation (Table 1). In 2009, 16.4 percent of people in the South were defined as poor, com- pared with 12 percent in the Northeast, and 13.9 percent in the Midwest and West (US Census Bureau, 2009). Compared to the US, the poverty level for US South region was higher (P < 0.001), whereas that of the Northeast region was significantly lower (P < 0.001). Midwest and West region values were not significantly different from that of the US. The US South’s Sexual Health The demographic profile of the South in the previous section showed a fast growing population, characterized by lower fe- male educational attainment and widespread poverty. Such conditions have been found to be negatively associated with sex- ual health and access to healthcare in general (Kirby et al., 2001). As a result, the South’s sexual health profile is ranked below that of other regions. These differences are illustrated below in terms of teenage pregnancy, teenage birth, low birth weight, and sexually transmitted infections, including HIV incidence. Even though the US South region is not statistically signifi- cantly different from the US on these sexual health indicators, the gap between the two geographic entities is considerable. Copyright © 2012 SciRes. 305 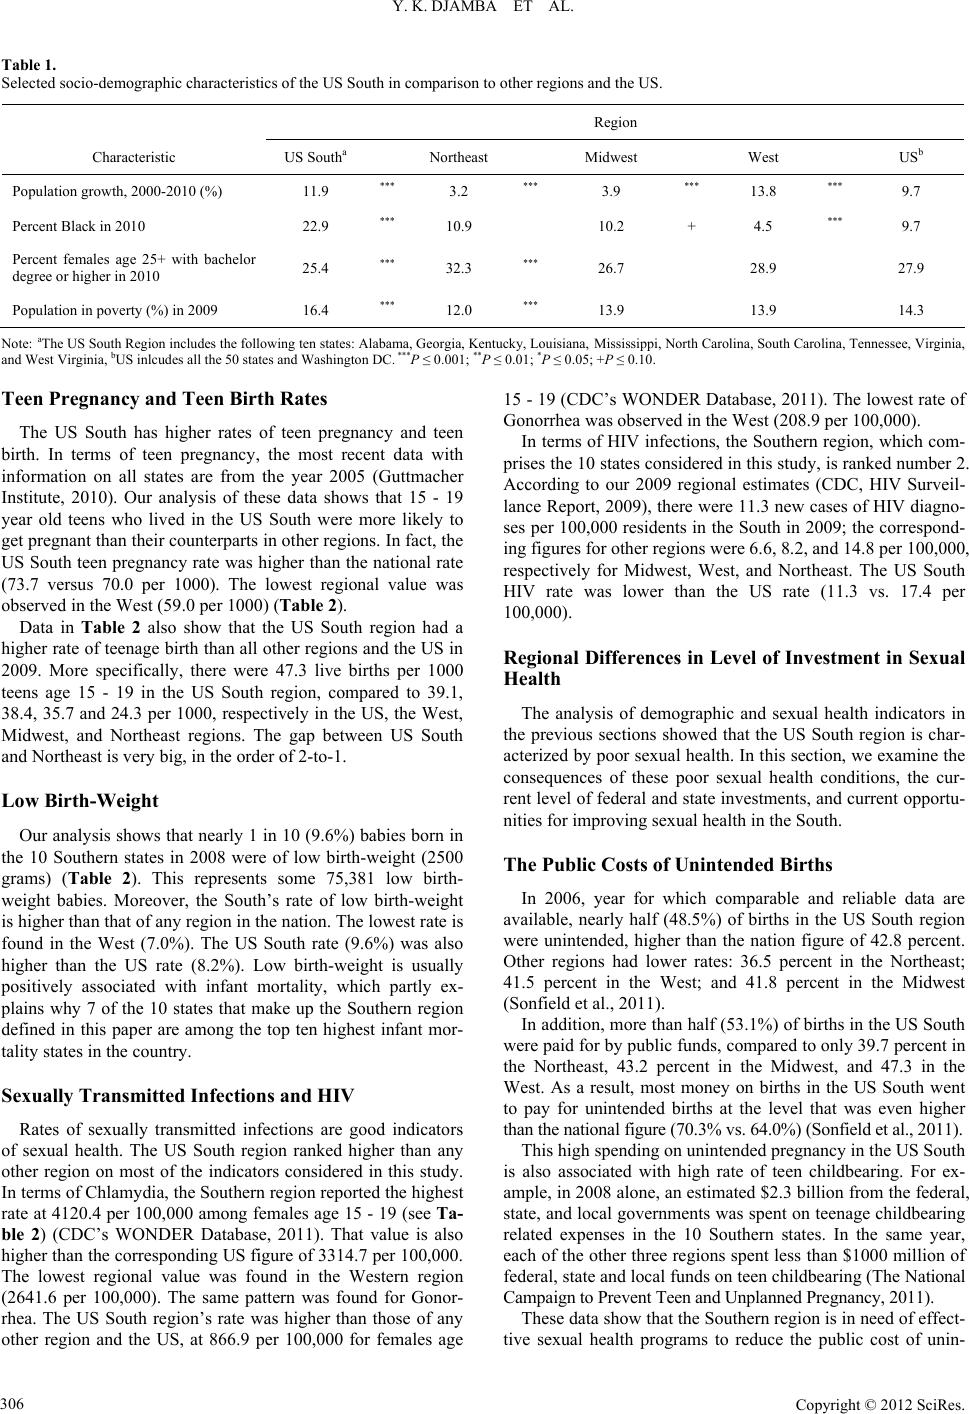 Y. K. DJAMBA ET AL. Copyright © 2012 SciRes. 306 Table 1. Selected socio-demographic characteristics of the US South in comparison to other regions and the US. Region Characteristic US Southa Northeast Midwest West USb Population growth, 2000-2010 (%) 11.9 *** 3.2 *** 3.9 *** 13.8 *** 9.7 Percent Black in 2010 22.9 *** 10.9 10.2 + 4.5 *** 9.7 Percent females age 25+ with bachelor degree or higher in 2010 25.4 *** 32.3 *** 26.7 28.9 27.9 Population in poverty (%) in 2009 16.4 *** 12.0 *** 13.9 13.9 14.3 Note: aThe US South Region includes the following ten states: Alabama, Georgia, Kentucky, Louisiana, Mississippi, North Carolina, South Carolina, Tennessee, Virginia, and West Virginia, bUS inlcudes all the 50 states and Washington DC. ***P ≤ 0.001; **P ≤ 0.01; *P ≤ 0.05; +P ≤ 0.10. Teen Pregnancy and Teen Birth Rates The US South has higher rates of teen pregnancy and teen birth. In terms of teen pregnancy, the most recent data with information on all states are from the year 2005 (Guttmacher Institute, 2010). Our analysis of these data shows that 15 - 19 year old teens who lived in the US South were more likely to get pregnant than their counterparts in other regions. In fact, the US South teen pregnancy rate was higher than the national rate (73.7 versus 70.0 per 1000). The lowest regional value was observed in the West (59.0 per 1000) (Table 2). Data in Table 2 also show that the US South region had a higher rate of teenage birth than all other regions and the US in 2009. More specifically, there were 47.3 live births per 1000 teens age 15 - 19 in the US South region, compared to 39.1, 38.4, 35.7 and 24.3 per 1000, respectively in the US, the West, Midwest, and Northeast regions. The gap between US South and Northeast is very big, in the order of 2-to-1. Low Birth-Weight Our analysis shows that nearly 1 in 10 (9.6%) babies born in the 10 Southern states in 2008 were of low birth-weight (2500 grams) (Table 2). This represents some 75,381 low birth- weight babies. Moreover, the South’s rate of low birth-weight is higher than that of any region in the nation. The lowest rate is found in the West (7.0%). The US South rate (9.6%) was also higher than the US rate (8.2%). Low birth-weight is usually positively associated with infant mortality, which partly ex- plains why 7 of the 10 states that make up the Southern region defined in this paper are among the top ten highest infant mor- tality states in the country. Sexually Transmitted Infections and HIV Rates of sexually transmitted infections are good indicators of sexual health. The US South region ranked higher than any other region on most of the indicators considered in this study. In terms of Chlamydia, the Southern region reported the highest rate at 4120.4 per 100,000 among females age 15 - 19 (see Ta- ble 2) (CDC’s WONDER Database, 2011). That value is also higher than the corresponding US figure of 3314.7 per 100,000. The lowest regional value was found in the Western region (2641.6 per 100,000). The same pattern was found for Gonor- rhea. The US South region’s rate was higher than those of any other region and the US, at 866.9 per 100,000 for females age 15 - 19 (CDC’s WONDER Database, 2011). The lowest rate of Gonorrhea was observed in the West (208.9 per 100,000). In terms of HIV infections, the Southern region, which com- prises the 10 states considered in this study, is ranked number 2. According to our 2009 regional estimates (CDC, HIV Surveil- lance Report, 2009), there were 11.3 new cases of HIV diagno- ses per 100,000 residents in the South in 2009; the correspond- ing figures for other regions were 6.6, 8.2, and 14.8 per 100,000, respectively for Midwest, West, and Northeast. The US South HIV rate was lower than the US rate (11.3 vs. 17.4 per 100,000). Regional Differences in Level of Investment in Sexual Health The analysis of demographic and sexual health indicators in the previous sections showed that the US South region is char- acterized by poor sexual health. In this section, we examine the consequences of these poor sexual health conditions, the cur- rent level of federal and state investments, and current opportu- nities for improving sexual health in the South. The Public Costs of Unintended Births In 2006, year for which comparable and reliable data are available, nearly half (48.5%) of births in the US South region were unintended, higher than the nation figure of 42.8 percent. Other regions had lower rates: 36.5 percent in the Northeast; 41.5 percent in the West; and 41.8 percent in the Midwest (Sonfield et al., 2011). In addition, more than half (53.1%) of births in the US South were paid for by public funds, compared to only 39.7 percent in the Northeast, 43.2 percent in the Midwest, and 47.3 in the West. As a result, most money on births in the US South went to pay for unintended births at the level that was even higher than the national figure (70.3% vs. 64.0%) (Sonfield et al., 2011). This high spending on unintended pregnancy in the US South is also associated with high rate of teen childbearing. For ex- ample, in 2008 alone, an estimated $2.3 billion from the federal, state, and local governments was spent on teenage childbearing related expenses in the 10 Southern states. In the same year, each of the other three regions spent less than $1000 million of federal, state and local funds on teen childbearing (The National Campaign to Prevent Teen and Unplanned Pregnancy, 2011). These data show that the Southern region is in need of effect- tive sexual health programs to reduce the public cost of unin- 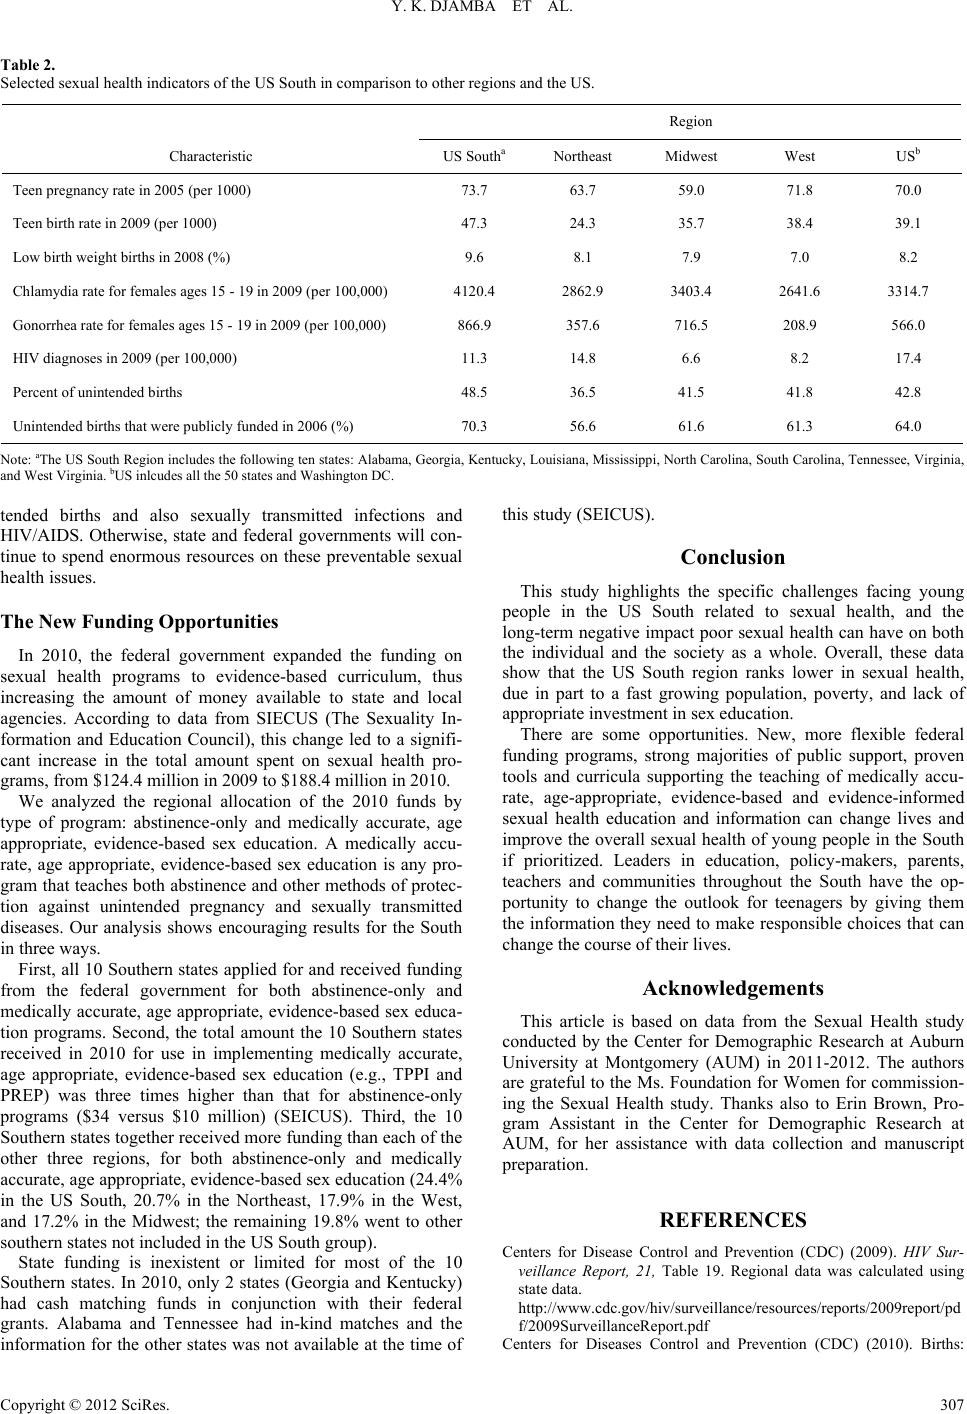 Y. K. DJAMBA ET AL. Table 2. Selected sexual health indicators of the US South in comparison to other regions and the US. Region Characteristic US Southa Northeast Midwest West USb Teen pregnancy rate in 2005 (per 1000) 73.7 63.7 59.0 71.8 70.0 Teen birth rate in 2009 (per 1000) 47.3 24.3 35.7 38.4 39.1 Low birth weight births in 2008 (%) 9.6 8.1 7.9 7.0 8.2 Chlamydia rate for females ages 15 - 19 in 2009 (per 100,000) 4120.4 2862.9 3403.4 2641.6 3314.7 Gonorrhea rate for females ages 15 - 19 in 2009 (per 100,000) 866.9 357.6 716.5 208.9 566.0 HIV diagnoses in 2009 (per 100,000) 11.3 14.8 6.6 8.2 17.4 Percent of unintended births 48.5 36.5 41.5 41.8 42.8 Unintended births that were publicly funded in 2006 (%) 70.3 56.6 61.6 61.3 64.0 Note: aThe US South Region includes the following ten states: Alabama, Georgia, Kentucky, Louisiana, Mississippi, North Carolina, South Carolina, Tennessee, Virginia, and West Virginia. bUS inlcudes all the 50 states and Washington DC. tended births and also sexually transmitted infections and HIV/AIDS. Otherwise, state and federal governments will con- tinue to spend enormous resources on these preventable sexual health issues. The New Fundin g Opportunities In 2010, the federal government expanded the funding on sexual health programs to evidence-based curriculum, thus increasing the amount of money available to state and local agencies. According to data from SIECUS (The Sexuality In- formation and Education Council), this change led to a signifi- cant increase in the total amount spent on sexual health pro- grams, from $124.4 million in 2009 to $188.4 million in 2010. We analyzed the regional allocation of the 2010 funds by type of program: abstinence-only and medically accurate, age appropriate, evidence-based sex education. A medically accu- rate, age appropriate, evidence-based sex education is any pro- gram that teaches both abstinence and other methods of protec- tion against unintended pregnancy and sexually transmitted diseases. Our analysis shows encouraging results for the South in three ways. First, all 10 Southern states applied for and received funding from the federal government for both abstinence-only and medically accurate, age appropriate, evidence-based sex educa- tion programs. Second, the total amount the 10 Southern states received in 2010 for use in implementing medically accurate, age appropriate, evidence-based sex education (e.g., TPPI and PREP) was three times higher than that for abstinence-only programs ($34 versus $10 million) (SEICUS). Third, the 10 Southern states together received more funding than each of the other three regions, for both abstinence-only and medically accurate, age appropriate, evidence-based sex education (24.4% in the US South, 20.7% in the Northeast, 17.9% in the West, and 17.2% in the Midwest; the remaining 19.8% went to other southern states not included in the US South group). State funding is inexistent or limited for most of the 10 Southern states. In 2010, only 2 states (Georgia and Kentucky) had cash matching funds in conjunction with their federal grants. Alabama and Tennessee had in-kind matches and the information for the other states was not available at the time of this study (SEICUS). Conclusion This study highlights the specific challenges facing young people in the US South related to sexual health, and the long-term negative impact poor sexual health can have on both the individual and the society as a whole. Overall, these data show that the US South region ranks lower in sexual health, due in part to a fast growing population, poverty, and lack of appropriate investment in sex education. There are some opportunities. New, more flexible federal funding programs, strong majorities of public support, proven tools and curricula supporting the teaching of medically accu- rate, age-appropriate, evidence-based and evidence-informed sexual health education and information can change lives and improve the overall sexual health of young people in the South if prioritized. Leaders in education, policy-makers, parents, teachers and communities throughout the South have the op- portunity to change the outlook for teenagers by giving them the information they need to make responsible choices that can change the course of their lives. Acknowledgements This article is based on data from the Sexual Health study conducted by the Center for Demographic Research at Auburn University at Montgomery (AUM) in 2011-2012. The authors are grateful to the Ms. Foundation for Women for commission- ing the Sexual Health study. Thanks also to Erin Brown, Pro- gram Assistant in the Center for Demographic Research at AUM, for her assistance with data collection and manuscript preparation. REFERENCES Centers for Disease Control and Prevention (CDC) (2009). HIV Sur- veillance Report, 21, Table 19. Regional data was calculated using state data. http://www.cdc.gov/hiv/surveillance/resources/reports/2009report/pd f/2009SurveillanceReport.pdf Centers for Diseases Control and Prevention (CDC) (2010). Births: Copyright © 2012 SciRes. 307  Y. K. DJAMBA ET AL. Final data for 2008. National Vital Statistics Reports, 59, Table I-9. http://www.cdc.gov/nchs/data/nvsr/nvsr59/nvsr59_01_tables.pdf Centers for Disease Control and Prevention (CDC) (2011). Sexual Health. The definition derived from the World Health Organization (WHO), Measuring Sexual Health: Conceptual and Practical Con- siderations and Related Indicators, 2010. Centers for Disease Control and Prevention’s WONDER Database Website (2011). Regional data was calculated using state data. URL (last checked 18 December 2011). http://wonder.cdc.gov/controller/datarequest/D57;jsessionid=6E97A C5B24CF0A9E538C95027B5F6F9F?stage=results&action=hide&m easure=D57.M2 Guttmacher Institute (2009). Facts on sexually transmitted infections in the United States. URL (last checked 24 May 2012). http://www.guttmacher.org/pubs/FIB_STI_US.html Guttmacher Institute (2010). US teenage pregnancies, births, and abor- tions: National and state trends and trends by race, Table 3.1. URL (last checked 18 December 2011). http://www.guttmacher.org/pubs/USTPtrends.pdf Kirby, D., Coyle, K., & Gould, J. B. (2001). Manifestations of poverty and birthrates among young teenagers in California zip code areas. Family Planning Perspectives, 33, 63-69. doi:10.2307/2673751 Martin, J. A, Hamilton, B. E., Ventura, S. J., Osterman, M. J. K., Kir- meyer, S., Mathews, T. J., & Wilson, E. C. (2011). Births: Final data for 2009, Vital Statistics, 60, Tabls 12 and B. Matthews, T. J., & MacDorman, M. F. (2011). Infant mortality statis- tics from the 2007 period linked birth/infant death data set. National Vital Statistics Reports, 59, Table 3. The National Campaign to Prevent Teen and Unplanned Pregnancy (2011). The public costs of teen childbearing. URL (last checked 17 December 2011). http://www.thenationalcampaign.org/costs/#AL SEICUS (2012). The sexuality information and education council for the United States. URL (last checked 11 December 2012). http://siecus.org/index.cfm?fuseaction=Page.viewPage&pageId=472 Sonfield, A., Kost, K., Gold, R. B., & Finer, L. B. (2011). The public costs of births resulting from unintended pregnancies: National and state-level estimates. Perspectives on Sexual and Reproductive Health, 43, 94-102. URL (last checked 17 December 2011). http://www.guttmacher.org/pubs/journals/4309411.html Stanger-Hall, K. F., & Hall, D. W. (2011). Abstinence-only education and teen pregnancy rate: Why we need comprehensive sex education in the US. PLoS ONE, 6, e24658. doi:10.1371/journal.pone.0024658 Swedish International Development Cooperation Agency (SIDA) (2008). Sexuality: A missing dimension in development. URL (last checked 24 May 2012). http://www.sida.se/Documents/Import/pdf/Sexuality-A-Missing-Dim ension-in-Development---brief-version.pdf US Census Bureau (2000). American fact finder, DP-1: Profile of gen- eral demographics characteristics. URL (last checked 18 December 2011). http://factfinder2.census.gov/ US Census Bureau (2009). American community survey, 1-year esti- mates, Table S1701. URL (last checked 25 February 2012). http://factfinder2.census.gov/faces/tableservices/jsf/pages/productvie w.xhtml?pid=ACS_09_1YR_S1701&prodType=table US Census Bureau (2010a). American fact finder, DP-1: Profile of general population and housing characteristics. URL (last checked 18 December 2011). http://factfinder2.census.gov/ US Census Bureau (2010b). American community survey, Table S1501. URL (last checked 24 February 2012). http://factfinder.census.gov/ US Census Bureau (2011a). Regional map of the United States. URL (last checked 20 December 2011). http://www.census.gov/geo/www/us_regdiv.pdf US Census Bureau (2011b). The US population grew by 9.7 percent between 2000 and 2010. URL (last checked 20 December 2011). http://2010.census.gov/2010census/data/apportionment-pop-text.php US Census Bureau’s Small Area Income and Poverty Estimates (2011). URL (last checked 17 December 2011). http://www.census.gov/cgi-bin/saipe/national.cgi?year=2009&ascii US Department of Labor, Bureau of Labor Statistics (2010). Table 1, Press release of February 25, 2011—USDL-11-0239. URL (last checked 18 December 2011). http://www.bls.gov/news.release/archives/srgune_02252011.pdf US Department of Labor, Bureau of Labor Statistics (2011). Unem- ployment rates for states. URL (last checked 28 December 2011). http://www.bls.gov/lau/lastrk10.htm US Office of Management and Budget (OMB) (2012). Statistical policy directive 14. URL (last checked 24 May 2012). http://www.census.gov/hhes/povmeas/methodology/ombdir14.html World Association for Sexual Health (WAS) (2008). Sexual health for the millenium. A declaration and technical document. Minneapolis, MN: World Association for Sexual Health. URL (last checked 7 Oc- tober 2012). http://www.worldsexualhealth.org/sites/default/files/Millennium%20 Declaration%20(English).pdf Copyright © 2012 SciRes. 308
|