Paper Menu >>
Journal Menu >>
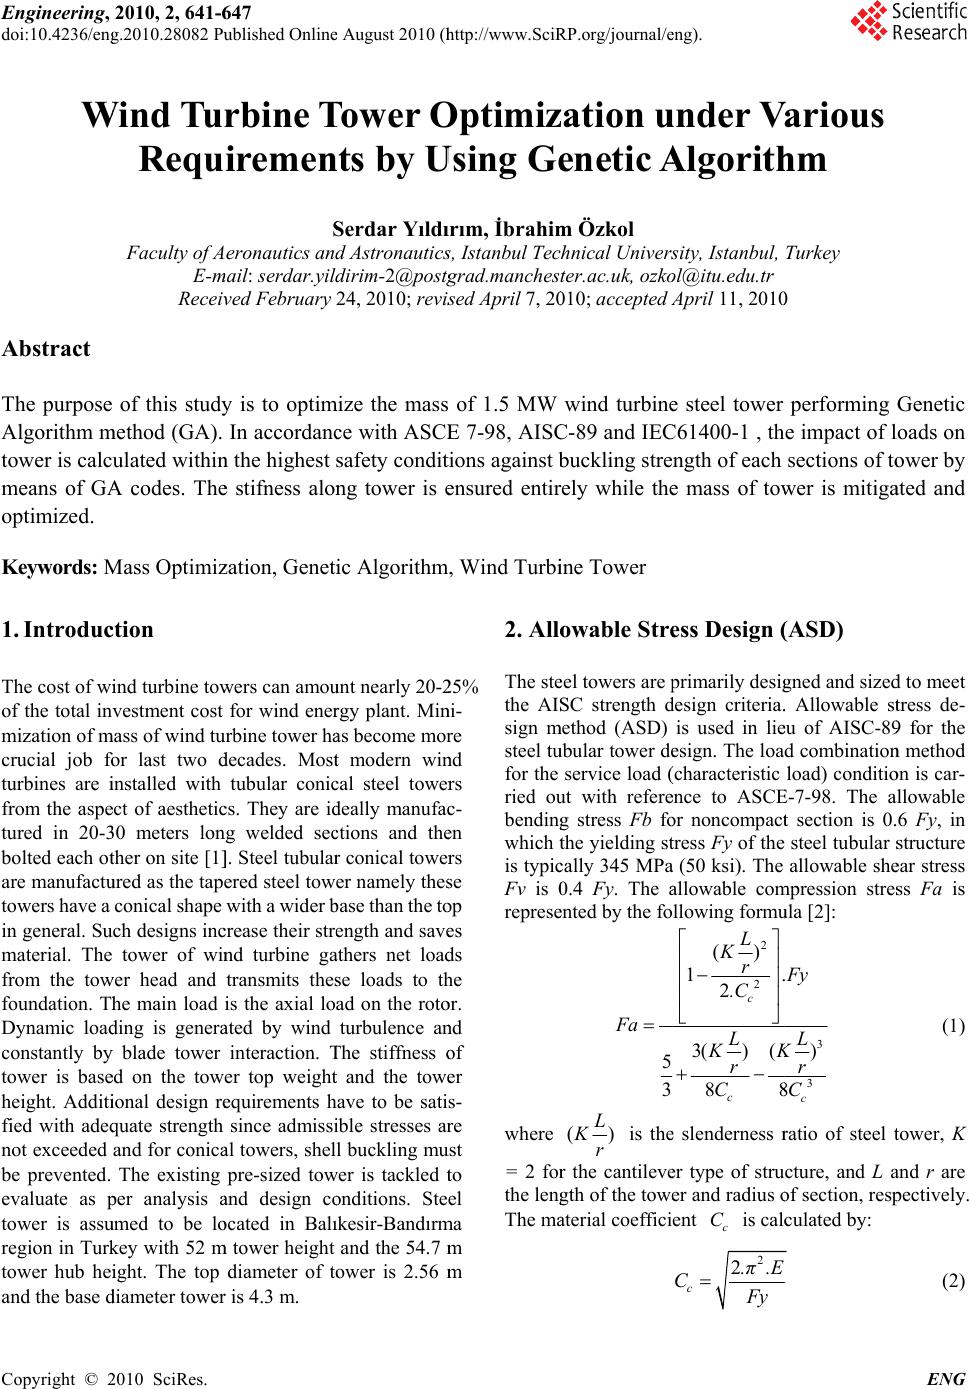 Engineering, doi:10.4236/en g Copyright © 2 W Abstract The purpose Algorithm m tower is calc means of G A optimized. Keywords: M 1. Introdu c The cost of w i of the total in mization of m crucial job fo turbines are i from the asp e tured in 20- 3 b olted each o t are manufact u towers have a in general. S u material. The from the to w foundation. T h Dynamic loa d constantly b y tower is bas e height. Addit i fied with ade q not exceeded b e prevented. evaluate as p tower is ass u region in Tur k tower hub he i and the base d 2010, 2, 641- 6 g .2010.28082 P u 2 010 SciRes. W ind Tu Requ Faculty of A E- m Recei v of this stud y m ethod (GA). ulated withi n A codes. Th e M ass Optimi z c tion i nd turbine to w vestment cost m ass of wind t u fo r last two d i nstalled with e ct of aestheti c 3 0 meters lo n t her on site [1 ] u red as the tap conical shape u ch designs in c tower of wi n w er head and h e main load d ing is gener a y blade tower e d on the tow i onal design r e q uate strength and for conic a The existing p er analysis a u med to be l o k ey with 52 m i ght. The top d iameter towe r 6 47 u blished Onlin e rbine T ireme n S A eronautics an d m ail: s erdar.yil d v ed February y is to opti m In accordan c n the highest e stifness alo n z ation, Genet i w ers can amo u for wind ene r u rbine tower h a d ecades. Mos t tubular coni c c s. They are i d n g welded se c ] . Steel tubula r ered steel tow with a wide r b c rease their str e n d turbine g a transmits the s is the axial lo a ted by wind interaction. T er top weigh t e quirements h since admiss i a l towers, shel pre-sized to w a nd design c o o cated in Bal ı m tower height diameter of t o r is 4.3 m. e August 2010 ( h T ower O n ts by U S erdar Yıld ı d Astronautic s d irim-2@post g 24, 2010; revi s m ize the mass c e with ASC E safety condi t n g tower is e i c Algorith m u nt nearly 20- 2 r gy plant. Mi n a s become mo r t modern wi n c al steel towe r d eally manufa c c tions and th e r conical towe r er namely the s b ase than the t o e ngth and sav e a thers net loa d s e loads to t h ad on the rot o turbulence a n T he stiffness o t and the tow e h ave to be sati i ble stresses a r l buckling m u w er is tackled t o nditions. Ste ı kesi r -Bandır m and the 54.7 m o wer is 2.56 m h ttp://www.Sci R O ptimi z U sing G e ı rım, İbrahi m s , Istanbul Te c g rad.manches s ed April 7, 2 0 of 1.5 MW E 7-98, AIS C t ions against b e nsured enti r , Wind Turb i 2 5% n i- r e n d r s c - e n r s s e o p e s d s h e o r. n d o f e r s- r e u st t o el m a m m 2. All o The st e the AI S sign m steel t u for the ried o u b endin g which t is typi c Fv is 0 repres e where = 2 fo r the len g The m a R P.org/journal/ e z ation u e netic A m Özkol c hnical Univer s ter.ac.u k , ozk o 0 10; accepted A wind turbin e C -89 and IE C b uckling stre r ely while th e i ne Towe r o wable Str e e el towers are p S C strength d m ethod (ASD) u bular tower d e service load ( u t with refer e g stress Fb f o t he yielding s t c ally 345 MP a 0 .4 Fy. The a e nted by the fo 5 3 Fa () L Kr is th e r the cantilev e g th of the tow e a terial coeffici e ng). u nder V A lgorit h s ity, Istanbul, o l@itu.edu.t r A pril 11, 201 0 e steel tower C 61400-1 , th ngth of each e mass of to w e ss Desi g n ( p rimarily desi g d esign criteria . is used in li e e sign. The loa ( characteristic e nce to ASC E o r noncompac t t ress Fy of the a (50 ksi). The a llowable co m llowing form u 2 2 () 12 3() ( 8 8 c c L Kr . .C L KK r C e slenderness r e r type of stru e r and radius o ent c C is cal c 2 2 c .π.E C F y V arious h m Turkey 0 performing e impact of l sections of t o w er is mitig a ( ASD) g ned and size d . Allowable s t e u of AISC-8 9 d combinatio n load) conditi o E -7-98. The a t section is 0. steel tubular s allowable sh e m pression stre s u la [2]: 3 3 ) 8 c . Fy L K r C r atio of steel t cture, and L a o f section, res p c ulated by: ENG Genetic l oads on o wer by a ted and d to meet t ress de- 9 for the n method o n is car- llowable 6 Fy, in s tructure e ar stress s s Fa is (1) t ower, K a nd r are p ectively. (2) 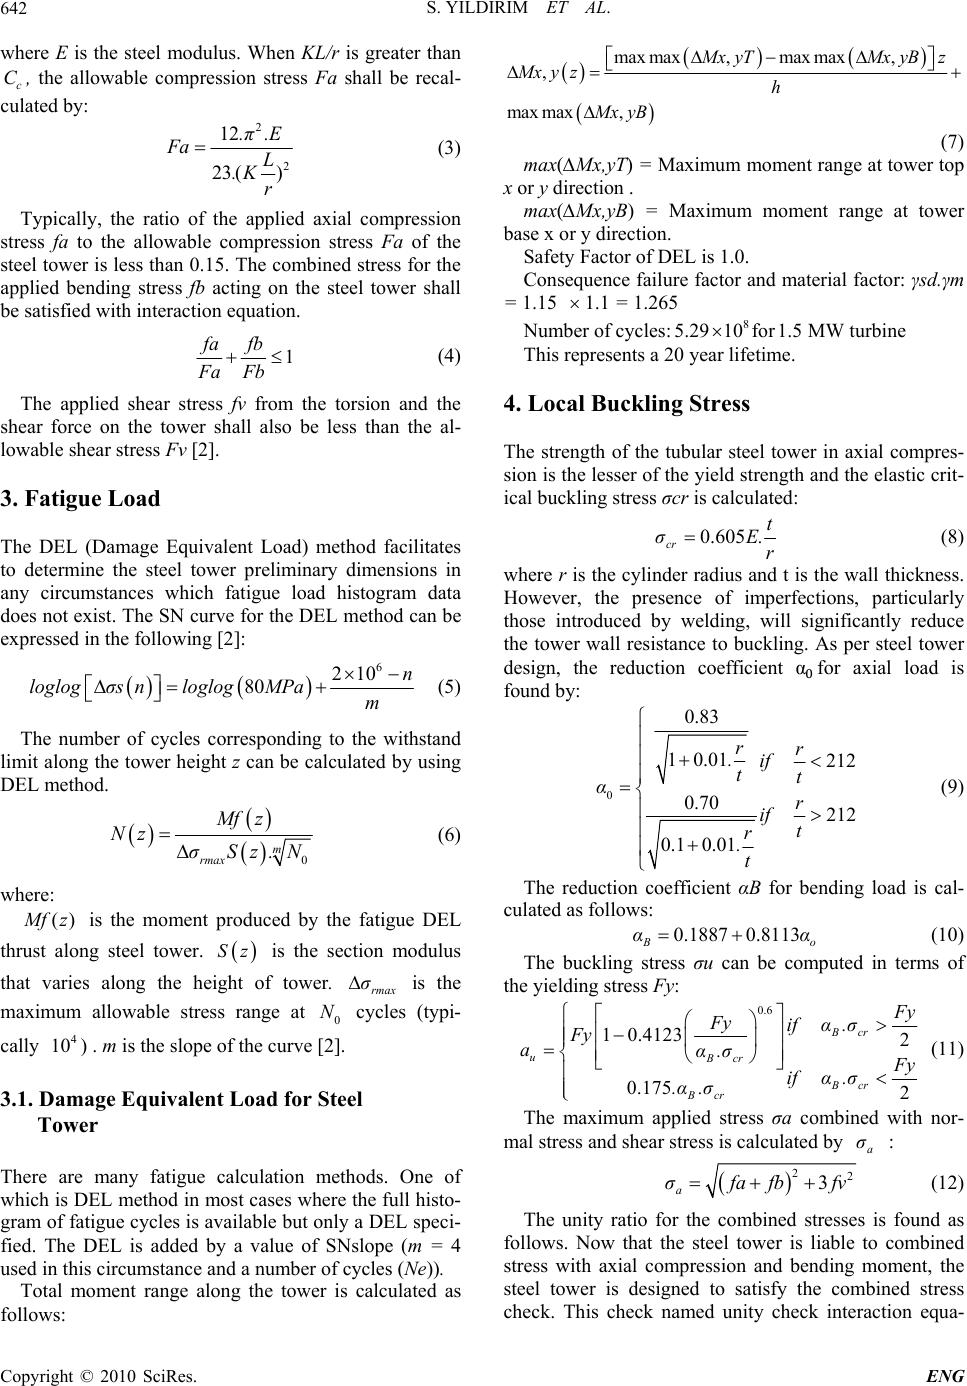 S. YILDIRIM ET AL. Copyright © 2010 SciRes. ENG 642 where E is the steel modulus. When KL/r is greater than c C, the allowable compression stress Fa shall be recal- culated by: 2 2 12 23 () .π.E Fa L .Kr (3) Typically, the ratio of the applied axial compression stress fa to the allowable compression stress Fa of the steel tower is less than 0.15. The combined stress for the applied bending stress fb acting on the steel tower shall be satisfied with interaction equation. 1 fa fb Fa Fb (4) The applied shear stress fv from the torsion and the shear force on the tower shall also be less than the al- lowable shear stress Fv [2]. 3. Fatigue Load The DEL (Damage Equivalent Load) method facilitates to determine the steel tower preliminary dimensions in any circumstances which fatigue load histogram data does not exist. The SN curve for the DEL method can be expressed in the following [2]: 6 210 80 n loglog σsnloglog MPam (5) The number of cycles corresponding to the withstand limit along the tower height z can be calculated by using DEL method. 0 m rmax Mf z Nz σSz.N (6) where: () M fz is the moment produced by the fatigue DEL thrust along steel tower. Sz is the section modulus that varies along the height of tower. rmax σ is the maximum allowable stress range at 0 N cycles (typi- cally 4 10 ) . m is the slope of the curve [2]. 3.1. Damage Equivalent Load for Steel Tower There are many fatigue calculation methods. One of which is DEL method in most cases where the full histo- gram of fatigue cycles is available but only a DEL speci- fied. The DEL is added by a value of SNslope (m = 4 used in this circumstance and a number of cycles (Ne)). Total moment range along the tower is calculated as follows: max max,maxmax, , max max, M xyTMxyB z Mx yzh Mx yB (7) max(∆Mx,yT) = Maximum moment range at tower top x or y direction . max(∆Mx,yB) = Maximum moment range at tower base x or y direction. Safety Factor of DEL is 1.0. Consequence failure factor and material factor: γsd.γm = 1.15 1.1 = 1.265 Number of cycles:8 5.2910for 1.5MW turbine This represents a 20 year lifetime. 4. Local Buckling Stress The strength of the tubular steel tower in axial compres- sion is the lesser of the yield strength and the elastic crit- ical buckling stress σcr is calculated: 0.605 cr t σE. r (8) where r is the cylinder radius and t is the wall thickness. However, the presence of imperfections, particularly those introduced by welding, will significantly reduce the tower wall resistance to buckling. As per steel tower design, the reduction coefficient αfor axial load is found by: 0 0.83 10.01 212 0.70 212 0.1 0.01 rr .if tt αr if t r .t (9) The reduction coefficient αB for bending load is cal- culated as follows: 0.1887 0.8113 B o αα (10) The buckling stress σu can be computed in terms of the yielding stress Fy: 0.6 1 0.41232 0.175 2 Bcr uBcr Bcr Bcr F y Fy if α.σ Fy aα.σ F y if α.σ .α.σ (11) The maximum applied stress σa combined with nor- mal stress and shear stress is calculated by a σ : 22 3 a σ f afb fv (12) The unity ratio for the combined stresses is found as follows. Now that the steel tower is liable to combined stress with axial compression and bending moment, the steel tower is designed to satisfy the combined stress check. This check named unity check interaction equa- 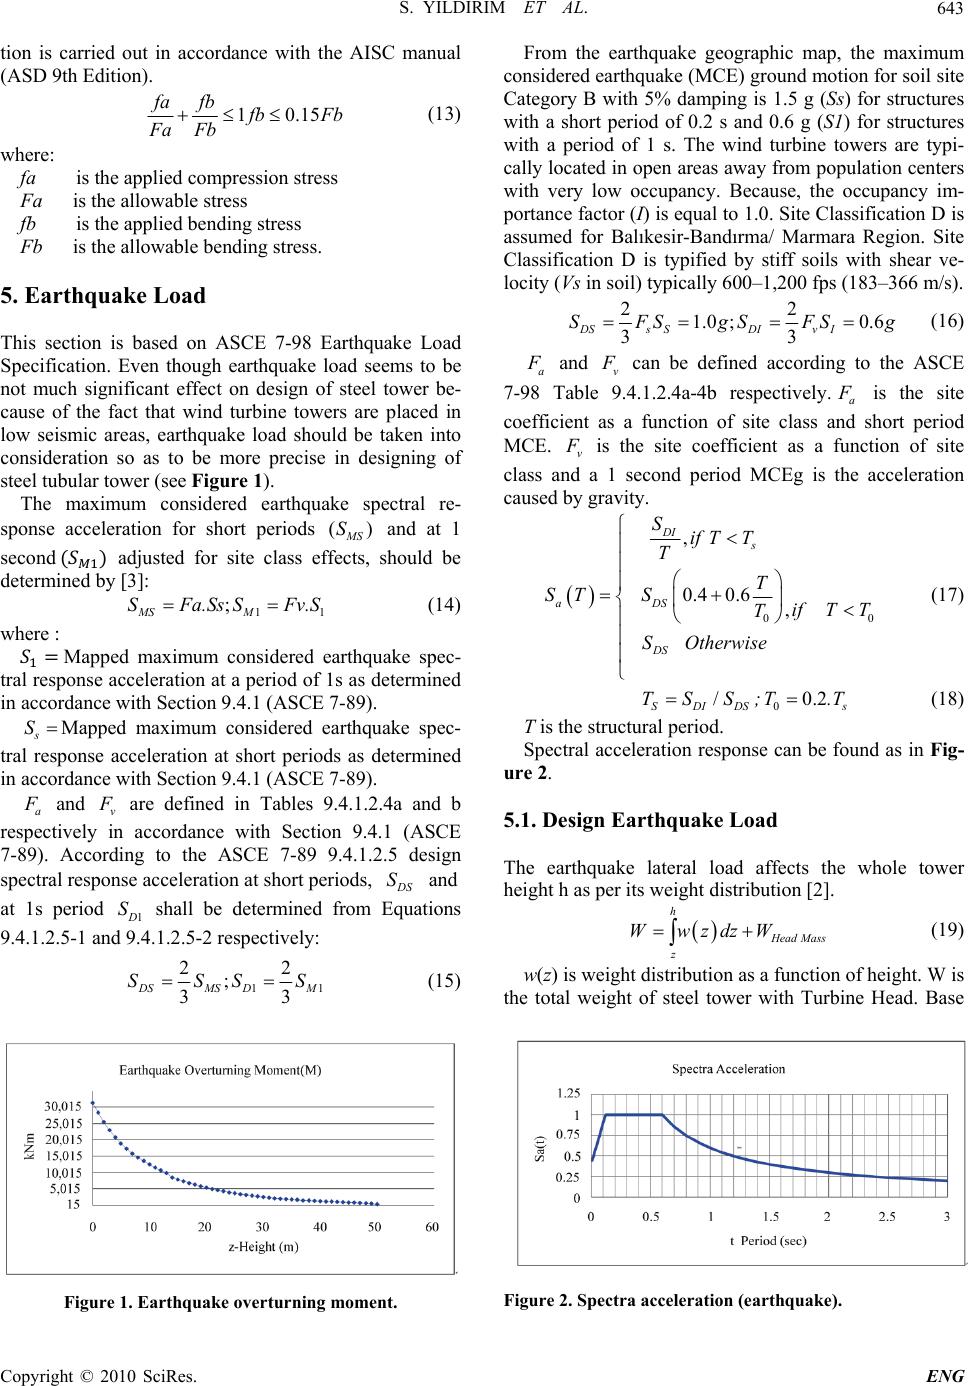 S. YILDIRIM ET AL. Copyright © 2010 SciRes. ENG 643 tion is carried out in accordance with the AISC manual (ASD 9th Edition). 10.15 fa fb f bFb Fa Fb (13) where: fa is the applied compression stress Fa is the allowable stress fb is the applied bending stress Fb is the allowable bending stress. 5. Earthquake Load This section is based on ASCE 7-98 Earthquake Load Specification. Even though earthquake load seems to be not much significant effect on design of steel tower be- cause of the fact that wind turbine towers are placed in low seismic areas, earthquake load should be taken into consideration so as to be more precise in designing of steel tubular tower (see Figure 1). The maximum considered earthquake spectral re- sponse acceleration for short periods () M S S and at 1 second adjusted for site class effects, should be determined by [3]: 11 ; MS M SFa.Ss SFv.S (14) where : Mapped maximum considered earthquake spec- tral response acceleration at a period of 1s as determined in accordance with Section 9.4.1 (ASCE 7-89). s SMapped maximum considered earthquake spec- tral response acceleration at short periods as determined in accordance with Section 9.4.1 (ASCE 7-89). a F and v F are defined in Tables 9.4.1.2.4a and b respectively in accordance with Section 9.4.1 (ASCE 7-89). According to the ASCE 7-89 9.4.1.2.5 design spectral response acceleration at short periods, D S S and at 1s period 1 D S shall be determined from Equations 9.4.1.2.5-1 and 9.4.1.2.5-2 respectively: 11 22 ; 33 D SMSD M SSSS (15) Figure 1. Earthquake overturning moment. From the earthquake geographic map, the maximum considered earthquake (MCE) ground motion for soil site Category B with 5% damping is 1.5 g (Ss) for structures with a short period of 0.2 s and 0.6 g (S1) for structures with a period of 1 s. The wind turbine towers are typi- cally located in open areas away from population centers with very low occupancy. Because, the occupancy im- portance factor (I) is equal to 1.0. Site Classification D is assumed for Balıkesir-Bandırma/ Marmara Region. Site Classification D is typified by stiff soils with shear ve- locity (Vs in soil) typically 600–1,200 fps (183–366 m/s). 22 1.0 ;0.6 33 DSs SDIv I SFSgSFSg (16) a F and v F can be defined according to the ASCE 7-98 Table 9.4.1.2.4a-4b respectively.a F is the site coefficient as a function of site class and short period MCE. v F is the site coefficient as a function of site class and a 1 second period MCEg is the acceleration caused by gravity. 0 0 , 0.4 0.6, DI s aDS DS Sif TT T T ST Sif T T T SOtherwis e (17) / SDIDS TSS ;00.2 s T.T (18) T is the structural period. Spectral acceleration response can be found as in Fig- ure 2. 5.1. Design Earthquake Load The earthquake lateral load affects the whole tower height h as per its weight distribution [2]. h H ead Mass z WwzdzW (19) w(z) is weight distribution as a function of height. W is the total weight of steel tower with Turbine Head. Base Figure 2. Spectra acceleration (earthquake). 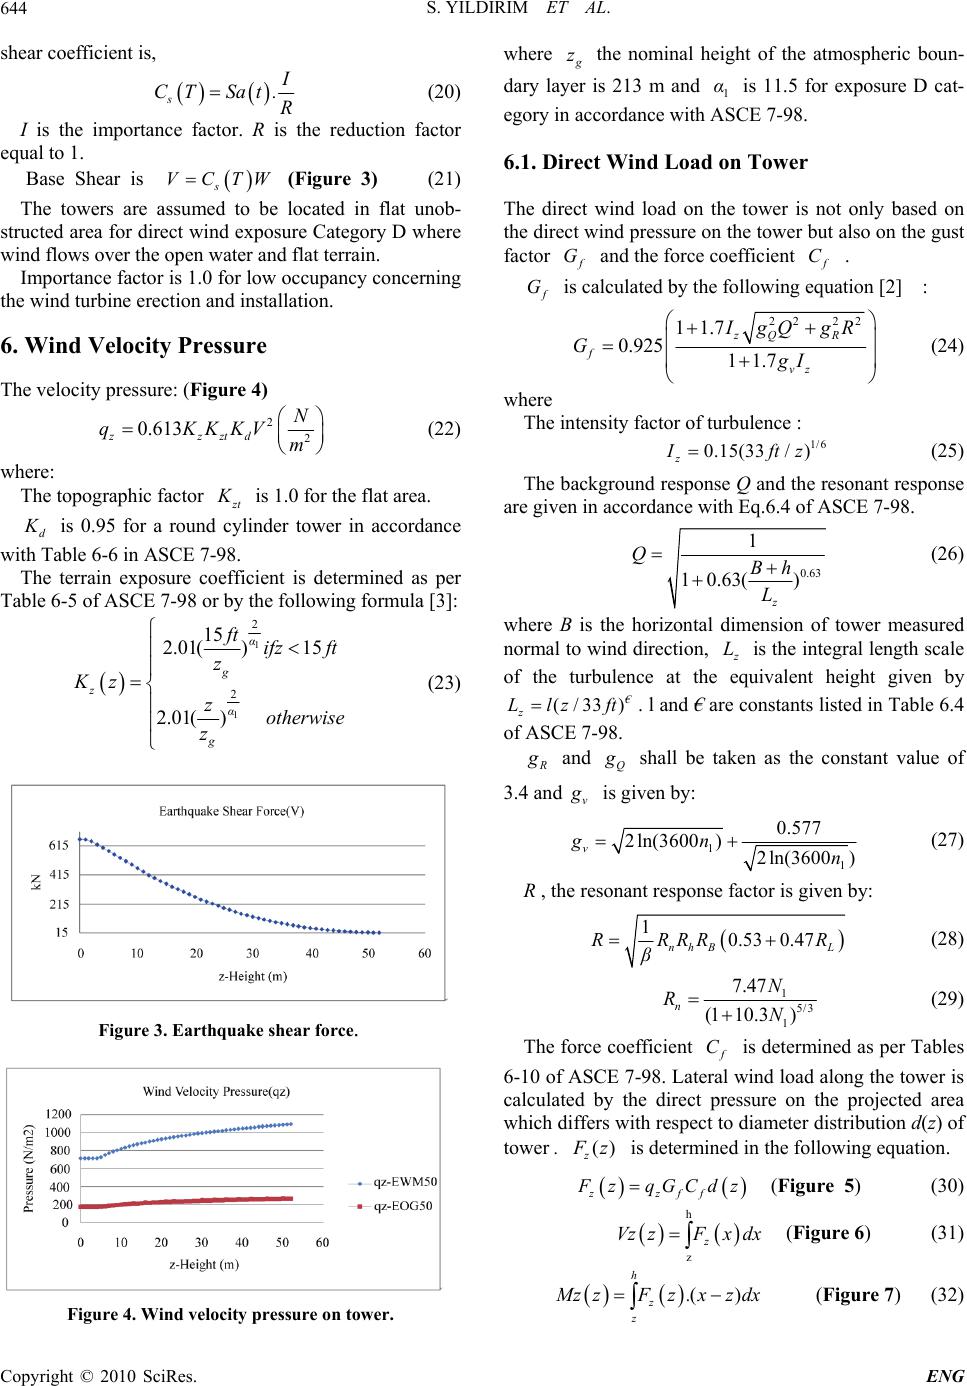 S. YILDIRIM ET AL. Copyright © 2010 SciRes. ENG 644 shear coefficient is, s I CT Sat. R (20) I is the importance factor. R is the reduction factor equal to 1. Base Shear is s VCTW (Figure 3) (21) The towers are assumed to be located in flat unob- structed area for direct wind exposure Category D where wind flows over the open water and flat terrain. Importance factor is 1.0 for low occupancy concerning the wind turbine erection and installation. 6. Wind Velocity Pressure The velocity pressure: (Figure 4) 2 2 0.613 zzztd N qKKKV m (22) where: The topographic factor z t K is 1.0 for the flat area. d K is 0.95 for a round cylinder tower in accordance with Table 6-6 in ASCE 7-98. The terrain exposure coefficient is determined as per Table 6-5 of ASCE 7-98 or by the following formula [3]: 1 1 2 2 15 2.01( )15 2.01( ) α g z α g ft ifz ft z Kz zotherwise z (23) Figure 3. Earthquake shear force. Figure 4. Wind velocity pressure on tower. where g z the nominal height of the atmospheric boun- dary layer is 213 m and 1 α is 11.5 for exposure D cat- egory in accordance with ASCE 7-98. 6.1. Direct Wind Load on Tower The direct wind load on the tower is not only based on the direct wind pressure on the tower but also on the gust factor f G and the force coefficient f C . f G is calculated by the following equation [2] : 22 22 11.7 0.925 11.7 zQ R f vz IgQ gR GgI (24) where The intensity factor of turbulence : 1/6 0.15(33/ ) z I ft z (25) The background response Q and the resonant response are given in accordance with Eq.6.4 of ASCE 7-98. 0.63 1 10.63( ) z QBh L (26) where B is the horizontal dimension of tower measured normal to wind direction, z L is the integral length scale of the turbulence at the equivalent height given by (/33 ) € z L lz ft. l and € are constants listed in Table 6.4 of ASCE 7-98. R g and Q g shall be taken as the constant value of 3.4 and v g is given by: 1 1 0.577 2ln(3600)2 ln(3600) v gn n (27) R , the resonant response factor is given by: 10.53 0.47 nhB L R RRRR β (28) 1 5/3 1 7.47 (1 10.3) n N RN (29) The force coefficient f C is determined as per Tables 6-10 of ASCE 7-98. Lateral wind load along the tower is calculated by the direct pressure on the projected area which differs with respect to diameter distribution d(z) of tower . () z F z is determined in the following equation. zzff F zqGCdz (Figure 5) (30) h z z VzzFx dx (Figure 6) (31) () h z z M zzFz.xzdx (Figure 7) (32) 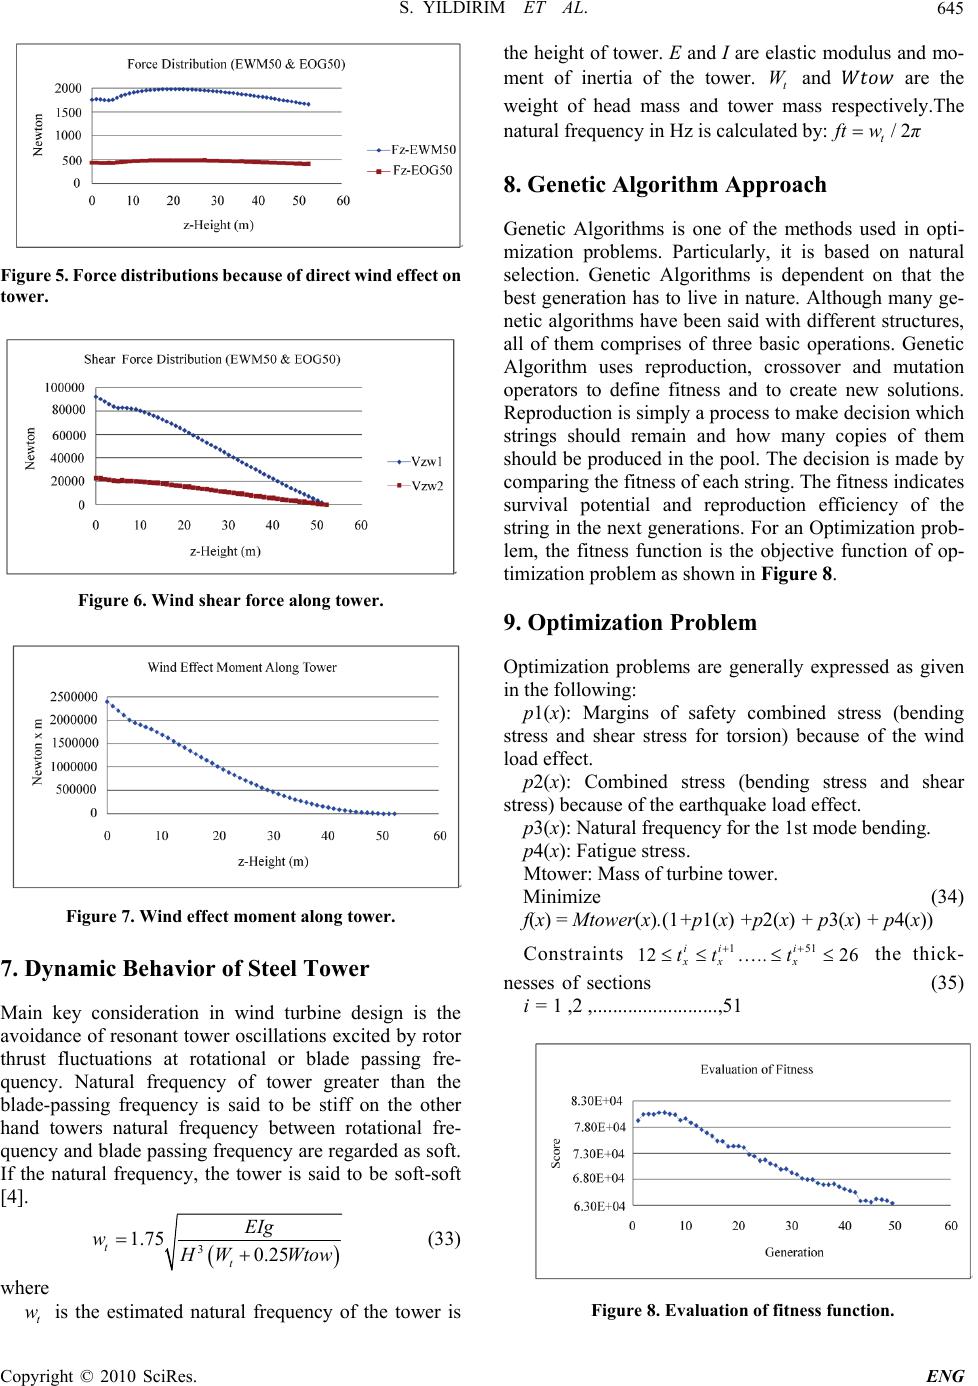 S. YILDIRIM ET AL. Copyright © 2010 SciRes. ENG 645 Figure 5. Force distributions because of direct wind effect on tower. Figure 6. Wind shear force along tower. Figure 7. Wind effect moment along tower. 7. Dynamic Behavior of Steel Tower Main key consideration in wind turbine design is the avoidance of resonant tower oscillations excited by rotor thrust fluctuations at rotational or blade passing fre- quency. Natural frequency of tower greater than the blade-passing frequency is said to be stiff on the other hand towers natural frequency between rotational fre- quency and blade passing frequency are regarded as soft. If the natural frequency, the tower is said to be soft-soft [4]. 3 1.75 0.25 t t EIg w H WWtow (33) where t w is the estimated natural frequency of the tower is the height of tower. E and I are elastic modulus and mo- ment of inertia of the tower. t W and are the weight of head mass and tower mass respectively.The natural frequency in Hz is calculated by:/2 t ft wπ 8. Genetic Algorithm Approach Genetic Algorithms is one of the methods used in opti- mization problems. Particularly, it is based on natural selection. Genetic Algorithms is dependent on that the best generation has to live in nature. Although many ge- netic algorithms have been said with different structures, all of them comprises of three basic operations. Genetic Algorithm uses reproduction, crossover and mutation operators to define fitness and to create new solutions. Reproduction is simply a process to make decision which strings should remain and how many copies of them should be produced in the pool. The decision is made by comparing the fitness of each string. The fitness indicates survival potential and reproduction efficiency of the string in the next generations. For an Optimization prob- lem, the fitness function is the objective function of op- timization problem as shown in Figure 8. 9. Optimization Problem Optimization problems are generally expressed as given in the following: p1(x): Margins of safety combined stress (bending stress and shear stress for torsion) because of the wind load effect. p2(x): Combined stress (bending stress and shear stress) because of the earthquake load effect. p3(x): Natural frequency for the 1st mode bending. p4(x): Fatigue stress. Mtower: Mass of turbine tower. Minimize (34) f(x) = Mtower(x).(1+p1(x) +p2(x) + p3(x) + p4(x)) Constraints 151 12 26 ii i xxx tt ..t the thick- nesses of sections (35) i = 1 ,2 ,.........................,51 Figure 8. Evaluation of fitness function.  S. YILDIRIM ET AL. Copyright © 2010 SciRes. ENG 646 () ()U_C_WL xDCRsw x(Figure 9). Unity check of critical combined buckling stress ratio due to wind effect load against combined stress ratio: () ()U_C_EQ xDCRsq x(Figure 10). Figure 9. Buckling unity check for wind turbine effect and direct wind load. Unity check of critical combined buckling stress ratio ()U_C_EQ x due to earthquake effect load against combined stress ratio ()DCRsq x., trt www Natural Figure 10. Buckling unity check for earthquake load (EQ). Figure 11. Design flow. INPUT DATA 1) General Specifications 2) Material Characteristics 3) Structural Parameters 4) Load conditions 5) GA Parameters 6) ASCE 7-98/IEC /Eurocode Loads 7 ) Safet y Factors OPTIMIZATION PRO- GRAM 1) Natural frequency 2) Extreme Loads 3) Fatigue damage 4) Fitness function OUTPUT PARAMETERS 1) Wall thicknesses of each segment Load Calculation WIND TURBINE DATA 1) Thrust Force and Moment 2) Initial Tower 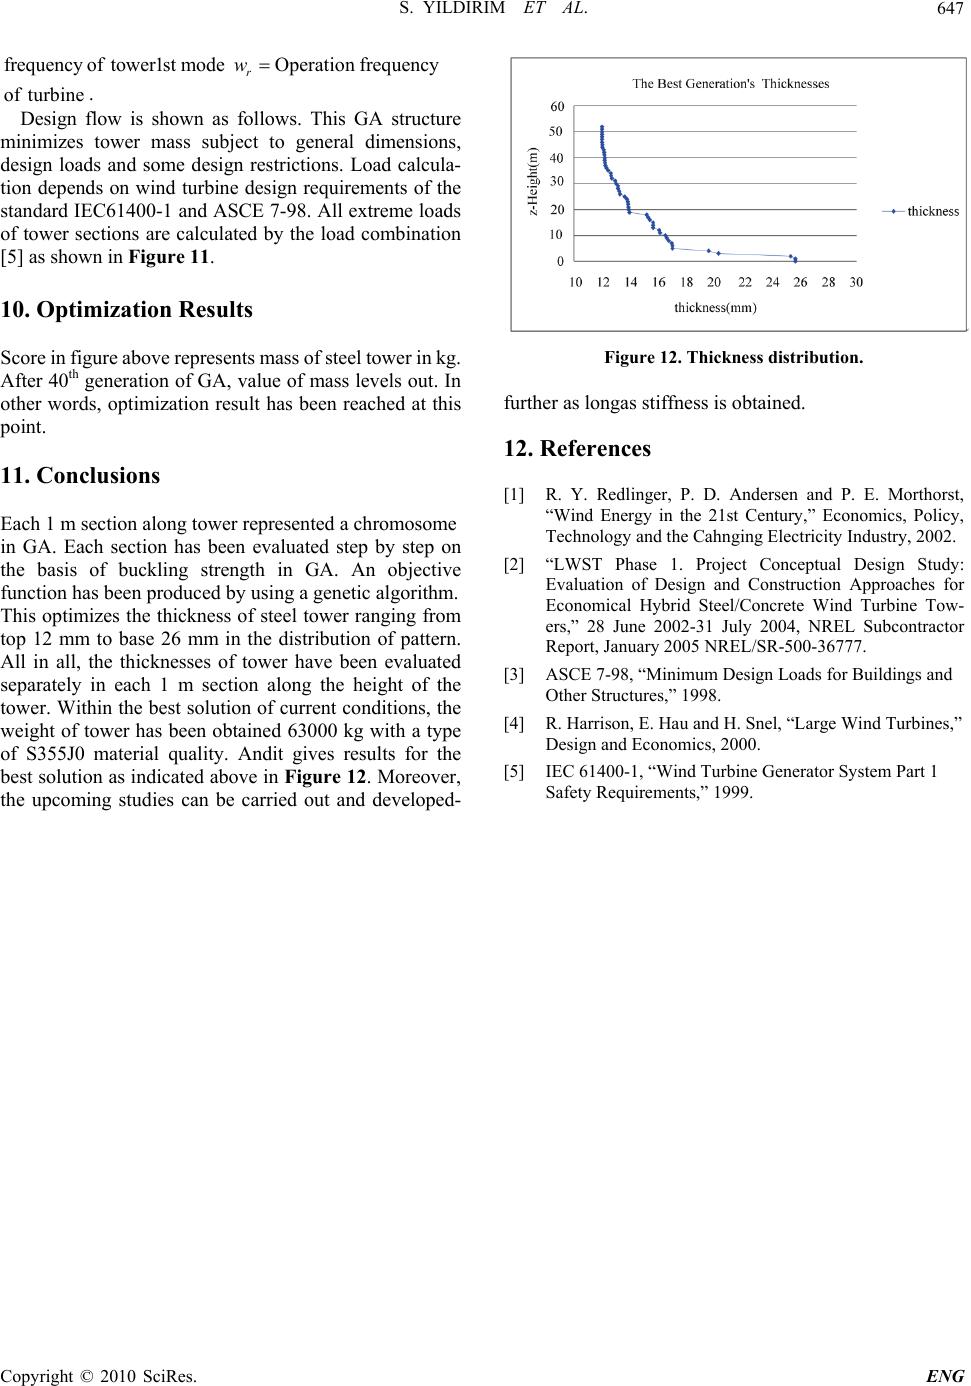 S. YILDIRIM ET AL. Copyright © 2010 SciRes. ENG 647 frequency of tower1st modeOperation frequency r w of turbine. Design flow is shown as follows. This GA structure minimizes tower mass subject to general dimensions, design loads and some design restrictions. Load calcula- tion depends on wind turbine design requirements of the standard IEC61400-1 and ASCE 7-98. All extreme loads of tower sections are calculated by the load combination [5] as shown in Figure 11. 10. Optimization Results Score in figure above represents mass of steel tower in kg. After 40th generation of GA, value of mass levels out. In other words, optimization result has been reached at this point. 11. Conclusions Each 1 m section along tower represented a chromosome in GA. Each section has been evaluated step by step on the basis of buckling strength in GA. An objective function has been produced by using a genetic algorithm. This optimizes the thickness of steel tower ranging from top 12 mm to base 26 mm in the distribution of pattern. All in all, the thicknesses of tower have been evaluated separately in each 1 m section along the height of the tower. Within the best solution of current conditions, the weight of tower has been obtained 63000 kg with a type of S355J0 material quality. Andit gives results for the best solution as indicated above in Figure 12. Moreover, the upcoming studies can be carried out and developed- Figure 12. Thickness distribution. further as longas stiffness is obtained. 12. References [1] R. Y. Redlinger, P. D. Andersen and P. E. Morthorst, “Wind Energy in the 21st Century,” Economics, Policy, Technology and the Cahnging Electricity Industry, 2002. [2] “LWST Phase 1. Project Conceptual Design Study: Evaluation of Design and Construction Approaches for Economical Hybrid Steel/Concrete Wind Turbine Tow- ers,” 28 June 2002-31 July 2004, NREL Subcontractor Report, January 2005 NREL/SR-500-36777. [3] ASCE 7-98, “Minimum Design Loads for Buildings and Other Structures,” 1998. [4] R. Harrison, E. Hau and H. Snel, “Large Wind Turbines,” Design and Economics, 2000. [5] IEC 61400-1, “Wind Turbine Generator System Part 1 Safety Requirements,” 1999. |