Paper Menu >>
Journal Menu >>
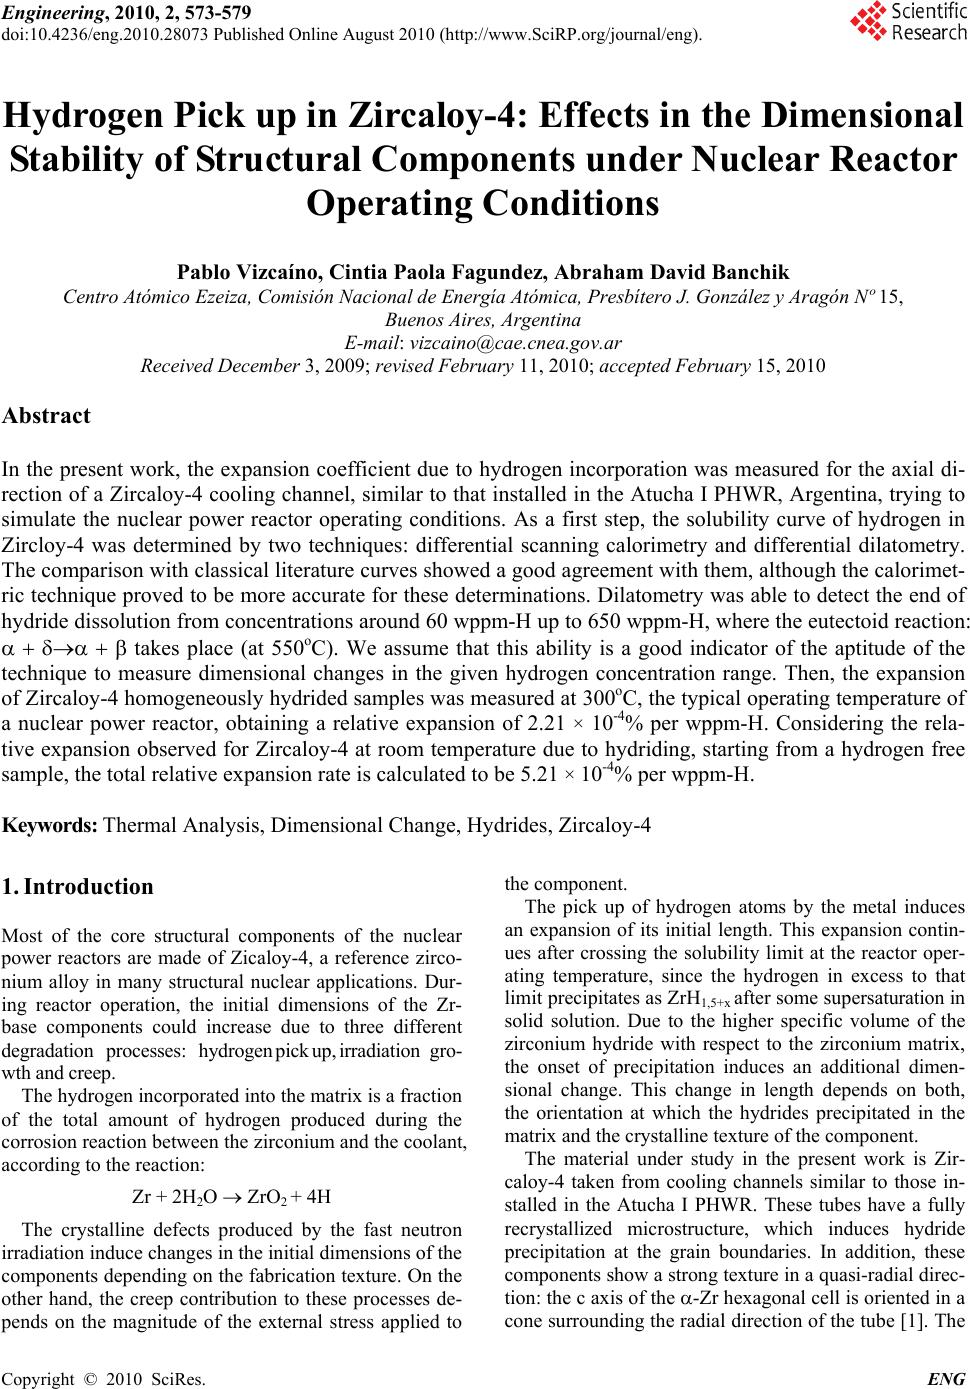 Engineering, 2010, 2, 573-579 doi:10.4236/eng.2010.28073 Published Online August 2010 (http://www.SciRP.org/journal/eng). Copyright © 2010 SciRes. ENG Hydrogen Pick up in Zircaloy-4: Effects in the Dimensional Stability of Structural Components under Nuclear Reactor Operating Conditions Pablo Vizcaíno, Cintia Paola Fagundez, Abraham David Banchik Centro Atómico Ezeiza, Comisión Nacional de Energía Atómica, Presbítero J. González y Aragón Nº 15, Buenos Aires, Argentina E-mail: vizcaino@cae.cnea.gov.ar Received December 3, 2009; revised February 11, 2010; accepted February 15, 2010 Abstract In the present work, the expansion coefficient due to hydrogen incorporation was measured for the axial di- rection of a Zircaloy-4 cooling channel, similar to that installed in the Atucha I PHWR, Argentina, trying to simulate the nuclear power reactor operating conditions. As a first step, the solubility curve of hydrogen in Zircloy-4 was determined by two techniques: differential scanning calorimetry and differential dilatometry. The comparison with classical literature curves showed a good agreement with them, although the calorimet- ric technique proved to be more accurate for these determinations. Dilatometry was able to detect the end of hydride dissolution from concentrations around 60 wppm-H up to 650 wppm-H, where the eutectoid reaction: takes place (at 550oC). We assume that this ability is a good indicator of the aptitude of the technique to measure dimensional changes in the given hydrogen concentration range. Then, the expansion of Zircaloy-4 homogeneously hydrided samples was measured at 300oC, the typical operating temperature of a nuclear power reactor, obtaining a relative expansion of 2.21 × 10⁻⁴% per wppm-H. Considering the rela- tive expansion observed for Zircaloy-4 at room temperature due to hydriding, starting from a hydrogen free sample, the total relative expansion rate is calculated to be 5.21 × 10⁻⁴% per wppm-H. Keywords: Thermal Analysis, Dimensional Change, Hydrides, Zircaloy-4 1. Introduction Most of the core structural components of the nuclear power reactors are made of Zicaloy-4, a reference zirco- nium alloy in many structural nuclear applications. Dur- ing reactor operation, the initial dimensions of the Zr- base components could increase due to three different degradation processes: hydrogen pick up, irradiation gro- wth and creep. The hydrogen incorporated into the matrix is a fraction of the total amount of hydrogen produced during the corrosion reaction between the zirconium and the coolant, according to the reaction: Zr + 2H2O ZrO2 + 4H The crystalline defects produced by the fast neutron irradiation induce changes in the initial dimensions of the components depending on the fabrication texture. On the other hand, the creep contribution to these processes de- pends on the magnitude of the external stress applied to the component. The pick up of hydrogen atoms by the metal induces an expansion of its initial length. This expansion contin- ues after crossing the solubility limit at the reactor oper- ating temperature, since the hydrogen in excess to that limit precipitates as ZrH1,5+x after some supersaturation in solid solution. Due to the higher specific volume of the zirconium hydride with respect to the zirconium matrix, the onset of precipitation induces an additional dimen- sional change. This change in length depends on both, the orientation at which the hydrides precipitated in the matrix and the crystalline texture of the component. The material under study in the present work is Zir- caloy-4 taken from cooling channels similar to those in- stalled in the Atucha I PHWR. These tubes have a fully recrystallized microstructure, which induces hydride precipitation at the grain boundaries. In addition, these components show a strong texture in a quasi-radial direc- tion: the c axis of the -Zr hexagonal cell is oriented in a cone surrounding the radial direction of the tube [1]. The 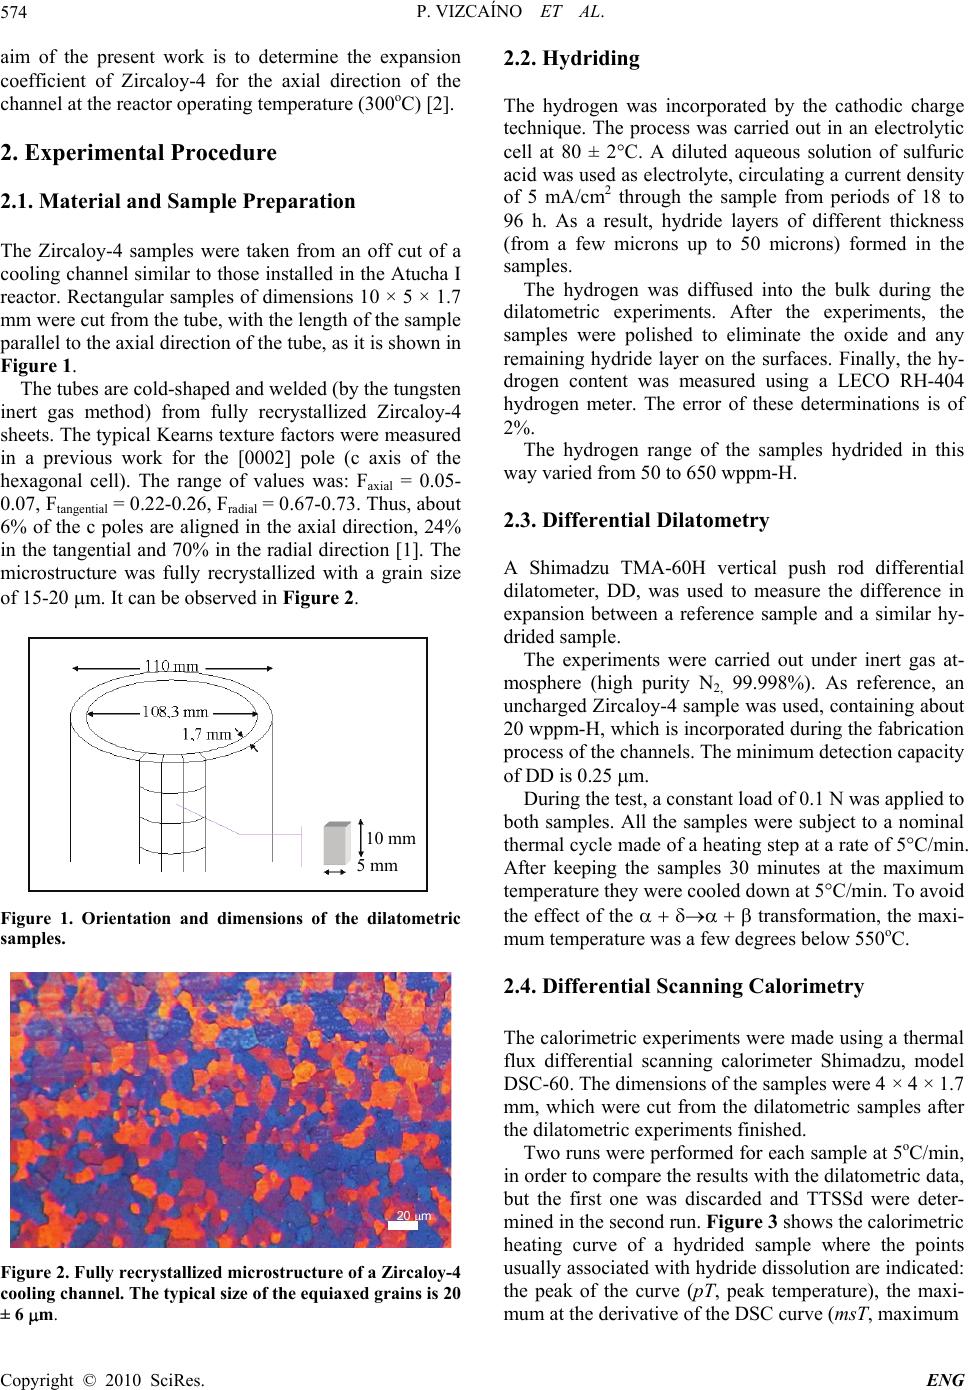 P. VIZCAÍNO ET AL. Copyright © 2010 SciRes. ENG 574 aim of the present work is to determine the expansion coefficient of Zircaloy-4 for the axial direction of the channel at the reactor operating temperature (300oC) [2]. 2. Experimental Procedure 2.1. Material and Sample Preparation The Zircaloy-4 samples were taken from an off cut of a cooling channel similar to those installed in the Atucha I reactor. Rectangular samples of dimensions 10 × 5 × 1.7 mm were cut from the tube, with the length of the sample parallel to the axial direction of the tube, as it is shown in Figure 1. The tubes are cold-shaped and welded (by the tungsten inert gas method) from fully recrystallized Zircaloy-4 sheets. The typical Kearns texture factors were measured in a previous work for the [0002] pole (c axis of the hexagonal cell). The range of values was: Faxial = 0.05- 0.07, Ftangential = 0.22-0.26, Fradial = 0.67-0.73. Thus, about 6% of the c poles are aligned in the axial direction, 24% in the tangential and 70% in the radial direction [1]. The microstructure was fully recrystallized with a grain size of 15-20 m. It can be observed in Figure 2. Figure 1. Orientation and dimensions of the dilatometric samples. 20 m Figure 2. Fully recrystallized microstructure of a Zircaloy-4 cooling channel. The typical size of the equiaxed grains is 20 ± 6 m. 2.2. Hydriding The hydrogen was incorporated by the cathodic charge technique. The process was carried out in an electrolytic cell at 80 ± 2°C. A diluted aqueous solution of sulfuric acid was used as electrolyte, circulating a current density of 5 mA/cm2 through the sample from periods of 18 to 96 h. As a result, hydride layers of different thickness (from a few microns up to 50 microns) formed in the samples. The hydrogen was diffused into the bulk during the dilatometric experiments. After the experiments, the samples were polished to eliminate the oxide and any remaining hydride layer on the surfaces. Finally, the hy- drogen content was measured using a LECO RH-404 hydrogen meter. The error of these determinations is of 2%. The hydrogen range of the samples hydrided in this way varied from 50 to 650 wppm-H. 2.3. Differential Dilatometry A Shimadzu TMA-60H vertical push rod differential dilatometer, DD, was used to measure the difference in expansion between a reference sample and a similar hy- drided sample. The experiments were carried out under inert gas at- mosphere (high purity N2, 99.998%). As reference, an uncharged Zircaloy-4 sample was used, containing about 20 wppm-H, which is incorporated during the fabrication process of the channels. The minimum detection capacity of DD is 0.25 m. During the test, a constant load of 0.1 N was applied to both samples. All the samples were subject to a nominal thermal cycle made of a heating step at a rate of 5°C/min. After keeping the samples 30 minutes at the maximum temperature they were cooled down at 5°C/min. To avoid the effect of the transformation, the maxi- mum temperature was a few degrees below 550oC. 2.4. Differential Scanning Calorimetry The calorimetric experiments were made using a thermal flux differential scanning calorimeter Shimadzu, model DSC-60. The dimensions of the samples were 4 × 4 × 1.7 mm, which were cut from the dilatometric samples after the dilatometric experiments finished. Two runs were performed for each sample at 5oC/min, in order to compare the results with the dilatometric data, but the first one was discarded and TTSSd were deter- mined in the second run. Figure 3 shows the calorimetric heating curve of a hydrided sample where the points usually associated with hydride dissolution are indicated: the peak of the curve (pT, peak temperature), the maxi- mum at the derivative of the DSC curve (msT, maximum 5 m m 10 m m 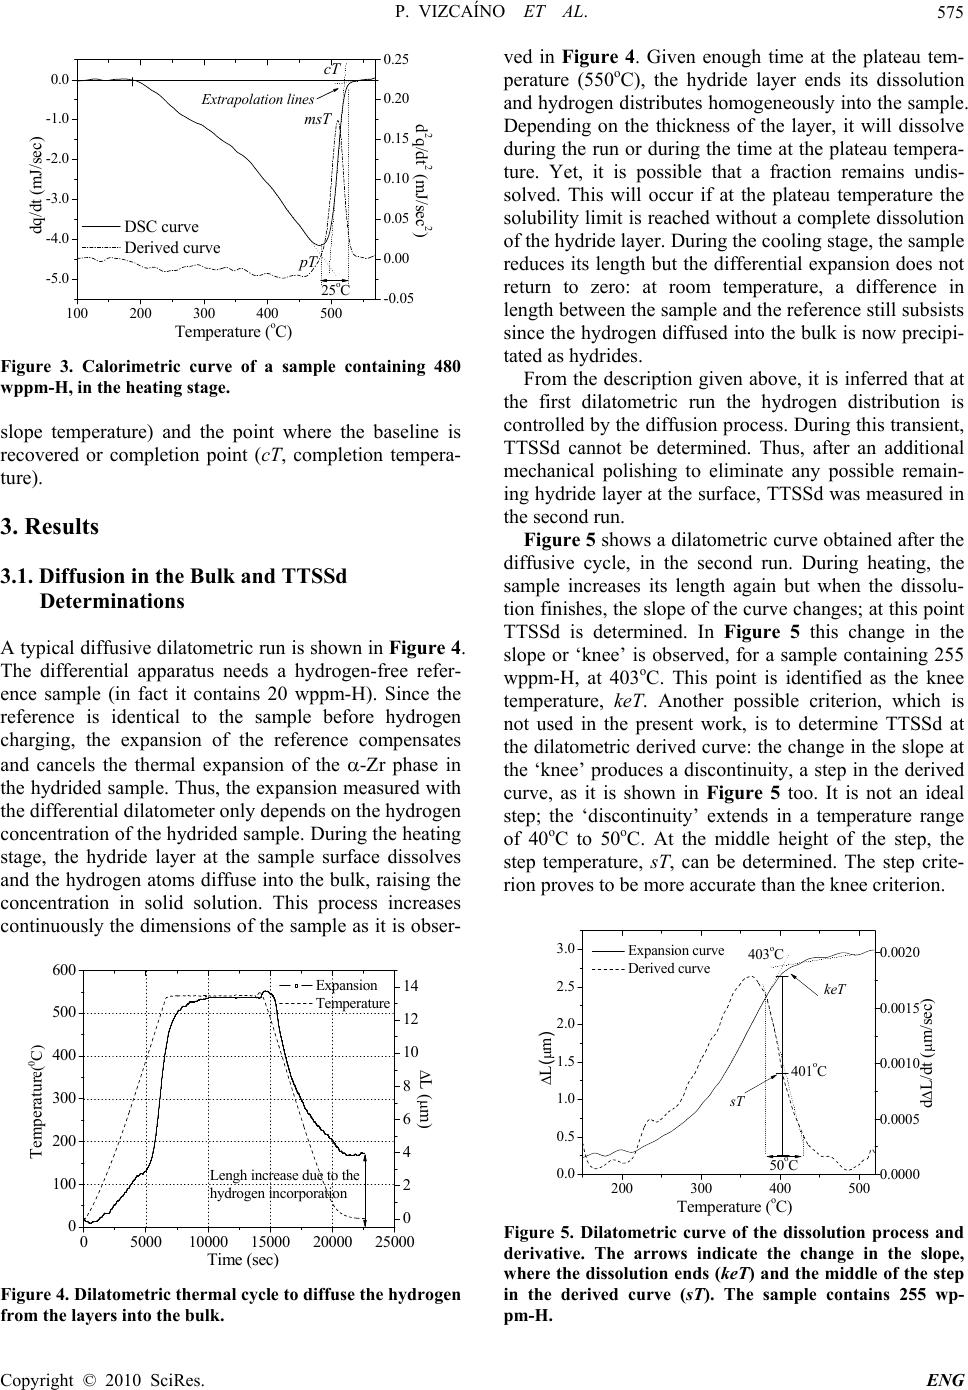 P. VIZCAÍNO ET AL. Copyright © 2010 SciRes. ENG 575 100 200 300400 500 -5.0 -4.0 -3.0 -2.0 -1.0 0.0 msT cT pT DSC curve Derived curve Temperature (oC) dq/dt (mJ/sec) 25oC-0.05 0.00 0.05 0.10 0.15 0.20 0.25 Extrapolation lines d2q/dt2 (mJ/sec2) Figure 3. Calorimetric curve of a sample containing 480 wppm-H, in the heating stage. slope temperature) and the point where the baseline is recovered or completion point (cT , completion tempera- ture). 3. Results 3.1. Diffusion in the Bulk and TTSSd Determinations A typical diffusive dilatometric run is shown in Figure 4. The differential apparatus needs a hydrogen-free refer- ence sample (in fact it contains 20 wppm-H). Since the reference is identical to the sample before hydrogen charging, the expansion of the reference compensates and cancels the thermal expansion of the -Zr phase in the hydrided sample. Thus, the expansion measured with the differential dilatometer only depends on the hydrogen concentration of the hydrided sample. During the heating stage, the hydride layer at the sample surface dissolves and the hydrogen atoms diffuse into the bulk, raising the concentration in solid solution. This process increases continuously the dimensions of the sample as it is obser- 0500010000 15000 20000 25000 0 100 200 300 400 500 600 Expansion Temperature Time (sec) Temperature (篊) 0 2 4 6 8 10 12 14 L (m) Lengh increase due to the hydrogen incorporation Figure 4. Dilatometric thermal cycle to diffuse the hydrogen from the layers into the bulk. ved in Figure 4. Given enough time at the plateau tem- perature (550oC), the hydride layer ends its dissolution and hydrogen distributes homogeneously into the sample. Depending on the thickness of the layer, it will dissolve during the run or during the time at the plateau tempera- ture. Yet, it is possible that a fraction remains undis- solved. This will occur if at the plateau temperature the solubility limit is reached without a complete dissolution of the hydride layer. During the cooling stage, the sample reduces its length but the differential expansion does not return to zero: at room temperature, a difference in length between the sample and the reference still subsists since the hydrogen diffused into the bulk is now precipi- tated as hydrides. From the description given above, it is inferred that at the first dilatometric run the hydrogen distribution is controlled by the diffusion process. During this transient, TTSSd cannot be determined. Thus, after an additional mechanical polishing to eliminate any possible remain- ing hydride layer at the surface, TTSSd was measured in the second run. Figure 5 shows a dilatometric curve obtained after the diffusive cycle, in the second run. During heating, the sample increases its length again but when the dissolu- tion finishes, the slope of the curve changes; at this point TTSSd is determined. In Figure 5 this change in the slope or ‘knee’ is observed, for a sample containing 255 wppm-H, at 403oC. This point is identified as the knee temperature, keT. Another possible criterion, which is not used in the present work, is to determine TTSSd at the dilatometric derived curve: the change in the slope at the ‘knee’ produces a discontinuity, a step in the derived curve, as it is shown in Figure 5 too. It is not an ideal step; the ‘discontinuity’ extends in a temperature range of 40oC to 50oC. At the middle height of the step, the step temperature, sT, can be determined. The step crite- rion proves to be more accurate than the knee criterion. 200 300 400 500 0.0 0.5 1.0 1.5 2.0 2.5 3.0 50oC Expansion curve Derived curve Temperature (oC) L(m) 403oC 401oC keT sT 0.0000 0.0005 0.0010 0.0015 0.0020 d L/dt ( m/sec ) Figure 5. Dilatometric curve of the dissolution process and derivative. The arrows indicate the change in the slope, where the dissolution ends (keT) and the middle of the step in the derived curve (sT). The sample contains 255 wp- pm-H. ( 0C ) 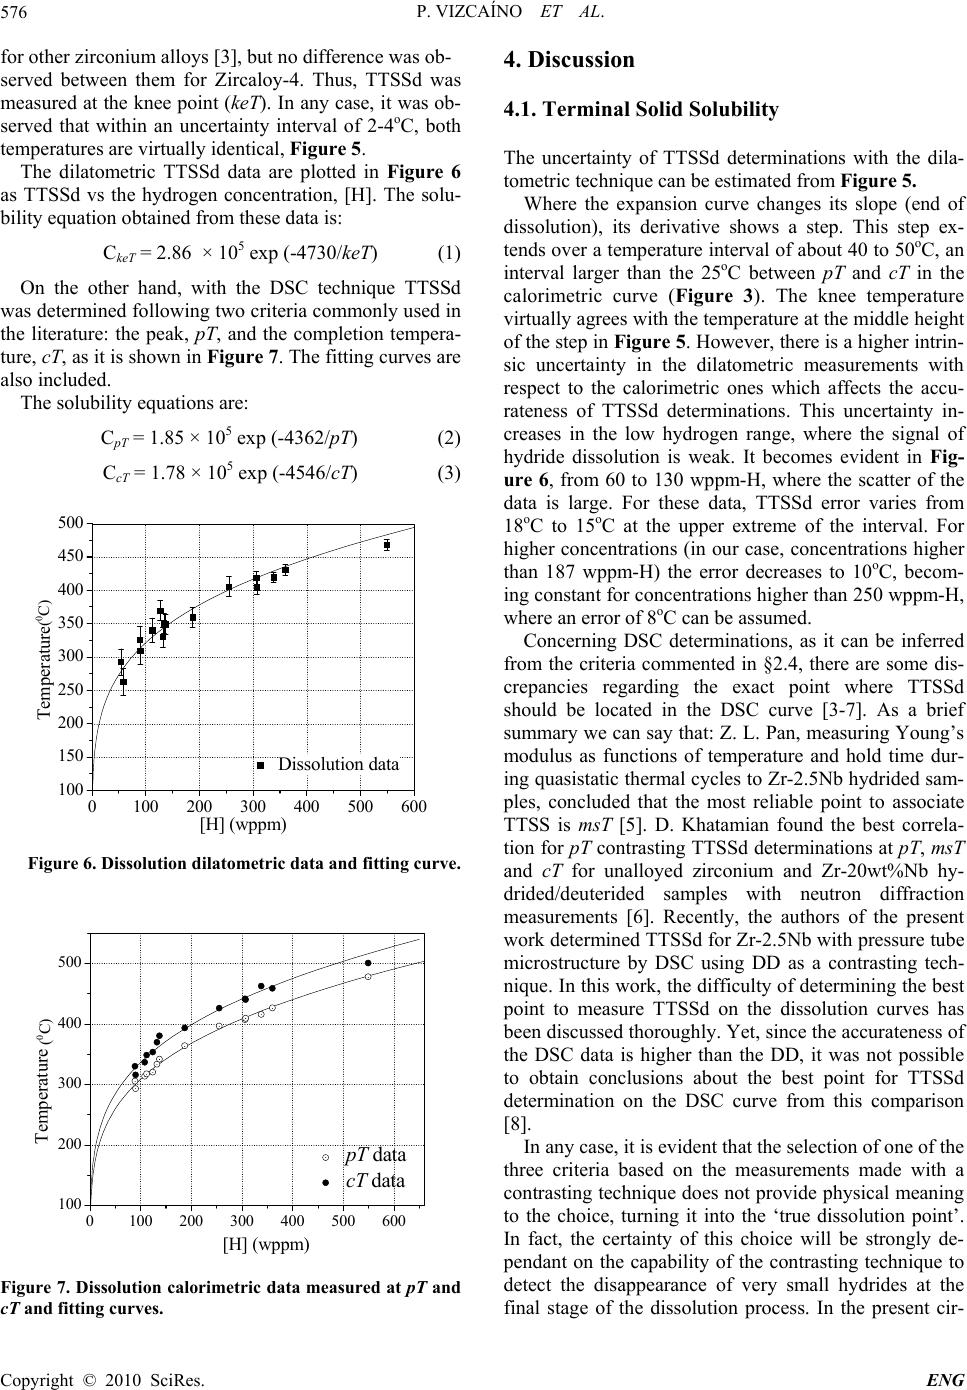 P. VIZCAÍNO ET AL. Copyright © 2010 SciRes. ENG 576 for other zirconium alloys [3], but no difference was ob- served between them for Zircaloy-4. Thus, TTSSd was measured at the knee point (keT). In any case, it was ob- served that within an uncertainty interval of 2-4oC, both temperatures are virtually identical, Figure 5. The dilatometric TTSSd data are plotted in Figure 6 as TTSSd vs the hydrogen concentration, [H]. The solu- bility equation obtained from these data is: CkeT = 2.86 × 10⁵ exp (-4730/keT) (1) On the other hand, with the DSC technique TTSSd was determined following two criteria commonly used in the literature: the peak, pT, and the completion tempera- ture, cT, as it is shown in Figure 7. The fitting curves are also included. The solubility equations are: CpT = 1.85 × 10⁵ exp (-4362/pT) (2) CcT = 1.78 × 10⁵ exp (-4546/cT) (3) 0100 200 300 400 500 600 100 150 200 250 300 350 400 450 500 Dissolution data Temperature (癈) [H] (wppm) Figure 6. Dissolution dilatometric data and fitting curve. 0100 200 300 400 500 600 100 200 300 400 500 pT data cT data Temperature (癈) [H] (wppm) Figure 7. Dissolution calorimetric data measured at pT and cT and fitting curves. 4. Discussion 4.1. Terminal Solid Solubility The uncertainty of TTSSd determinations with the dila- tometric technique can be estimated from Figure 5. Where the expansion curve changes its slope (end of dissolution), its derivative shows a step. This step ex- tends over a temperature interval of about 40 to 50oC, an interval larger than the 25oC between pT and cT in the calorimetric curve (Figure 3). The knee temperature virtually agrees with the temperature at the middle height of the step in Figure 5. However, there is a higher intrin- sic uncertainty in the dilatometric measurements with respect to the calorimetric ones which affects the accu- rateness of TTSSd determinations. This uncertainty in- creases in the low hydrogen range, where the signal of hydride dissolution is weak. It becomes evident in Fig- ure 6, from 60 to 130 wppm-H, where the scatter of the data is large. For these data, TTSSd error varies from 18oC to 15oC at the upper extreme of the interval. For higher concentrations (in our case, concentrations higher than 187 wppm-H) the error decreases to 10oC, becom- ing constant for concentrations higher than 250 wppm-H, where an error of 8oC can be assumed. Concerning DSC determinations, as it can be inferred from the criteria commented in §2.4, there are some dis- crepancies regarding the exact point where TTSSd should be located in the DSC curve [3-7]. As a brief summary we can say that: Z. L. Pan, measuring Young’s modulus as functions of temperature and hold time dur- ing quasistatic thermal cycles to Zr-2.5Nb hydrided sam- ples, concluded that the most reliable point to associate TTSS is msT [5]. D. Khatamian found the best correla- tion for pT contrasting TTSSd determinations at pT, msT and cT for unalloyed zirconium and Zr-20wt%Nb hy- drided/deuterided samples with neutron diffraction measurements [6]. Recently, the authors of the present work determined TTSSd for Zr-2.5Nb with pressure tube microstructure by DSC using DD as a contrasting tech- nique. In this work, the difficulty of determining the best point to measure TTSSd on the dissolution curves has been discussed thoroughly. Yet, since the accurateness of the DSC data is higher than the DD, it was not possible to obtain conclusions about the best point for TTSSd determination on the DSC curve from this comparison [8]. In any case, it is evident that the selection of one of the three criteria based on the measurements made with a contrasting technique does not provide physical meaning to the choice, turning it into the ‘true dissolution point’. In fact, the certainty of this choice will be strongly de- pendant on the capability of the contrasting technique to detect the disappearance of very small hydrides at the final stage of the dissolution process. In the present cir- (0C) (0C)  P. VIZCAÍNO ET AL. Copyright © 2010 SciRes. ENG 577 cumstances we judged that it would be most advisable to choose the criteria that better agree with the highly ref- erenced curve of Kearns [9] and the equilibrium solvus line by Zuzek et al. [10], as done by other authors [3,4]. This comparison is shown in Figure 8. Regarding the DSC data, the best agreement with Kearns and Zuzek equilibrium curves corresponds to the completion point (cT). Beyond the criterion chosen for TTSSd determina- tion, the error at pT, msT or cT is always smaller than 2oC and the reproducibility is excellent. Although the present comparison has shown that DD is less accurate than DSC for solubility determinations, it must be alleged in its favor that the technique was capa- ble to detect the hydride dissolution for samples with concentrations from 60 wppm-H. This implies that the sensitivity is good enough to detect dimensional changes at very low concentrations. Since the main objective of the present work is to detect dimensional changes for hydrogen contents like 200 or 300 wppm-H, typical of cooling channels that remained for about 10 years in the reactor at full power operation [11], the performance of the technique is suitable for these purposes. This matter will be developed in the following section. 4.2. Axial Elongation of a Cooling Channel In order to simulate and determine the total elongation of the cooling channels due to the hydrogen pick up in ser- vice, a similar but faster process must be developed in the laboratory. Hydrogen should be incorporated into the bulk, starting from a hydrogen-free material. Instead of the slow hydrogen incorporation due to the corrosion in service, the hydrogen in the hydride layer diffuses into the bulk during the heating ramp and the subsequent iso- thermal annealing at 550oC. At this stage, the hydrogen in the bulk remains in solid solution and the sample reaches its maximum length. During cooling, the hydro- gen precipitates as hydrides reducing the sample length, but as it was shown in Figure 4, the final length is larger than the initial. After cooling, the final dimension of the sample is measured in situ in the dilatometer, obtaining a differential value. The length increase due to the hydro- gen incorporation into the bulk was measured at room temperature and reported in a recent paper [1]. A linear dependence on the hydrogen concentration was found for fully recrystallized Zircaloy-4. For this type of micro- structure, hydrides precipitate on the grain boundaries, but some tendency to precipitate in the rolling direction 050100 150 200 250 300 350 400 100 200 300 400 500 DSC (pT) Kearns Zuzek Temperature (oC) [H] (wppm) DSC (cT) DD (knee) Figure 8. Comparison between the curves obtained in the present work and classical literature curves. recalling the cold rolling process still subsists after the recrystallization treatment. The competition of these two ways of precipitation generates some scatter in the data. However, a linear model seemed to be a good choice to represent the expansion vs. [H]. The linear assumption was made by simplicity, based on the values of the sta- tistical parameters, considering an error of 0.5 m for the micrometer, Table 1. The following relation was obtained: 5.60.054 [] μm ΔL μmH wppm (1) Dividing Equation (1) by the initial length of the sam- ples from which Equation (1) was obtained (L0 = 18600 m), the relative expansion is: -4-6 1 )3.2 10 3.0010 [] room 0 ΔLH Lwppm (2) where (L/Lo)room is the relative increase after the hy- drogen diffusion into the bulk at room temperature. As the cooling channels operate in the two-phase field, in order to determine the total expansion in service, the contribution of both, the fraction of H atoms in solid so lution and that of the zirconium hydrides at the reactor operating temperature (300oC) should be added to the growth due to the hydrides already present at room tem- perature. The measurements made at 300oC are listed in Table 2. The relation found between the expansions and the hydrogen concentration is linear too. Both, the data and Table 1. Interception, slope, standard errors (SE) and lower and upper confidence limit (LCL and UCL). The standard de- viation (SD) and R-value (R) are also given (97% of confidence). Intercept Slope Statistics Value SE LCL UCL Value SE LCL UCL R SD 5.6 2.0 0.6 10.7 0.054 0.004 0.044 0.064 0.9 5  P. VIZCAÍNO ET AL. Copyright © 2010 SciRes. ENG 578 Table 2. Relative expansion at 300oC. [H] (wppm) l (m) lo (m) l/lo 128 0.85 9781 8.69 E-5 227 5.0 10332 4.81E-4 398 5.7 10035 5.64E-4 358 5.65 10035 5.63E-4 446 9.5 9784 9.75E-4 650 12.9 9968 1.29E-3 the regression line are shown in Figure 9 and the statis- tics parameters in Table 3. The linear equation is: º -4 -6 300 1 )-1.54 10 2.2110 [] C 0 ΔLH Lwppm (3) where ( L/Lo)300oC is the relative length increase of the hydrided sample at 300oC. Then, combining (2) and (3), the total length increase is calculated as follows: º300 000 ))) CTOTAL room ΔLΔLΔL LLL (4) Table 3. Interception, slope, standard errors (SE) and lower and upper confidence limit (LCL and UCL). The standard deviation (SD) and R-value (R) are also given (97% of confidence). Intercept (x 10-4) Slope (x 10-6) Statistics Value SE LCL UCL Value SE LCL UCL R SD -1.54 1.3 -5.5 2.5 2.21 0.33 1.22 3.2 0.96 1.3 x 10⁻⁴ The relative expansion at room temperature and the total relative expansion are both plotted in Figure 9 too. Then, the total relative expansion coefficient along the axial direction at 300oC is 5.21 × 10⁻⁴% per wppm-H. As it was shown in previous works, the hydrogen iso- tope concentration of the cooling channels measured at different positions along its length after 10 years in ser- vice varies between 150 and 400 wppm-H [11]. If we choose a medium concentration of 250 wppm-H for the whole channel, it is possible to estimate the expansion of the tube at the operating temperature for this concentra- tion. Following Equation (4), the relative expansion will be 0.0015 m/m of tube. Then, if we consider the full length of the tube, 5,300 mm, the total expected expan- sion in the axial direction will be 8 mm, with an error estimated in 15%. 100 200 300 400 500 600 0.0000 0.0005 0.0010 0.0015 0.0020 0.0025 0.0030 0.0035 L/LTOTAL o L/Lroom o L/L300oC o [H] (wppm) Rel. expansions at 300oC Linear regressions Error bands L/Lo Figure 9. Relative expansion at 300oC, at room temperature [1] and the sum of both effects. 5. Conclusions The present work was focused on two main objectives: hydrogen solubility measurements and the determination of the expansion coefficient of Zircaloy-4 for the axial direction of a tube. As a brief summary, the following points must be underlined: The hydrogen solid solubility curve for Zir- caloy-4 was determined by two techniques, differential scanning calorimetry and differential dilatometry. The comparison with classical literature curves showed a good agreement with them. The solubility curves ob- tained with calorimetry, measuring TTSSd at the peak and completion temperatures are: CpT = 1.85 × 10⁵ exp (−4362/pT) CcT = 1.78 × 10⁵ exp (−4546/cT) and the one obtained by dilatometry, measuring TTSSd at the knee temperature is: CkeT = 2.86 × 10⁵ exp (−4730/keT) Although the coincidence between them is good, the calorimetric technique is more accurate for these meas- urements. Dilatometry showed good sensitivity to detect the end of dissolution from concentrations around 60 wppm-H up to the eutectoid temperature (550oC) concentration (650 wppm-H), which is a good indicator of the aptitude of the technique to measure dimensional changes in hy- drided samples in this concentration interval. The expansion of Zircaloy-4 homogeneously hydrided samples was measured at 300oC, the typical operating temperature of a nuclear power reactor, obtaining a rela- tive expansion of 2.21 × 10⁻⁴% per wppm-H. Adding to this value the relative expansion coefficient at room tem- perature due to hydriding, the total relative expansion rate is 5.21 × 10⁻⁴% per wppm-H. 6. References [1] J. C. Ovejero, A. D. Banchik and P. Vizcaíno, “Axial/ Tangential Expansion Coefficients of Zircaloy-4 Chan- nels Due to the Hydrogen Pick up,” Advanced in Tech-  P. VIZCAÍNO ET AL. Copyright © 2010 SciRes. ENG 579 nology of Materials and Materials Processing Journal, Vol. 10, No. 1, 2008, pp. 1-8. [2] C. P. Fagundez, P. Vizcaíno, D. Bianchi and A. D. Ban- chik, “Dilatometría del Sistema Zr-H,” Proceedings of the Congress SAM/CONAMET 2005, Mar del Plata, 18-21 October 2005. [3] J. P. Giroldi, P. Vizcaíno, A. V. Flores and A. D. Banchik, “Hydrogen Terminal Solid Solubility Determinations in Zr-2.5 Nb Pressure Tube Microstructure in an Extended Concentration Range,” Journal of Alloys and Compounds, Vol. 474, No. 1-2, 2009, pp. 140-146. [4] D. Khatamian and V. C. Ling, “Hydrogen Solubility Lim- its In - and -Zirconium,” Journal of Alloys and Com- pounds, Vol. 253-254, No. 20, 1997, pp. 162-166. [5] A. McMinn, E. C. Darby and J. S. Schofield, “The Ter- minal Solid Solubility of Hydrogen in Zirconium Al- loys,” Proceedings of the 12th International Symposium of the Zirconium in the Nuclear Industry, ASTM STP 1354, 2000, pp. 173-195. [6] Z. L. Pan and M. P. Puls, “Precipitation and Dissolution Peaks of Hydride in Zr-2.5 Nb during Quasistatic Ther- mal Cycles,” Journal of Alloys and Compounds, Vol. 310, No. 1-2, 2000, pp. 214-218. [7] D. Khatamian and J. H. Root, “Comparison of TSSD Results Obtained by Differential Scanning Calorimetry and Neutron Diffraction,” Journal of Nuclear Materials, Vol. 372, No. 1, 2008, pp. 106-113. [8] P. Vizcaíno, A. D. Banchik and J. P. Abriata, “Calorimet- ric Determination of the -Hydride Dissolution Enthalpy in Zircaloy-4,” Metallurgical and Materials Transactions A, Vol. 35A, No. 8, 2004, pp. 2343-2349. [9] J. Kearns, “Terminal Solubility and Partitioning of Hy- drogen in the Alpha Phase of Zirconium,” Journal of Nu- clear Materials, Vol. 22, No. 3, 1967, pp. 292-303. [10] E. Zuzek, J. P. Abriata and A. San Martín, “H-Zr (Hy- drogen-Zirconium),” Bulletin of Alloy Phase Diagrams, Vol. 11, No. 4, 1990, pp. 385-395. [11] P. Vizcaíno, A. D. Banchik and J. P. Abriata, “Solubility of Hydrogen in Zircaloy-4: Irradiation Induced Increase and Thermal Recovery,” Journal of Nuclear Materials, Vol. 304, No. 2-3, 2002, pp. 96-106. |