Paper Menu >>
Journal Menu >>
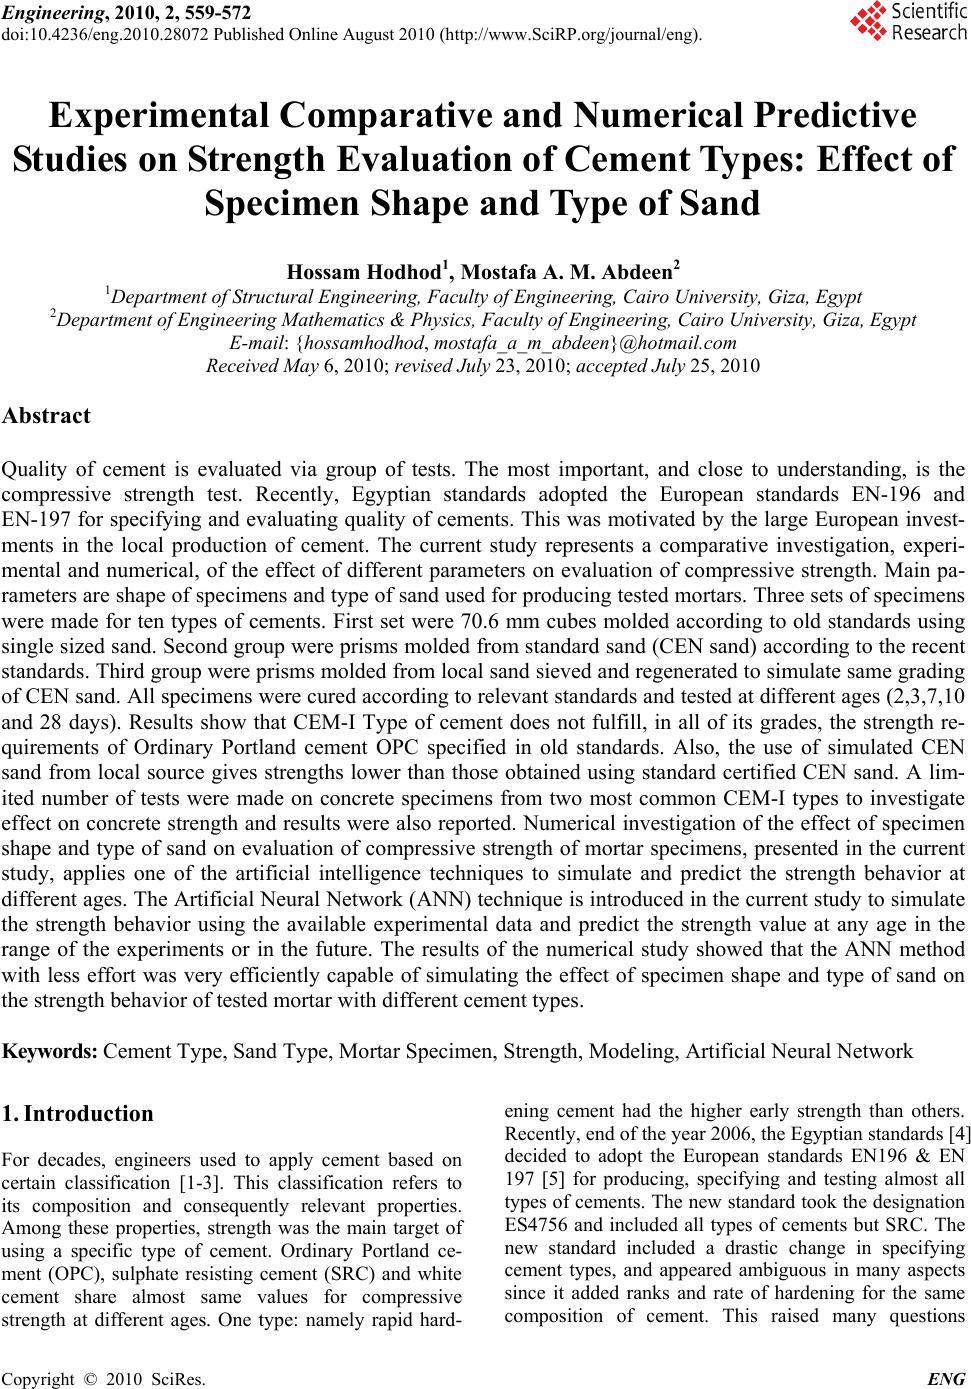 Engineering, 2010, 2, 559-572 doi:10.4236/eng.2010.28072 Published Online August 2010 (http://www.SciRP.org/journal/eng). Copyright © 2010 SciRes. ENG Experimental Comparative and Numerical Predictive Studies on Strength Evaluation of Cement Types: Effect of Specimen Shape and Type of Sand Hossam Hodhod1, Mostafa A. M. Abdeen2 1Department of Structural Engineering, Faculty of Engineering, Cairo University, Giza, Egypt 2Department of Engineering Mathematics & Physics, Faculty of Engineering, Cairo University, Giza, Egypt E-mail: {hossamhodhod, mostafa_a_m_abdeen}@hotmail.com Received May 6, 2010; revised July 23, 2010; accepted July 25, 2010 Abstract Quality of cement is evaluated via group of tests. The most important, and close to understanding, is the compressive strength test. Recently, Egyptian standards adopted the European standards EN-196 and EN-197 for specifying and evaluating quality of cements. This was motivated by the large European invest- ments in the local production of cement. The current study represents a comparative investigation, experi- mental and numerical, of the effect of different parameters on evaluation of compressive strength. Main pa- rameters are shape of specimens and type of sand used for producing tested mortars. Three sets of specimens were made for ten types of cements. First set were 70.6 mm cubes molded according to old standards using single sized sand. Second group were prisms molded from standard sand (CEN sand) according to the recent standards. Third group were prisms molded from local sand sieved and regenerated to simulate same grading of CEN sand. All specimens were cured according to relevant standards and tested at different ages (2,3,7,10 and 28 days). Results show that CEM-I Type of cement does not fulfill, in all of its grades, the strength re- quirements of Ordinary Portland cement OPC specified in old standards. Also, the use of simulated CEN sand from local source gives strengths lower than those obtained using standard certified CEN sand. A lim- ited number of tests were made on concrete specimens from two most common CEM-I types to investigate effect on concrete strength and results were also reported. Numerical investigation of the effect of specimen shape and type of sand on evaluation of compressive strength of mortar specimens, presented in the current study, applies one of the artificial intelligence techniques to simulate and predict the strength behavior at different ages. The Artificial Neural Network (ANN) technique is introduced in the current study to simulate the strength behavior using the available experimental data and predict the strength value at any age in the range of the experiments or in the future. The results of the numerical study showed that the ANN method with less effort was very efficiently capable of simulating the effect of specimen shape and type of sand on the strength behavior of tested mortar with different cement types. Keywords: Cement Type, Sand Type, Mortar Specimen, Strength, Modeling, Artificial Neural Network 1. Introduction For decades, engineers used to apply cement based on certain classification [1-3]. This classification refers to its composition and consequently relevant properties. Among these properties, strength was the main target of using a specific type of cement. Ordinary Portland ce- ment (OPC), sulphate resisting cement (SRC) and white cement share almost same values for compressive strength at different ages. One type: namely rapid hard- ening cement had the higher early strength than others. Recently, end of the year 2006, the Egyptian standards [4] decided to adopt the European standards EN196 & EN 197 [5] for producing, specifying and testing almost all types of cements. The new standard took the designation ES4756 and included all types of cements but SRC. The new standard included a drastic change in specifying cement types, and appeared ambiguous in many aspects since it added ranks and rate of hardening for the same composition of cement. This raised many questions  H. HODHOD ET AL. Copyright © 2010 SciRes. ENG 560 about the actual composition of cement and its properties. Also, questions were raised about the properties of cem- titious mixes for which cement is used and whether the correlations between properties and type of cement will remain the same or not. Besides, methods of testing ce- ment to evaluate its compressive strength were changed from using cubic specimens (70.6 mm side length) [6] to part of prism (with 40 mm square cross section). More- over, the standard dictated the use of specific type of sand, which is not available locally, for making mortar specimens. This sand must be procured from certified suppliers and is called CEN sand. Such a condition raised a question about the role of this sand in hydration process and strength development too. All these ques- tions motivate the need for research to clarify nature of new cement types and declare their properties and effect on properties of cementitious mixes. One local attempt [7] was made and yielded that new standards are efficient. However, the contradictions between test results of the study and the known size effect rule urge the need for more investigation. Since the experimental work needs a lot of effort, time and money, which is quite clear from the literature men- tioned previously, the need for utilizing new methodolo- gies and techniques to reduce this effort, save time and money (and at the same time preserving high accuracy) is urged. Artificial intelligence has proven its capability in simulating and predicting the behavior of the different physical phenomena in most of the engineering fields. Artificial Neural Network (ANN) is one of the artificial intelligence techniques that have been incorporated in various scientific disciplines. Solomatine and Toorres [8] presented a study of using ANN in the optimization loop for the hydrodynamic modeling of reservoir operation in Venezuela. Kheireldin [9] presented a study to model the hydraulic characteristics of severe contractions in open channels using ANN technique. The successful results of his study showed the applicability of using the ANN ap- proach in determining relationship between different parameters with multiple input/output problems. Abdeen [10] developed neural network model for predicting flow characteristics in irregular open channels. The developed model proved that ANN technique was capable with small computational effort and high accuracy of predict- ing flow depths and average flow velocities along the channel reach when the geometrical properties of the channel cross sections were measured or vice versa. Al- lam [11] used the artificial intelligence technique to pre- dict the effect of tunnel construction on nearby buildings which is the main factor in choosing the tunnel route. Allam, in her thesis, predicted the maximum and mini- mum differential settlement necessary precautionary measures. Park and Azmathullah et al. [12] presented a study for estimating the scour characteristics downstream of a ski-jump bucket using Neural Networks (NN). Ab- deen [13] presented a study for the development of ANN models to simulate flow behavior in open channel in- fested by submerged aquatic weeds. Mohamed [14] pro- posed an artificial neural network for the selection of optimal lateral load-resisting system for multi-story steel frames. Mohamed, in her master thesis, proposed the neural network to reduce the computing time consumed in the design iterations. Abdeen [15] utilized ANN tech- nique for the development of various models to simulate the impacts of different submerged weeds' densities, dif- ferent flow discharges, and different distributaries opera- tion scheduling on the water surface profile in an ex- perimental main open channel that supplies water to dif- ferent distributaries. 2. Problem Description To study the effect of specimens shape and types of sand used for producing tested mortars on evaluation of com- pressive as well as flexural tensile strengths, experimen- tal and numerical techniques will be presented in this study. The experimental program and its results will be described in detail in the following sections. After that, numerical approach will be discussed to show the effi- ciency of numerical techniques. The numerical models presented in this study utilized Artificial Neural Network technique (ANN) using the data of experiments and then can predict the strength value in the range of the experi- ment or in the future. 3. Experimental Program The experimental program focuses on evaluating com- pressive strength of mortar made from new cement types. Ten types of cements with different grades and rate of hardening were procured from local market in Egypt. Compressive strength was evaluated for each type using the cubic specimens (70.6 mm side length) and using the testing of part of prism (40*40*160 mm). The last me- thod was employed twice. First with local sand following the same grade specified in ES4756 (and EN 196), and second with certified CEN sand according to same stan- dards. Specimens were tested at ages of 2, 3, 7, 10 and 28 days. Concrete mixes with same proportions were cast from different types of cements. Slump and compressive strength were measured for each mix to investigate the effect of type of cement on concrete properties. Com- pressive strength was measured at 3, 7 and 28 days. 4. Materials and Specimens Constituents for mortar and concrete mixes were: 4.1. Water Tap water was used for mixing and curing of all speci- 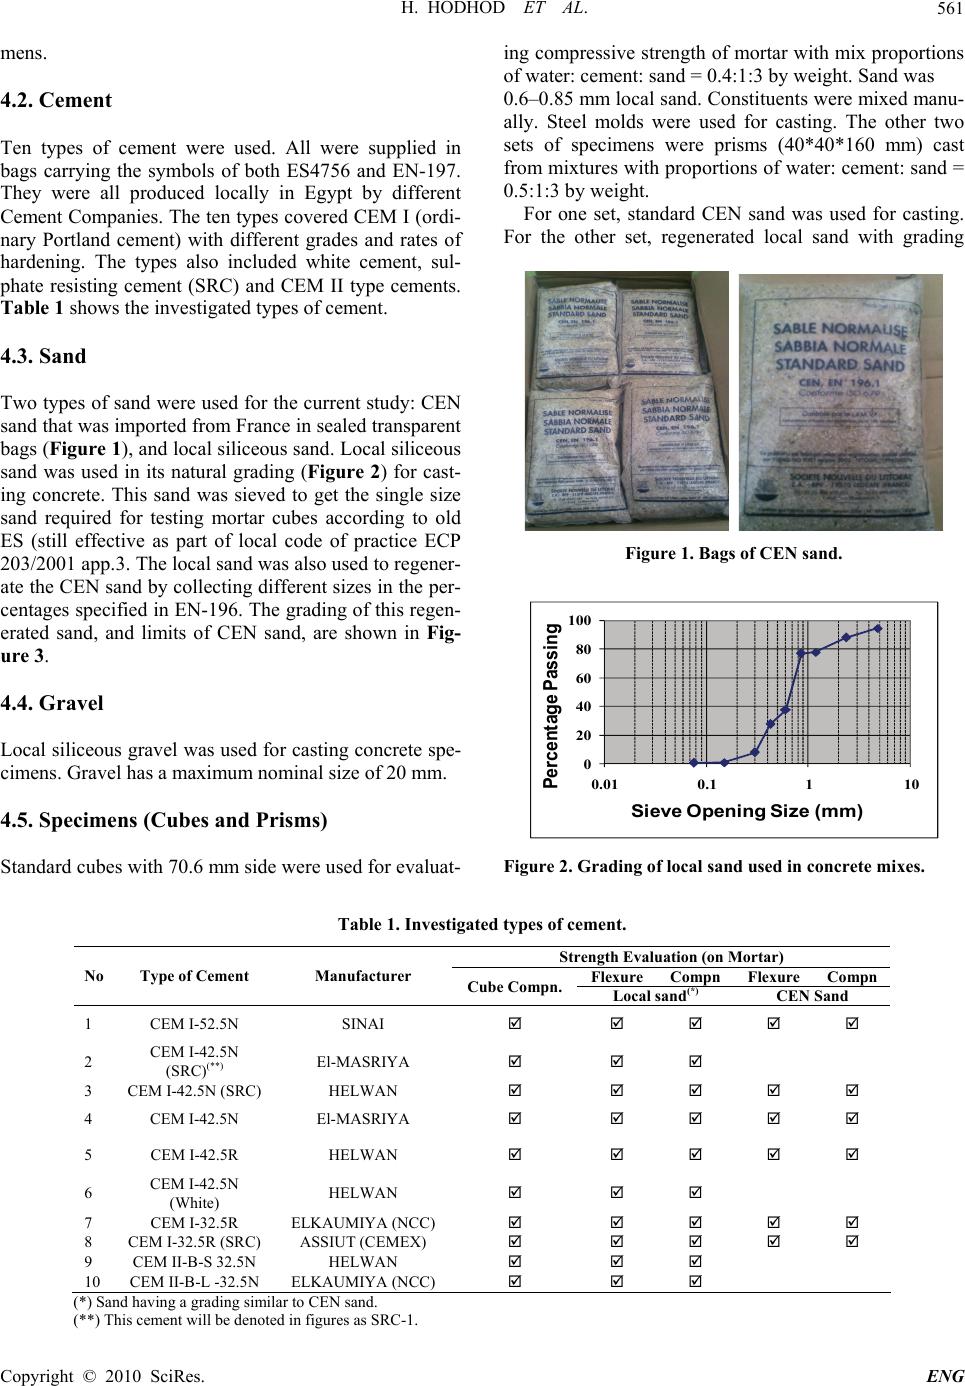 H. HODHOD ET AL. Copyright © 2010 SciRes. ENG 561 mens. 4.2. Cement Ten types of cement were used. All were supplied in bags carrying the symbols of both ES4756 and EN-197. They were all produced locally in Egypt by different Cement Companies. The ten types covered CEM I (ordi- nary Portland cement) with different grades and rates of hardening. The types also included white cement, sul- phate resisting cement (SRC) and CEM II type cements. Table 1 shows the investigated types of cement. 4.3. Sand Two types of sand were used for the current study: CEN sand that was imported from France in sealed transparent bags (Figure 1), and local siliceous sand. Local siliceous sand was used in its natural grading (Figure 2) for cast- ing concrete. This sand was sieved to get the single size sand required for testing mortar cubes according to old ES (still effective as part of local code of practice ECP 203/2001 app.3. The local sand was also used to regener- ate the CEN sand by collecting different sizes in the per- centages specified in EN-196. The grading of this regen- erated sand, and limits of CEN sand, are shown in Fig- ure 3. 4.4. Gravel Local siliceous gravel was used for casting concrete spe- cimens. Gravel has a maximum nominal size of 20 mm. 4.5. Specimens (Cubes and Prisms) Standard cubes with 70.6 mm side were used for evaluat- ing compressive strength of mortar with mix proportions of water: cement: sand = 0.4:1:3 by weight. Sand was 0.6–0.85 mm local sand. Constituents were mixed manu- ally. Steel molds were used for casting. The other two sets of specimens were prisms (40*40*160 mm) cast from mixtures with proportions of water: cement: sand = 0.5:1:3 by weight. For one set, standard CEN sand was used for casting. For the other set, regenerated local sand with grading Figure 1. Bags of CEN sand. 0 20 40 60 80 100 0.01 0.1110 Percentage Passing Sieve Opening Size (mm) Figure 2. Grading of local sand used in concrete mixes. Table 1. Investigated types of cement. Strength Evaluation (on Mortar) Flexure Compn Flexure Compn No Type of Cement Manufacturer Cube Compn.Local sand(*) CEN Sand 1 CEM I-52.5N SINAI 2 CEM I-42.5N (SRC)(**) El-MASRIYA 3 CEM I-42.5N (SRC) HELWAN 4 CEM I-42.5N El-MASRIYA 5 CEM I-42.5R HELWAN 6 CEM I-42.5N (White) HELWAN 7 CEM I-32.5R ELKAUMIYA (NCC) 8 CEM I-32.5R (SRC) ASSIUT (CEMEX) 9 CEM II-B-S 32.5N HELWAN 10 CEM II-B-L -32.5N ELKAUMIYA (NCC) (*) Sand having a grading similar to CEN sand. (**) This cement will be denoted in figures as SRC-1. 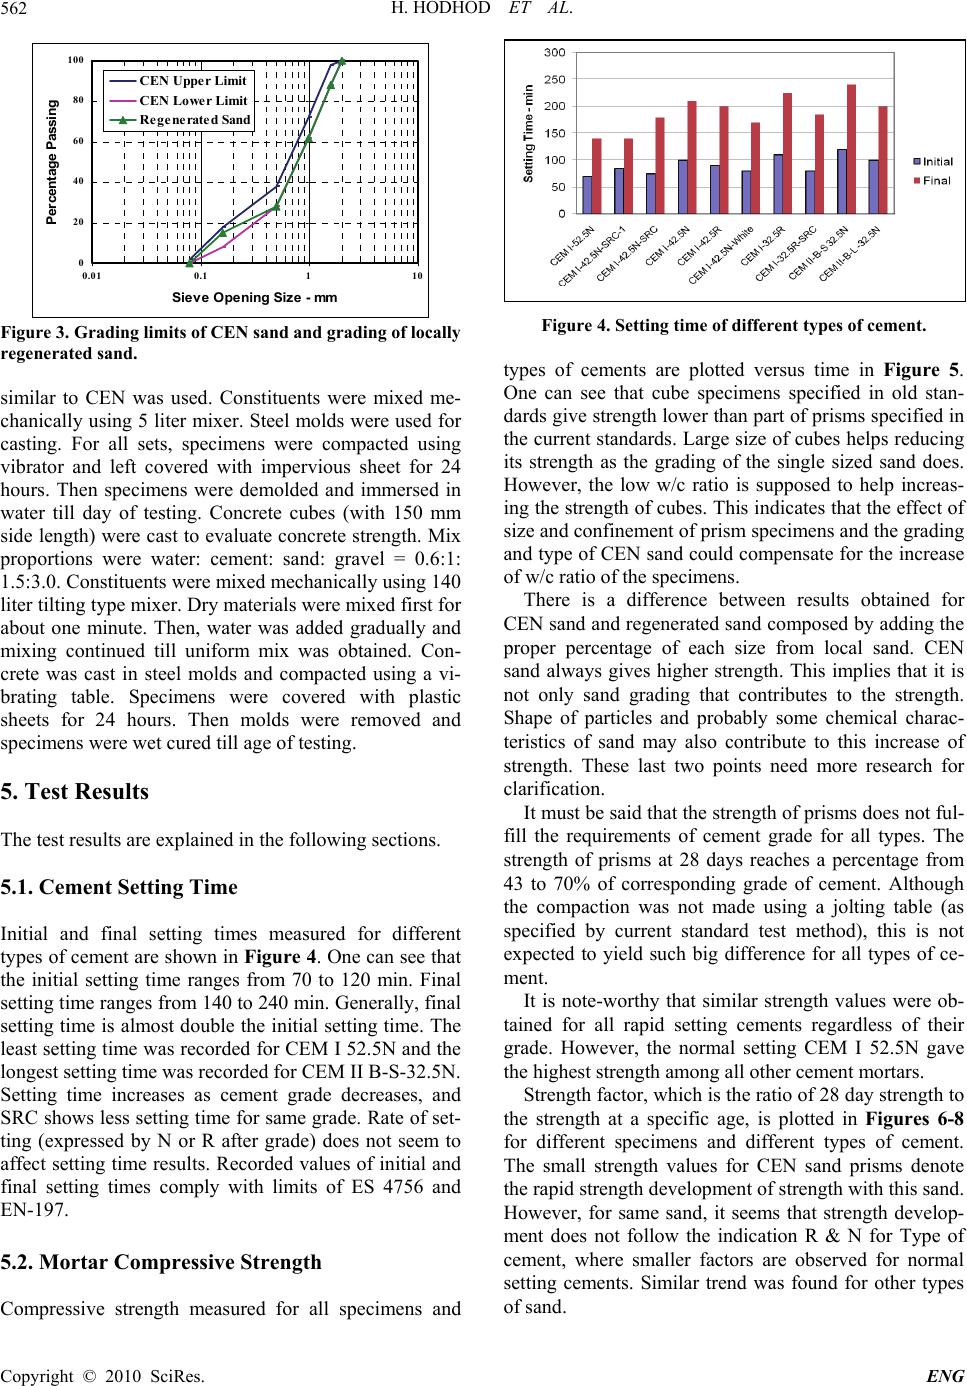 H. HODHOD ET AL. Copyright © 2010 SciRes. ENG 562 0 20 40 60 80 100 0.01 0.1110 Sieve Opening Size - mm Percentage Passing CEN Upper Limit CEN Lower Limit Regenerated Sand Figure 3. Grading limits of CEN sand and grading of locally regenerated sand. similar to CEN was used. Constituents were mixed me- chanically using 5 liter mixer. Steel molds were used for casting. For all sets, specimens were compacted using vibrator and left covered with impervious sheet for 24 hours. Then specimens were demolded and immersed in water till day of testing. Concrete cubes (with 150 mm side length) were cast to evaluate concrete strength. Mix proportions were water: cement: sand: gravel = 0.6:1: 1.5:3.0. Constituents were mixed mechanically using 140 liter tilting type mixer. Dry materials were mixed first for about one minute. Then, water was added gradually and mixing continued till uniform mix was obtained. Con- crete was cast in steel molds and compacted using a vi- brating table. Specimens were covered with plastic sheets for 24 hours. Then molds were removed and specimens were wet cured till age of testing. 5. Test Results The test results are explained in the following sections. 5.1. Cement Setting Time Initial and final setting times measured for different types of cement are shown in Figure 4. One can see that the initial setting time ranges from 70 to 120 min. Final setting time ranges from 140 to 240 min. Generally, final setting time is almost double the initial setting time. The least setting time was recorded for CEM I 52.5N and the longest setting time was recorded for CEM II B-S-32.5N. Setting time increases as cement grade decreases, and SRC shows less setting time for same grade. Rate of set- ting (expressed by N or R after grade) does not seem to affect setting time results. Recorded values of initial and final setting times comply with limits of ES 4756 and EN-197. 5.2. Mortar Compressive Strength Compressive strength measured for all specimens and Figure 4. Setting time of different types of cement. types of cements are plotted versus time in Figure 5. One can see that cube specimens specified in old stan- dards give strength lower than part of prisms specified in the current standards. Large size of cubes helps reducing its strength as the grading of the single sized sand does. However, the low w/c ratio is supposed to help increas- ing the strength of cubes. This indicates that the effect of size and confinement of prism specimens and the grading and type of CEN sand could compensate for the increase of w/c ratio of the specimens. There is a difference between results obtained for CEN sand and regenerated sand composed by adding the proper percentage of each size from local sand. CEN sand always gives higher strength. This implies that it is not only sand grading that contributes to the strength. Shape of particles and probably some chemical charac- teristics of sand may also contribute to this increase of strength. These last two points need more research for clarification. It must be said that the strength of prisms does not ful- fill the requirements of cement grade for all types. The strength of prisms at 28 days reaches a percentage from 43 to 70% of corresponding grade of cement. Although the compaction was not made using a jolting table (as specified by current standard test method), this is not expected to yield such big difference for all types of ce- ment. It is note-worthy that similar strength values were ob- tained for all rapid setting cements regardless of their grade. However, the normal setting CEM I 52.5N gave the highest strength among all other cement mortars. Strength factor, which is the ratio of 28 day strength to the strength at a specific age, is plotted in Figures 6-8 for different specimens and different types of cement. The small strength values for CEN sand prisms denote the rapid strength development of strength with this sand. However, for same sand, it seems that strength develop- ment does not follow the indication R & N for Type of cement, where smaller factors are observed for normal setting cements. Similar trend was found for other types of sand.  H. HODHOD ET AL. Copyright © 2010 SciRes. ENG 563 Figure 5. Compressive strength of mortar specimens produced under different conditions, for different types of cement.  H. HODHOD ET AL. Copyright © 2010 SciRes. ENG 564 Figure 6. Strength factor for mortar prisms produced from CEN sand (left: rapid setting cements, right: normal setting ce- ments). Figure 7. Strength factor for mortar prisms produced from regenerated sand (left: rapid setting cements, right: normal set- ting cements). Figure 8. Strength factor for mortar cubes (left: rapid setting cements, right: normal setting cements). 5.3. Mortar Tensile Strength Flexural tensile strength was measured for prism speci- mens since it is the first step in producing compression specimens. Measured flexural strength for all types of cements and for different sands are plotted in Figure 9. One can observe the effect of CEN sand in increasing strength of mortar. This effect confirms the above men- tioned need for investigation of particle shape and chem- ical reactivity of CEN sand. One more finding can be found when tensile flexural strength is plotted versus compressive strength at differ- ent ages, as in Figure 10. It can be seen that there exists a significant increase of tensile strength between 7 and 28 days. This could be observed for both types of sand. This implies that the correlation between flexural strength and compressive strength is significantly different at early and later ages. 5.4. Concrete Slump Concrete slump measuring results are shown in Figure 11 for all cement types. One can identify 3 main ranges of slump: 0-40 mm, 40-80 mm, and 80-120 mm. First low range of slump was recorded for rapid setting ce- ments and 52.5 grade cement. Highest slump range was 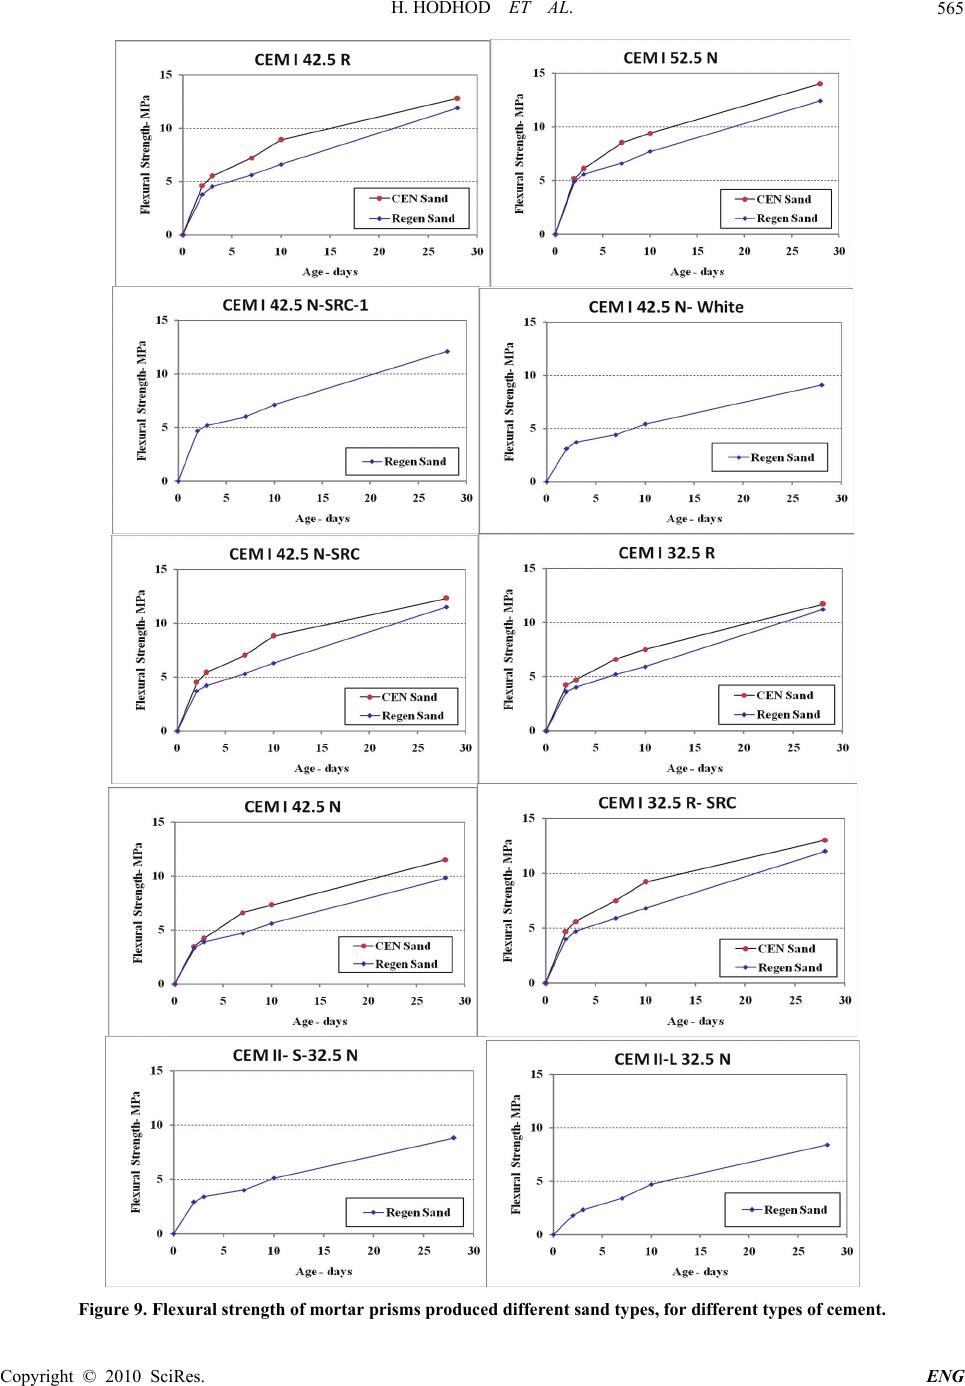 H. HODHOD ET AL. Copyright © 2010 SciRes. ENG 565 Figure 9. Flexural strength of mortar prisms produced different sand types, for different types of cement.  H. HODHOD ET AL. Copyright © 2010 SciRes. ENG 566 Figure 10. Flexural strength vs. compressive strength (left: cen sand, right: regenerated sand). Figure 11. Slump values for different types of cement. observed for CEM II cements. The medium grade was observed for the rest normal setting CEM I type of ce- ment. Since the water consumption is related to rates of hydration and heat evolution. One can conclude that grade 52.5 has high rate of hydration. It is noteworthy that CEM I 52.5R does not exist in local Egyptian mar- ket. The high slump of CEM II cement mixes can be correlated to low clinker content. 5.5. Concrete Compressive Strength Measured values of concrete compressive strength are plotted versus age, for all types of cement, in Figure 12. Generally, one can see in Figure 12 that the effect of cement grade can be distinguished in the limits where top curve belongs to grade 52. N and bottom curve belongs to grade 32.5 N. Curves for higher grades of cement are shown in Figure 13 Left. One can see that, up to 7 days all 42.5 grade cements show almost same strength. How- ever, at later ages (28 days) the rapid setting type shows higher strength than the normal setting ones. One can also see that SRC cement show slightly higher strength than similar 42.5 N cements. Curves for low grade ce- ments are shown in Figure 13 Right. The effect of setting rate can be identified between 32.5N and 32.5R cements. Still SRC cement shows higher strength at 28 days. Figure 14 shows strength development for rapid setting and normal setting cements, respectively. For rapid set- ting cements, there is no difference between early age 0 5 10 15 20 25 30 0102030 Age - days Concrete Compressive Strength (MPa) CEM I 52.5N CEM I 42.5N-SRC CEM I 42.5N CEM I 42.5R CEM I 42.5N white CEM I 32.5R CEM I 32.5R (SRC) CEM II-B-S32.5N CEM II B-L32.5N Figure 12. Measured concrete compressive strength for different types of cement. strength of different grades of cement. At 28 days, SRC of 32.5 grade yields same strength as 42.5 grade. For normal setting cements, there is a clear distinction be- tween strength of different grades at all ages. Strength ratio at 28 days is almost proportional to grade of cement. One can still observe that SRC show higher values of strength than other CEM I cements of same grade. 6. Numerical Model Structure Neural networks are models of biological neural struc- tures. Briefly, the starting point for most networks is a model neuron as shown in Figure 15. This neuron is con- nected to multiple inputs and produces a single output. Each input is modified by a weighting value (w). The neuron will combine these weighted inputs with refer- ence to a threshold value and an activation function, will determine its output. This behavior follows closely the real neurons work of the human’s brain. In the network structure, the input layer is considered a distributor of the signals from the external world while hidden layers are considered to be feature detectors of such signals. On the other hand, the output layer is considered as a collector of the features detected and the producer of the response. 6.1. Neural Network Operation It is quite important for the reader to understand how the  H. HODHOD ET AL. Copyright © 2010 SciRes. ENG 567 0 5 10 15 20 25 30 0102030 Age - days Concrete Compressive Strength (MPa) CEM I 52.5N CEM I 42.5N-SRC CEM I 42.5N CEM I 42.5R CEM I 42.5N white 0 5 10 15 20 25 30 0102030 Age - days Concrete Compressive Strength (MPa) CEM I 32.5R CEM I 32.5R-SRC CEM II-B-S32.5N CEM II B-L32.5N Figure 13. Measured concrete compressive strength (left: high grades of cement, right: low grades of cement). 0 5 10 15 20 25 30 0102030 Age - days Concrete Compressive Strength (MPa) CEM I 42.5R CEM I 32.5R CEM I 32.5R-SRC 0 5 10 15 20 25 30 0102030 Age - days Concrete Compressive Strength (MPa) CEM I 52.5N CEM I 42.5N-SRC CEM I 42.5N CEM I 42.5N white CEM II-B-S32.5N CEM II B-L32.5N Figure 14. Measured concrete compressive strength (left: rapid setting cements, right: normal setting cements). Figure 15. Typical picture of a model neuron that exists in every neural network. neural network operates to simulate different physical problems. The output of ach neuron is a function of its inputs (Xi). In more details, the output (Yj) of the jth neu- ron in any layer is described by two sets of equations as follows: j iij UXw (1) and j th jj YFUt (2) For every neuron, j, in a layer, each of the i inputs, Xi, to that layer is multiplied by a previously established weight, wij. These are all summed together, resulting in the internal value of this operation, Uj. This value is then biased by a previously established threshold value, tj, and sent through an activation function, Fth. This activation function can take several forms such as Step, Linear, Sigmoid, Hyperbolic, and Gaussian functions. The Hy- perbolic function, used in this study, is shaped exactly as the Sigmoid one with the same mathematical representa- tion, as in Equation (3), but it ranges from –1 to +1 rather than from 0 to 1 as in the Sigmoid one. 1 1 x fx e (3) The resulting output, Yj, is an input to the next layer or it is a response of the neural network if it is the last layer. In applying the Neural Network technique, in this study, Neuralyst Software, Shin [16], was used. 6.2. Neural Network Training The next step in neural network procedure is the training operation. The main purpose of this operation is to tune up the network to what it should produce as a response. From the difference between the desired response and the actual response, the error is determined and a portion of it is back propagated through the network. At each neuron in the network, the error is used to adjust the weights and the threshold value of this neuron. Conse- quently, the error in the network will be less for the same  H. HODHOD ET AL. Copyright © 2010 SciRes. ENG 568 inputs at the next iteration. This corrective procedure is applied continuously and repetitively for each set of in- puts and corresponding set of outputs. This procedure will decrease the individual or total error in the responses to reach a desired tolerance. Once the network reduces the total error to the satis- factory limit, the training process may stop. The error propagation in the network starts at the output layer with the following equations: ' ijijj i wwLReX (4) and, 1 j jjjj eY YdY (5) where, wij is the corrected weight, w’ ij is the previous weight value, LR is the learning rate, ej is the error term, Xi is the ith input value, Yj is the ouput, and dj is the de- sired output. 7. Simulation Models To fully investigate numerically the effect of specimen shape and type of sand on the strength behavior of tested mortar with different cement types, seven models are considered in this study. Two models for sitting time (initial and final), model for cube compression strength, two models for prism compression strength (CEN and regenerated sand) and two models for flexural strength (CEN and regenerated sand). 7.1. Neural network Design To develop a neural network models to simulate the ef- fect of specimen shape and type of sand on the strength behavior of tested mortar, first input and output variables have to be determined. What we have in the current study, to be considered as an input variable, is the types of cement used in the mortar specimen. So from the name of cement type we have to create a certain numeric characteristic values could be used as input variables in the present models as shown in Table 2. Table 3 is designed to summarize all neural network key input variables and output for all the seven models presented in the current study. Some abbreviations used in Table 3 due to space limitation as follows: Str.: Strength Compn.: Compression Flex.: Flexural Table 2. Characteristic values for types of cement. No Type of Cement I or II 32.5 or 42.5 or 52.5 N or RA or BS or LSRC or White Manufacturer 1 CEM I-52.5N 1 52.5 19 100 0 60 0 2 CEM I-42.5N (SRC) (**) 1 42.5 19 100 0 67 1 3 CEM I-42.5N (SRC) 1 42.5 19 100 0 67 2 4 CEM I-42.5N 1 42.5 19 100 0 60 0 5 CEM I-42.5R 1 42.5 23 100 0 60 0 6 CEM I-42.5N (White) 1 42.5 19 100 0 50 0 7 CEM I-32.5R 1 32.5 23 100 0 60 0 8 CEM I-32.5R (SRC) 1 32.5 23 100 0 67 0 9 CEM II-B-S-32.5N2 32.5 19 60 24 50 0 10 CEM II-B-L-32.5N2 32.5 19 60 12 50 0 Table 3. Key input variables and output for all ANN models. Input Variables Model I or II 32.5 or 42.5 or 52.5 N or R A or B S or L SRC or White Manufacturer Days Output Initial Sitting Time Initial Time Final Sitting Time Final Time Cube Str. Compn. Str. Prism Str. (CEN sand) Compn. Str. Prism Str. (Regenerated) Compn. Str. Prism Flex. Str. (CEN) Flex. Ten. Str. Prism Flex. Str. (Regenerated) Flex. Ten. Str.  H. HODHOD ET AL. Copyright © 2010 SciRes. ENG 569 Ten.: Tensile Several neural network architectures are designed and tested for all simulation models investigated in this study to finally determine the best network models to simulate, very accurately, the effect of specimen shape and type of sand on the strength behavior of tested mortar with dif- ferent cement types based on minimizing the Root Mean Square Error (RMS-Error). Figure 16 shows a schematic diagram for a generic neural network. The training pro- cedure for the developed ANN models, in the current study, uses the experimental data presented in the previ- ous sections of the current study. After the ANN models are settled for all cases, prediction procedure takes place to predict the compression as well as tensile strengths at different age-days rather than those days measured in the experiment (internal and after 28 days). Table 4 shows the final neural network models for the seven simulation models and their associate number of neurons. The input and output layers represent the key input and output variables described previously for each simulation model. The parameters of the various network models devel- oped in the current study for the different simulation models are presented in Table 5. These parameters can be described with their tasks as follows: Learning Rate (LR): determines the magnitude of the correction term applied to adjust each neuron’s weights during training process = 1 in the current study. Momentum (M): determines the “life time” of a cor- rection term as the training process takes place = 0.9 in the current study. Training Tolerance (TRT): defines the percentage error allowed in comparing the neural network output to the target value to be scored as “Right” during the train- ing process = 0.001 in the current study. Testing Tolerance (TST): it is similar to Training Tolerance, but it is applied to the neural network outputs and the target values only for the test data = 0.003 in the current study. Input Noise (IN): provides a slight random variation to each input value for every training epoch = 0 in the current study. Figure 16. General schematic diagram of a simple generic neural network. Table 4. The developed neural network models. No. of Neurons in each Layer Simulation Model No. of Layers Input Layer First Hidden Second Hidden Third Hidden Output Layer Initial Sitting Time 4 7 5 3 - 1 Final Sitting Time 4 7 5 3 - 1 Cube Str. 5 8 6 4 2 1 Prism Str. (CEN sand) 5 4 4 3 2 1 Prism Str. (Regenerated) 5 8 6 4 2 1 Prism Flex. Str. (CEN) 5 4 4 3 2 1 Prism Flex. Str. (Regenerated) 5 8 6 4 2 1 Input # 1 Input # 2 Output # 1 Output # 2 Hidden layer 3 neurons Hidden layer 3 neurons  H. HODHOD ET AL. Copyright © 2010 SciRes. ENG 570 Table 5. Parameters used in the developed neural network models. Simulation Parameter Initial Sitting Time Final Sitting Time Cube Str. Compn. Str. (CEN) Compn. Str. (Re- generated) Flex. Str. (CEN) Flex. Str. (Re- generated) Training Ep- ochs 1146 4985 672361 301098 179853 315475 505672 MPRE 0.067 0.034 1.175 0.174 0.281 1.512 0.321 RMS-Error 0.0005 0.0005 0.0008 0.0004 0.0003 0.0016 0.0002 Function Gain (FG): allows a change in the scaling or width of the selected function = 1 in the current study. Scaling Margin (SM): adds additional headroom, as a percentage of range, to the rescaling computations used by Neuralyst Software, Shin (1994), in preparing data for the neural network or interpreting data from the neural network = 0.1 in the current study. Training Epochs: number of trails to achieve the pre- sent accuracy. Percentage Relative Error (PRR): percentage rela- tive error between the numerical results and actual meas- ured value and is computed according to Equation (6) as follows: PRE = (Absolute Value (ANN_PR –AMV)/AMV)* 100 (6) where: ANN_PR: Predicted results using the developed ANN model AMV: Actual Measured Value MPRE: Maximum percentage relative error during the model results for the training step. 8. Results and Discussions Numerical results using ANN technique will be pre- sented in this section for all the seven models. Due to space limitation in the present paper the numerical re- sults of one type of cement (CEM I 52.5N) will be pre- sented to show the simulation and prediction powers of ANN technique for compressive as well as tensile strengths. 8.1. Sitting Time For the sitting time models (initial and final), Table 6 presents the ANN results with experimental ones. One can see from this table that ANN technique can simulate very efficient the experiment results for different types of cements for mortar specimens. 8.2. Mortar Compressive Strength Three ANN models are developed to simulate and pre- dict the effect of specimen shape and type of sand on evaluating the compressive strength of mortar specimens for all the types of cement presented in the current study at different ages. Figures 17 and 18 show the ANN results and experimental ones for compressive strength (cube and prism specimens) for one type of cement at the ages of experiment (2,3,7,10,28 days) and then predict the behavior at 14 days (internally) and after 28 days up to 42 days (externally). From these figures, it is very clear that ANN technique succeeded very well to simu- late and predict the compressive strength behavior at different ages for different specimens. 8.3. Mortar Tensile Strength Another two ANN models are developed to simulate and predict the flexural tensile strength for prism specimen for two types of sand (CEN and Regenerated) at different ages. Figure 19 presents the numerical results and ex- perimental ones at the ages of experiments (2,3,7,10,28 days). One can observe that ANN technique can simulate the tensile behavior and then predict the strength at ages different than the ages of experiment (before and after 28 days) very successfully. 9. Conclusions Based on the experimental investigation conducted in the course of the current research, the following can be con- cluded: 1) There is an inverse proportion between setting time and cement grade, and a direct proportion between grade and water requirement for standard consistency. 2) Applying old cement standards, for testing and evaluating mortar compressive strength of cement mor- tar, results in rejection of new cement types. Using of CEMI52.5N 0.0 5.0 10.0 15.0 20.0 25.0 0 1020304050 Age - days Compressive Strength- Mp a Expe rime nt ANN Training ANN Prediction Figure 17. Cube compressive strength.  H. HODHOD ET AL. Copyright © 2010 SciRes. ENG 571 Table 6. Sitting time models results. Simulation Model No. 1 No. 2 No. 3 No. 4 No. 5 No. 6 No. 7 No. 8 No. 9 No. 10 Exp. 70.0 85.0 75.0 100.0 90.0 80.0 110.0 80.0 120.0 100.0 Initial ANN 69.9 84.9 75.0 100.0 89.9 79.9 109.9 80.0 119.9 100.0 Exp. 140.0 140.0 180.0 210.0 200.0 170.0 225.0 185.0 240.0 200.0 Final ANN 140.0 140.0 180.0 210.0 200.0 170.0 225.0 185.0 240.0 200.0 CEMI52.5N 0 5 10 15 20 25 30 0 1020304050 Age - days Compressive Strength- Mpa Ex periment ANN Training ANN Prediction CEMI52.5N 0.0 5.0 10.0 15.0 20.0 25.0 30.0 01020304050 Age - days Compressive Strength- Mpa Experime nt ANN Training ANN Prediction Figure 18. Prism compressive strength (left: cen sand, right: regenerated sand). CEMI52.5N 0 4 8 12 16 01020304050 Age - days Flexural Strength - M P Expe riment ANN Training ANN Prediction CEMI52.5N 0 4 8 12 16 0 1020304050 Age - days Flexural Strength - M P Expe riment ANN Training ANN Prediction Figure 19. Prism flexural strength (left: cen sand, right: regenerated sand). jolting table for compaction is essential for obtaining successful test results according to new standards (EN 196 and ES 4756). 3) Standard CEN sand cannot be regenerated locally based only on its grading. Further investigation is re- quired to get its other properties like particle shape and chemical reactivity. There is some evidence on having early strength development when CEN sand is used in mortar. 4) Sulphate resisting cements show higher strength than CEM I cements of same grade, for both mortar and concrete mixtures. 5) There is some evidence that locally available ce- ments do not follow the rate of strength development denoted on packs. 6) For normal setting cements (N coded) there is a clear distinction between concrete strength obtained for specific cement grade. However, this could not be seen for rapid setting types (R coded). 7) Correlation between flexural tensile and compres- sive strength of mortar differs significantly between early and later ages. Based on the results of implementing the ANN tech- nique in this study, the following can be concluded: 1) The developed ANN models presented in this study are very successful in simulating the effect of specimen shape and type of sand on the behavior of mortar speci- mens (initial and sitting times, compressive strength, flexural tensile strength) for different types of cement. 2) The presented ANN models are very efficiently ca- pable of predicting the strength behavior at different ages rather than the ages of the experimental results (in the  H. HODHOD ET AL. Copyright © 2010 SciRes. ENG 572 range of the experiment or in the future). 10. Acknowledgements The Authors would like to express their gratitude to- wards Prof. Dr. Farouk El-Hakim of 15th May institute for Civil and Arch. Engineering, and undergraduate stu- dents (4th year– civil) for the help they provided during the experimental part of this research. 11. References [1] A. M. Neville, “Properties of Concrete,” John Wiley & Sons, New York, 1997. [2] S. H. Kosmatka, et al., “Design and Control of Concrete Mixtures,” 5th Edition, Cement Association of Canada, Ottawa, 2002. [3] Egyptian Standards (ES) 372, “Standards of Ordinary and Rapid Hardening Portland Cements,” Egyptian General Authority for Standards, Cairo, 1991. [4] Egyptian Standards (ES) 5476, “Standards of Cements,” Egyptian General Authority for Standards, Cairo, 2007 [5] EN 197, “CEMENT: Part 1: Composition, Specifications and Conformity Criteria for Common Cements,” 2004. [6] Egyptian Code of Practice 203, “Basics of Design and regulations of Construction of Reinforced Concrete Structures: Appendix III, Guide for Testing of Concrete Materials,” Egyptian Ministry of Housing, Egypt, 2001. [7] K. M. Yosri, “Properties of New Cements Produced in Egypt as per ES 4756/2005,” HBRC Journal, Vol. 3, No. 3, 2007, pp. 23-33. [8] D. Solomatine, and L. Toorres, “Neural Network Ap- proximation of a Hydrodynamic Model in Optimizing Reservoir Operation,” Proceedings of the 2nd Interna- tional Conference on Hydroinformatics, Zurich, 1996, pp. 201-206. [9] K. A. Kheireldin, “Neural Network Application for Mod- eling Hydraulic Characteristics of Severe Contraction,” Proceedings of the 3rd Internetional Conference, Hydro- informatics, Copenhagen, 24-26 August 1998, pp. 41-48. [10] M. A. M. Abdeen, “Neural Network Model for predicting Flow Characteristics in Irregular Open Channel,” Scien- tific Journal, Faculty of Engineering-Alexandria Univer- sity, Vol. 40, No. 4, 2001, pp. 539-546. [11] B. S. M. Allam, “Artificial Intelligence Based Predictions of Precautionary Measures for Building Adjacent to Tun- nel Rout during Tunneling Process,” Ph.D. Thesis, Fac- ulty of Engineering, Cairo University, Giza, 2005. [12] H. Azmathullah, M. C. Deo and P. B. Deolalikar, “Neural Networks for Estimation of Scour Downstream of a Ski-Jump Bucket,” Journal of Hydrologic Engineering, ASCE, Vol. 131, No. 10, 2005, pp. 898-908. [13] M. A. M. Abdeen, “Development of Artificial Neural Network Model for Simulating the Flow Behavior in Open Channel Infested by Submerged Aquatic Weeds,” Journal of Mechanical Science and Technology, KSME International Journal, Vol. 20, No. 10, 2006, pp. 1691- 1879. [14] M. A. M. Mohamed, “Selection of Optimum Lateral Load-Resisting System Using Artificial Neural Net- works,” M.Sc. Thesis, Faculty of Engineering, Cairo University, Giza, 2006. [15] M. A. M. Abdeen, “Predicting the Impact of Vegetations in Open Channels with Different Distributaries Opera- tions on Water Surface Profile using Artificial Neural Networks,” Journal of Mechanical Science and Technol- ogy, KSME International Journal, Vol. 22, 2008, pp. 1830-1842. [16] Y. Shin, “NeuralystTM User’s Guide—Neural Network Technology for Microsoft Excel,” Cheshire Engineering Corporation Publisher, 1994. |