 Open Journal of Modern Linguistics 2012. Vol.2, No.4, 159-169 Published Online December 2012 in SciRes (http://www.SciRP.org/journal/ojml) http://dx.doi.org/10.4236/ojml.2012.24021 Copyright © 2012 SciRes. 159 The Effect of Interviewers’ and Respondents’ Accent and Gender on Willingness to Cooperate in Telephone Surveys Marie-José Palmen, Marinel Gerritsen, Renée van Bezooijen Department of Business Communication Studies, Radboud University, Nijmegen, The Netherlands Email: M.Gerritsen@let.ru.nl Received August 29th, 2012; revised September 24th, 2012; accepted October 3rd, 2012 This article presents two real-life experiments that investigate whether an interviewer’s accent and gender combined with a respondent’s accent and gender have an impact on telephone survey cooperation rates. Expectations were based on the authority and liking principles of the compliance theory. In Study 1, 12 standard-speaking interviewers (6 men, 6 women) and 12 interviewers with a regional accent (6 men, 6 women) called 1925 male and female respondents (speaking either the standard or the regional variety). In Study 2, a female interviewer who mastered the standard accent and the regional variety, called 120 respondents from the same categories as in Study 1. The expectations were not confirmed. Interviewers with authority (male, speaking standard Dutch) had no more success than interviewers with less authority (female, speaking a regional accent), and agreement of gender and accent between interviewer and re- spondent had no impact on the level of cooperation of the respondents. The results seem to indicate that it is not necessary for research bureaus to reject potential employees with a regional accent or with a less authoritative voice, and that they do not need to make an effort to match interviewers and respondents in characteristics such as gender and accent. Keywords: Response Rate; Cooperation; Authority Principle; Liking Principle; Agreement Interviewer Respondent; Selection Interviewers Introduction Since the 1970s, research bureaus all over the world have observed serious decreases in response rates (Steeh, 1981; De Heer, 1999; De Leeuw & de Heer, 2002; Couper & De Leeuw, 2003; Curtin et al., 2005; Groves, 2011), especially in metro- politan areas (Steeh et al., 2001; Feskens et al., 2007). This is alarming in view of the possible consequences for the gener- alizability of the results of surveys because nonrespondents may differ systematically from respondents and consequently increase the potential for bias due to nonresponse error (Groves & Couper, 1996a). This may lead, for instance, to faulty policy decisions by politicians. Visscher (1999a, 1999b) gives an ex- ample of the detrimental effect that nonresponse may have. In a study into living conditions and political interests, nonresponse among people with a low level of education was twice as high as among people with a high level of education. The results, therefore, showed a distorted picture. There is no simple relationship between a nonresponse rate and nonresponse bias. Nonresponse does not necessarily lead to nonresponse bias, and there is neither a minimum response rate below which a survey estimate is necessarily biased nor a re- sponse rate above which it is never biased (Curtin et al., 2000; Keeter et al., 2000; Bethlehem, 2002; Merkle & Edelman, 2002; Groves, 2006; Groves & Peytcheva, 2008; Stoop et al., 2010). Stoop (2005) states that the hunt for the last respondents is becoming increasingly difficult and costly, and may not be altogether effective, since it does not necessarily decrease se- lective nonresponse (Van Ingen et al., 2009) and may even increase nonresponse bias. An exit poll experiment by Merkle et al. (1998) in the US showed, for example, that a pen incen- tive increased response rates, but also led to higher response bias, since it only increased the response among Democratic Party voters and not among Republicans. Problems associated with the increasing nonresponse rates exercise minds all over the world as shown by the fact that in 2011 the 21st anniversary of the International Workshop on Household Survey Nonresponse was held. This workshop has been held every year, and in 1999, culminated in the large In- ternational Conference on Survey Nonresponse (1999). A se- lection of the papers from this conference was published by Groves et al. (2002). Another indication is that special issues on nonresponse have been published (i.e., the Journal of Official Statistics of June 1999, 2001 and 2011, the Journal of the Royal Statistical Society: Series A (Statistics and Society) of July 2006, the Public Opinion Quarterly of October 2006) and that an avalanche of articles on reducing nonresponse have appeared: among others, Singer et al. (1999), Groves & McGonagle (2001), Feskens et al. (2007), de Leeuw et al. (2007), Snijkers et al. (2007), Durrant et al. (2010), Wenemark et al. (2011). These publications focus on three aspects (Singer, 2006): a) compensating for nonresponse by imputation and/or weighting; b) measuring nonresponse bias; and c) reducing nonresponse. The research reported in this article is an attempt to contribute to the latter. Two types of nonresponse can be distinguished: the part of the target group that is not reached (noncontacts), and those people who are reached but refuse to take part in the interview (refusals). Nonresponse in the second sense; i.e. refusals, is the topic of our studies. Singer (2006) shows that refusals contrib- ute more to the decrease of response rates than noncontacts; she suggests that investigation of the interaction between inter- viewer and respondent at the initial contact might aid in gaining  M.-J. PALMEN ET AL. insight as to how to reduce refusals, a plea made earlier by Groves et al. (1992), Groves & Couper (1996b) and later by Groves et al. (2008). Examples of studies of such interactions are Maynard & Schaeffer (1997), Snijkers et al. (1999), Groves & McGonagle (2001), Dijkstra & Smit (2002), Hox & de Leeuw (2002), and Pondman (1998). The latter, for example, shows that interviewers who react to externally attributed re- fusals such as “I have no time because I have just cooked our dinner,” with participation-directed persuasion strategies such as “Bon appétit. May I call you back after dinner?” have fewer refusals than interviewers who react with refusal-directed strategies, “Oh, of course, dinner can’t wait.” Other aspects of the initial contact that could have impact on refusals are voice characteristics of the interviewer (Groves, 2008). In the present article, we used two real-life experiments to investigate whether interviewers’ accent and gender in combination with respon- dents’ accent and gender had an impact on the refusal rate in telephone surveys. An overview of the multitude of (socio) linguistic and socio-psychological factors related to refusals in telephone surveys can be found in Pondman (1998), Palmen (2001), and Groves (2006). In the next section, we discuss the theoretical backgrounds of survey participation using a socio-psychological model called compliance theory, and subsequently we present the expecta- tions formulated regarding the impact of interviewers’ gender and accent on the refusal rate. For the purpose of our study— gaining insight into the impact of gender and accent on will- ingness to participate in a survey—a more detailed instrument than usual for establishing the refusal rate had to be developed, a cooperativeness scale. We discuss this instrument in the fol- lowing section. We then present the design and the results of two real-life experiments. In the last section, we discuss our results and outline the practical implications they might have for research bureaus that conduct telephone surveys. Theoretical Background: Compliance Theory, Voice, and Refusals Compliance Theory is a socio-psychological theory that de- scribes the information people are guided by in forming opin- ions, and the processes underlying the formation of those opin- ions. Since the refusal rate is determined by the respondent’s willingness to participate, this theory can be used to identify the decision-making processes that make some respondents more willing to participate in surveys than others are. According to Groves et al. (1992), there are six psychology- cal principles by which people are guided as they decide whether to comply with a request. These six principles are au- thority, liking, scarcity, consistency, reciprocation, and social validation. In our study, authority and liking seem to be most important; for that reason, we limit the following to a brief discussion of the possible impact of these two principles on refusal during initial contact between interviewer and respon- dent. For a detailed description of the relationships between the other principles and survey participation, we refer to Palmen (2001) and Gerritsen & Palmen (2002), and for empirical tests of these principles, to Dijkstra & Smit (2002), Hox and de Leeuw (2002) and Van der Vaart et al. (2005). The authority principle has to do with the fact that people are more inclined to comply with a request from someone whom they regard as a legitimate authority. In telephone surveys, this usually involves the well-known name and reputation of the research bureau. Usually, (semi-) government institutions and large market research bureaus have such a reputation. The for- mer also have the advantage of an aura of reliability; for exam- ple, official agencies that carry out censuses, such as the US Census Bureau or the Statistisches Bundesamt in Germany. Whether an interviewer has authority depends not only on the organization for which he works, but also on personal aspects. According to the authority principle, respondents are likely to be more willing to comply with a request from an interviewer with authority than from an interviewer with less authority. Liking means that people are more inclined to comply with a request from a person they like. In a survey situation, this means a person will more likely participate when the request to participate is made by an interviewer whom he finds sympa- thetic. Whether this is the case depends on many factors, but according to Groves et al. (1992), the chances that the respon- dent will like the interviewer increase when they are more alike; i.e., in terms of gender, age, social and regional background, personality, or language use. They call this agreement. We find this agreement concept also in other socio-psychological theo- ries like Byrne’s (1971) similarity attraction hypothesis. The results of the study of Durrant et al. (2010) confirm the effect of the agreement concept to a certain extent: interviewers and respondents who shared attributes, especially educational back- ground, tended to produce higher cooperation rates. According to the liking principle, respondents should be more willing to comply with a request from an interviewer with whom they share characteristics than from an interviewer with whom they have little in common. The decision to refuse or comply with the request to partici- pate in cold-call telephone surveys is usually made during the first few sentences spoken by the interviewer (Oksenberg & Cannell, 1988; Maynard & Schaeffer, 1997; Houtkoop-Steen- stra & Van den Bergh, 2000) and this suggests that the decision to refuse an interview is taken along the peripheral route of decision (Cacioppo & Petty, 1982; Van der Vaart et al., 2005). For that reason, it is plausible that the interviewer’s voice and the information deduced from it by the listener plays a primary role in the listener’s evaluation of the interviewer per the au- thority and the liking principles. Indications that the voice of the interviewer indeed plays an important part in the decision of the respondent to take part in a telephone survey are found in a number of studies. Oksenberg et al. (1986) and Oksenberg & Cannell (1988) found that interviewers rated by experts as hav- ing relatively high pitch, great variation in pitch, loudness, fast rate of speaking, clear pronunciation, speaking with a standard American accent, and perceived as sounding competent and confident had fewer refusals than interviewers with the opposite characteristics. The studies of Van der Vaart et al. (2005) and Groves et al. (2008) partly supported this. Their study showed that louder sounding and higher pitched voices were indeed correlated with lower refusal rates, but faster speaking and be- ing judged as more confident were not. Since findings of the effect of interviewers’ voice characteristics on refusal rates were not consistent over models, Groves et al. (2008) argue for further research, especially into the interaction of interviewers and respondents. One of the lines of research they do not men- tion, but that seems important to us in light of the liking and the authority principle, is the role of voice characteristics of the respondent. Coupland & Giles (1988) apply the agreement concept from the liking principle to voice: the more people speak in a similar Copyright © 2012 SciRes. 160  M.-J. PALMEN ET AL. way, the more they like each other. In the context of a tele- phone survey, this could imply that agreement in voice might decrease the refusal rate. There might also be a relationship between voice and the au- thority principle; low voices, for example, have more authority than high voices (Tielen, 1992; Van Bezooijen, 1995; Biemans, 2000). In light of the authority principle, we can expect that interviewers with voice characteristics that are associated with authority will have fewer refusals than interviewers without those voice characteristics. An interviewer’s voice comprises four elements: accent (re- vealing a possible regional and/or social origin), voice height (revealing gender), voice quality (i.e., personal voice “colour”), and prosodic characteristics (speech rate, etc.). We examined the effect of accent and gender of both interviewer and respon- dent on the refusal rate. We chose these two factors because they are easily noticed by the respondent, and because it is rela- tively easy to collect information about gender and accent from refusers based on their voices. Expectations Gender According to the authority principle, interviewers with more authority should have a higher response rate than interviewers with less authority. There is a very clear relation between au- thority and gender: men have more authority than women (Hol- mes & Meyerhoff 2005; Barret & Davidson 2006), and male voices have more authority than female voices (Tielen, 1992; Van Bezooijen, 1995; Biemans, 2000). Moreover, Baruffol et al. (2001) and Hansen (2007) found that male interviewers have lower refusal rates than female interviewers in telephone sur- veys. This leads to Expectation 1. Expectation 1: Male interviewers encounter higher response rates than female interviewers. According to the liking principle, agreement between the in- terviewer and the respondent would lead to a lower refusal rate. As regards gender, this implies that male interviewers who call male respondents should be more successful than male inter- viewers who call female respondents, and that female inter- viewers who call female respondents should be more successful than female interviewers who call male respondents. The study of Durrant et al. (2010) presents some support for this since there was a tendency for female respondents to be more likely to cooperate than male respondents were when the interviewer was a woman. The liking principle leads to Expectation 2. Expectation 2: The response rate is higher when interviewers call a person of the same sex than when they call a person of the opposite sex. Accent We use the term accent to designate a non-standard variety of a language; for instance, a socially determined variety (so- ciolect), a regional variety (dialect), or an ethnic variety (eth- nolect). According to the authority principle, interviewers with more authority should have a lower refusal rate than interview- ers with less authority. There is a clear relationship between authority and accent. Much research shows that people who speak the standard variety are viewed as more intelligent, more self-confident, and more competent than people with a regional accent. Standard speakers generally have higher status and more authority than speakers with an accent (Cacioppo & Petty 1982; Milroy & Milroy, 1999; Heijmer & Vonk, 2002; Kra- aykamp, 2005; Grondelaers et al., 2010). In the context of a telephone survey, this could mean that interviewers speaking the standard variety will have more success than those with a regional accent. Oksenberg & Cannell (1988) also found this in their US study. In the Netherlands, survey agencies usually adopt this view and ask for interviewers who speak standard Dutch in their employment advertisements (Eimers & Thomas 2000: p. 28). The use of a regional variety would be perceived as less professional and would, therefore, result in a higher refusal rate. This leads to Expectation 3. Expectation 3: Interviewers who speak the standard variety have a higher response rate than interviewers who have a re- gional accent. According to the liking principle, agreement between inter- viewer and respondent leads to lower refusal rates. Apropos of accent, this implies that interviewers who use the standard vari- ety should have more success with respondents who also speak the standard variety than with respondents who have a regional accent, and interviewers with a regional accent should be more successful with respondents who have the same accent than with respondents who speak the standard language. The posi- tive effect of agreement between people in a negotiation situa- tion is, for example, found by Mai & Hoffmann (2011) in their studies of language use in service selling. When there was a fit between the dialect of the salesperson and the dialect of the client, purchase intention increased. This leads to Expectations 4a and 4b. Expectation 4a: The response rate is higher when interview- ers who speak the standard variety of a language call respon- dents who speak the same standard variety than when they call respondents with a regional accent. Expectation 4b: The response rate is higher when interview- ers with a regional accent call equally accented respondents than when they call respondents who speak the standard vari- ety. Cooperativeness Scale In order to gain a deeper insight into the linguistic aspects that could play a part in refusals, we analyzed almost 1000 interviewer-respondent interactions recorded by an important Dutch survey agency prior to our real-life experiments (cf. next section). We discovered that the traditional classification as applied to interview outcomes (refusal, appointment, or success) was not adequate for our research into the effects of gender and accent on respondents’ cooperativeness on initial contact be- tween interviewer and respondent. Respondents may be coop- erative without, in the end, being able to or allowed to partici- pate because they do not meet the selection criteria. For in- stance, a family member of the selected respondent answers the phone and states that the selected respondent is not available. This family member is cooperative in providing the information that leads to selection, but he or she cannot take part in the sur- vey. Such calls are then written off as noncontacts. This is not a problem for surveys, because there was indeed no contact with the person who was selected for the survey. In order, though, to be able to gain insight into the impact of gender and accent on willingness to participate in a survey, a distinction has to be made between respondents who are cooperative and respon- dents who are not. For this reason, we developed a scale of Copyright © 2012 SciRes. 161  M.-J. PALMEN ET AL. Copyright © 2012 SciRes. 162 0 20 40 60 80 100 12345 Score Cooperativeness cooperativeness. The reactions of respondents (approximately 1000) to requests to participate in a survey could be classified into 12 different reaction patterns (Palmen, 2001). These 12 reaction patterns were submitted to 22 communication special- ists who assigned to each situation a cooperativeness score between 0 and 100. The higher the score assigned, the more cooperative the respondent was considered to be in the reaction described. The interrater reliability of the 22 raters was in ac- cordance with Kendall’s W 0.84 (p < .01). Figure 1 presents the means for each of these twelve reaction patterns. Figure 1. Mean of the cooperativeness scores assigned by 22 subjects to twelve reaction patterns (0 = not cooperative at all, 100 = very cooperative). Figure 1 clearly shows that some reaction patterns are very close to each other. In order to determine which patterns dif- fered significantly, a one-way analysis of variance with a post hoc analysis (Tukey HSD) was performed with reaction pattern (1 - 12) as an independent variable and cooperativeness as a dependent variable. The results are presented in Table 1. Table 1. Differences between the twelve reaction patterns. Category1 2 3 4 5 6 7 8 91011 1 2 - 3 - - 4 * * * 5 * * * - 6 * * * * - 7 * * * * - - 8 * * * * * - - 9 * * * * * * * * 10 * * * * * - - - * 11 * * * * * * * * - * 12 * * * * * * * * * * * Table 1 shows clearly that a number of categories do not differ significantly in cooperativeness. For example, the sub- jects did not make a distinction in cooperativeness between a respondent who interrupts the interviewer and slams the re- ceiver down (1); a respondent who interrupts the interviewer and terminates the call decently (2); and a respondent who lets the interviewer finish his introductory phrases, but then frankly finishes the call (3). The post hoc (Tukey HSD) analyses show- ed that regarding cooperativeness, the original 12 reaction pat- terns could be reduced to five categories. Table 2 shows these five categories (column 1), their cooperativeness with an exam- ple (columns 3 and 4), and which of the 12 reaction patterns were taken together (column 2). The scale’s five cooperativeness categories are represented graphically in Figure 2. The numerical value assigned to each of the five categories is the mean of the initial (non-compressed) twelve categories. This informs us of the order: a respondent who is given a 3 for cooperativeness is more cooperative than a respondent who is given a 2; 2 is more cooperative than 1, etc. Figure 2 shows that the distance between the five categories are nearly similar; the lines that connect the points have almost the same slopes; and the distance between 2 and 3 is similar to the distance between 3 and 4. This is an indication that the co- operativeness scale has interval features. According to Fienberg (2007), the variable cooperativeness can, therefore, be treated as an interval variable. Note: *p < .05. 0 20 40 60 80 100 12 3 4 56 7 89101112 Category Cooperativiness Instead of classifying a request as leading to success, refusal, or an appointment (the classic tripartite system), we assigned a cooperativeness score on a scale from 1 to 5. In the traditional Figure 2. The 5-point cooperativeness scale. Table 2. The cooperativeness scale. New score Old scores Degree of cooperation Result Example (I = interviewer; R = respondent) 1 1, 2, and 3 None Flat refusal, without a prospect of changeR: No, I don’t want to participate. 2 4 and 5 Minimal Refusal with explanation, possibly convertible R: Well, I really don’t feel like it, and those surveys always take up so much time… I: Oh, but this is a very interesting study, and it takes onl five minutes. R: No, thanks. 3 6, 7, 8, and 10 More than minimal Helpful, but with obstacles R: I have to leave the house now. I: Can I call you back some other time? R: Yes, sure. 4 9 and 11 Less than maximal Helpful R: How long will it take? I: Five minutes at the most. R: Go ahead then. 5 12 Maximal Full cooperation I: Would you answer some questions about that? R: Yes, sure. 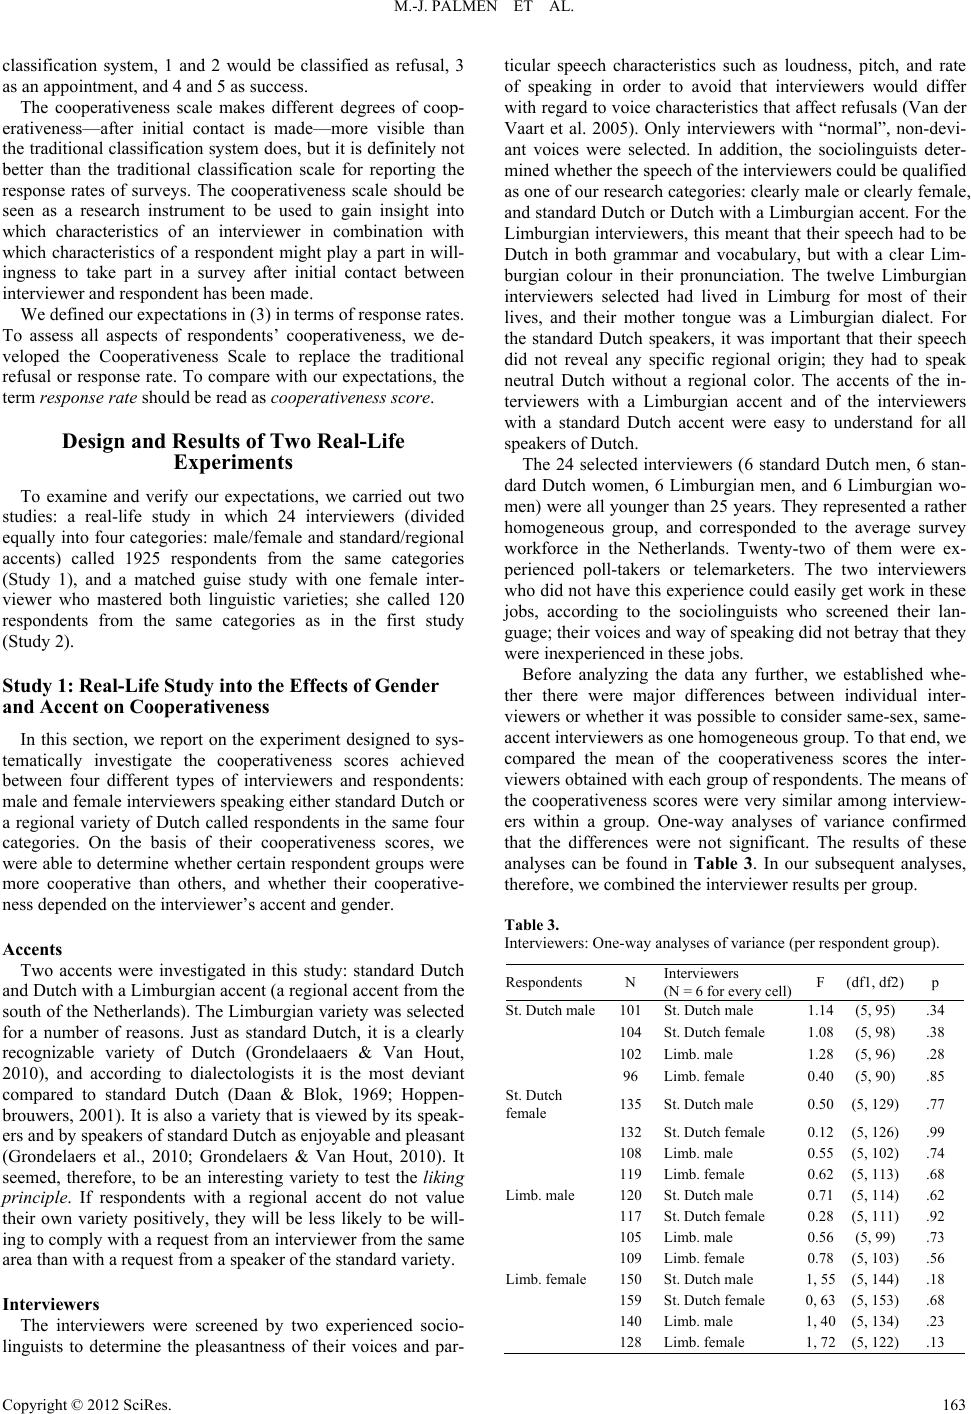 M.-J. PALMEN ET AL. classification system, 1 and 2 would be classified as refusal, 3 as an appointment, and 4 and 5 as success. The cooperativeness scale makes different degrees of coop- erativeness—after initial contact is made—more visible than the traditional classification system does, but it is definitely not better than the traditional classification scale for reporting the response rates of surveys. The cooperativeness scale should be seen as a research instrument to be used to gain insight into which characteristics of an interviewer in combination with which characteristics of a respondent might play a part in will- ingness to take part in a survey after initial contact between interviewer and respondent has been made. We defined our expectations in (3) in terms of response rates. To assess all aspects of respondents’ cooperativeness, we de- veloped the Cooperativeness Scale to replace the traditional refusal or response rate. To compare with our expectations, the term response rate should be read as cooperativeness score. Design and Results of Two Real-Life Experiments To examine and verify our expectations, we carried out two studies: a real-life study in which 24 interviewers (divided equally into four categories: male/female and standard/regional accents) called 1925 respondents from the same categories (Study 1), and a matched guise study with one female inter- viewer who mastered both linguistic varieties; she called 120 respondents from the same categories as in the first study (Study 2). Study 1: Real- Li fe Study into the Effects of Gender and Accent on Cooperativeness In this section, we report on the experiment designed to sys- tematically investigate the cooperativeness scores achieved between four different types of interviewers and respondents: male and female interviewers speaking either standard Dutch or a regional variety of Dutch called respondents in the same four categories. On the basis of their cooperativeness scores, we were able to determine whether certain respondent groups were more cooperative than others, and whether their cooperative- ness depended on the interviewer’s accent and gender. Accents Two accents were investigated in this study: standard Dutch and Dutch with a Limburgian accent (a regional accent from the south of the Netherlands). The Limburgian variety was selected for a number of reasons. Just as standard Dutch, it is a clearly recognizable variety of Dutch (Grondelaaers & Van Hout, 2010), and according to dialectologists it is the most deviant compared to standard Dutch (Daan & Blok, 1969; Hoppen- brouwers, 2001). It is also a variety that is viewed by its speak- ers and by speakers of standard Dutch as enjoyable and pleasant (Grondelaers et al., 2010; Grondelaers & Van Hout, 2010). It seemed, therefore, to be an interesting variety to test the liking principle. If respondents with a regional accent do not value their own variety positively, they will be less likely to be will- ing to comply with a request from an interviewer from the same area than with a request from a speaker of the standard variety. Interviewers The interviewers were screened by two experienced socio- linguists to determine the pleasantness of their voices and par- ticular speech characteristics such as loudness, pitch, and rate of speaking in order to avoid that interviewers would differ with regard to voice characteristics that affect refusals (Van der Vaart et al. 2005). Only interviewers with “normal”, non-devi- ant voices were selected. In addition, the sociolinguists deter- mined whether the speech of the interviewers could be qualified as one of our research categories: clearly male or clearly female, and standard Dutch or Dutch with a Limburgian accent. For the Limburgian interviewers, this meant that their speech had to be Dutch in both grammar and vocabulary, but with a clear Lim- burgian colour in their pronunciation. The twelve Limburgian interviewers selected had lived in Limburg for most of their lives, and their mother tongue was a Limburgian dialect. For the standard Dutch speakers, it was important that their speech did not reveal any specific regional origin; they had to speak neutral Dutch without a regional color. The accents of the in- terviewers with a Limburgian accent and of the interviewers with a standard Dutch accent were easy to understand for all speakers of Dutch. The 24 selected interviewers (6 standard Dutch men, 6 stan- dard Dutch women, 6 Limburgian men, and 6 Limburgian wo- men) were all younger than 25 years. They represented a rather homogeneous group, and corresponded to the average survey workforce in the Netherlands. Twenty-two of them were ex- perienced poll-takers or telemarketers. The two interviewers who did not have this experience could easily get work in these jobs, according to the sociolinguists who screened their lan- guage; their voices and way of speaking did not betray that they were inexperienced in these jobs. Before analyzing the data any further, we established whe- ther there were major differences between individual inter- viewers or whether it was possible to consider same-sex, same- accent interviewers as one homogeneous group. To that end, we compared the mean of the cooperativeness scores the inter- viewers obtained with each group of respondents. The means of the cooperativeness scores were very similar among interview- ers within a group. One-way analyses of variance confirmed that the differences were not significant. The results of these analyses can be found in Table 3. In our subsequent analyses, therefore, we combined the interviewer results per group. Table 3. Interviewers: One-way analyses of variance (per respondent group). Respondents N Interviewers (N = 6 for every cell) F (df1, df2)p St. Dutch male101 St. Dutch male 1.14 (5, 95).34 104 St. Dutch female 1.08 (5, 98).38 102 Limb. male 1.28 (5, 96).28 96 Limb. female 0.40 (5, 90).85 St. Dutch female 135 St. Dutch male 0.50 (5, 129).77 132 St. Dutch female 0.12 (5, 126).99 108 Limb. male 0.55 (5, 102).74 119 Limb. female 0.62 (5, 113).68 Limb. male 120 St. Dutch male 0.71 (5, 114).62 117 St. Dutch female 0.28 (5, 111).92 105 Limb. male 0.56 (5, 99).73 109 Limb. female 0.78 (5, 103).56 Limb. female150 St. Dutch male 1, 55 (5, 144).18 159 St. Dutch female 0, 63 (5, 153).68 140 Limb. male 1, 40 (5, 134).23 128 Limb. female 1, 72 (5, 122).13 Copyright © 2012 SciRes. 163  M.-J. PALMEN ET AL. Respondents and Pr ocedure In order to ensure that the respondents were as similar as possible in all aspects other than accent and gender, we selected four medium-sized cities (between 50,000 and 100,000 inhabi- tants) in the Netherlands with similar socio-economic charac- teristics and infrastructure based on the statistical community data of the national statistical agency. Two Limburgian cities (Roermond & Sittard) were paired with two cities from the region in which the most standard Dutch is spoken according to Daan & Blok’s (1969) and Hoppenbrouwers’ (2001) map (Ri- jswijk & Velsen). For each of the four cities, we selected the phone numbers of 1500 private persons by using the elec- tronic directory. Each interviewer was provided with a mixed list of 250 phone numbers obtained from the four cities. The interviewers alternately called standard Dutch-speaking areas and Limburgian areas. When the phone was answered by a respondent, the interviewer used the following introduction (translated from Dutch): “Good evening sir/madam, this is [name of the interviewer] of BC Research. We are currently conducting a study to assess people’s opinions of certain topics relating to the Dutch language. Could I ask you a few questions on that?” Our survey agency was called “BC Research”, BC standing for Business Communication, the department respon- sible for the study. To investigate the impact of gender and accent on cooperativeness, we had to ask some questions of cooperative respondents. Since we did not want to ask ques- tions without a purpose, we asked colleagues at the Radboud University to suggest questions for which they would like an- swers. A survey created by Smakman (2006) was ideal for this purpose as it comprised questions on the position of Dutch attitudes towards standard Dutch and regional varieties, what standard Dutch really is, and who uses that variety. We be- lieved this topic would be equally interesting for all four cate- gories of respondents, and would consequently avoid a nonre- sponse bias (Keeter et al., 2006). The survey was carried out on Monday through Thursday nights, between 6.30 and 9.30 p.m. All interviewers worked the same days and the same hours over the survey period. Inter- viewers were instructed to try to persuade hesitant respondents to participate and to give them additional information, as would be done by a real survey agency. They were told not to try any further in the case of firm, radical refusals without any cues for further discussion. For every call, the interviewers noted whether the telephone was picked up or not. When the phone was picked up, they noted whether they had spoken to a man or a woman, and the outcome of the call (success, refusal, or appointment). When the phone was not picked up, the interviewer made a note of the telephone number, and phoned that number three other times on other days. The interviewers kept track of the number of re- spondents in each of the four groups, and they were instructed to continue until they had spoken to at least 25 persons in each group: 25 men and 25 women from the standard Dutch area, and 25 men and 25 women from the Limburgian area. Based on Cohen (1992), we needed an α-level of .05, a power of .8, and 16 groups with 15 respondents per cell to detect a large effect size. We decided to choose a large effect size, because small effect sizes are, in our view, not relevant for practical use in telephone surveys. The interviewers were asked to conduct 25 conversations in order to leave enough margin to be able to leave out of consideration respondents with an accent other than the two varieties investigated, children, and clearly dis- abled persons (hard of hearing, mentally addled, or handi- capped). The number of 15 was achieved for every group; when there were more than 15 respondents, the additional data were also entered into the analysis. Since the aim of our study was to determine whether inter- viewer accent and gender in combination with respondent ac- cent and gender had an impact on the cooperativeness rate in telephone surveys, respondents’ gender and accent had to be determined. All calls—whether they resulted in success, re- fusal, or appointment—were taped and assessed for gender and accent by two experienced sociolinguists. Assessing gender was not problematic. Accent was assessed on a scale of 1 to 10:1 meaning Dutch with a very strong regional colour, and 10 meaning perfectly neutral Dutch. Respondents who were attrib- uted 7 or higher on this scale were qualified as speakers of standard Dutch for the purposes of this study. Respondents who were attributed 5 or less, and who were identifiable as Limbur- gian, were assigned to the group of Limburgian respondents. In the end, 1925 calls were examined for the impact of gen- der and accent on cooperativeness. According to the traditional response classification scale, the results were 589 (31%) suc- cessful interview, 150 (8%) appointment, and 1187 (62%) re- fusal. Since we were only interested in whether interviewer and respondent gender and/or accent had an impact on respondents’ cooperativeness, the number of non-contacts was not relevant for our study, and for that reason they were not noted. Results Study 1 Table 4 shows the results of a 2 × 2 × 2 × 2 analysis of vari- ance with the cooperativeness scores as the dependent variable, and the following four factors: interviewer gender (male, fe- male), interviewer accent (standard Dutch, Limburgian), re- spondent gender (male, female), and respondent accent (stan- dard Dutch, Limburgian). Table 5 presents the means and standard deviations for each of the respondent groups. Table 4. Interviewers’ and respondents’ gender and accent: results of analysis of variance. F df = 1,1909p Expectations Gender interviewer (Expectation 1) 1.70 .19 Gender interviewer*gender respondent (Expectation 2) .011 .91 Accent interviewer (expectation 3) 2.85 .09 Accent interviewer*accent respondent (Expectation 4) 1.31 .25 Possible interactions Gender interviewer*accent respondent .75 .38 Gender interviewer*accent interviewer*gender respondent .35 .55 Gender interviewer*accentinterviewer*accent respondent .32 .57 Gender interviewer*gender respondent*accent respondent .05 .82 Gender interviewer*accent interviewer*gender respondent * accent respondent .00 .98 Accent interviewer*gender respondent 1.44 .23 Accent interviewer*gender respondent*accent respondent 1.64 .20 Copyright © 2012 SciRes. 164  M.-J. PALMEN ET AL. Copyright © 2012 SciRes. 165 Table 5. Mean cooperativeness scores (M) and standard deviations (SD) for all respondent groups, per interviewer group (N = 1925) (1 = no cooperation, 5 = full cooperation). Respondents St. Dutch male St. Dutch female Limb. Male Limb. Female Total Interviewers n M SD n M SD n M SD n M SD n M SD St. Dutch male 101 2.28 1.56 135 2.27 1.52 120 2.44 1.56 150 2.22 1.42 506 2.30 1.51 St. Dutch female 104 2.33 1.58 132 2.35 1.57 117 2.50 1.57 159 2.38 1.55 512 2.39 1.56 Limb. Male 102 2.48 1.58 108 2.55 1.59 105 2.22 1.50 140 2.44 1.48 455 2.42 1.53 Limb. Female 96 2.54 1.61 119 2.47 1.58 109 2.45 1.64 128 2.60 1.63 452 2.52 1.61 Total 403 2.40 1.58 494 2.40 1.56 451 2.41 1.57 577 2.40 1.52 1925 2.40 1.55 Expectation 1, that male interviewers encounter higher co- operativeness rates than female interviewers, was not confirmed. There was no significant main effect for gender of the inter- viewer on the cooperativeness rate. Male interviewers (M = 2.36, SD = 1.52) had as much success as female interviewers (M = 2.45, SD = 1.59). Nor was Expectation 2 confirmed; there was no significant interaction effect between gender of the interviewer and gender of the respondent. Male interviewers had as much success with male respondents (M = 2.36, SD = 1.55) as with female respondents (M = 2.35, SD = 1.50), and female interviewers had as much success with female respon- dents (M = 2.45, SD = 1.58) as with male respondents (M = 2.46, SD = 1.59). Expectation 3, that interviewers who speak the standard vari- ety achieve a higher cooperativeness than interviewers who have a regional accent, was also not confirmed. There was no significant main effect for the accent of the interviewer on the cooperativeness. Interviewers speaking standard Dutch (M = 2.34, SD = 1.54) had as much success as interviewers speaking Limburgian (M = 2.47, SD = 1.57).There was also no signify- cant interaction effect between the accent of the interviewer and the accent of the respondent. Interviewers speaking standard Dutch had as much success with standard Dutch speaking re- spondents (M = 2.31, SD = 1.55) as with Limburgian-speaking respondents (M = 2.38, SD = 1.52), and Limburgian-speaking interviewers had as much success with Limburgian-speaking respondents (M = 2.44, SD = 1.58) as with standard Dutch- speaking respondents (M = 2.51, SD = 1.56) (Expectation 4). None of the expectations based on either the authority prin- ciple (Expectations 1 and 3) or the liking principle (Expecta- tions 2, 4a and 4b) were confirmed. Although we had no ex- pectations regarding interactions of interviewers’ and respon- dents’ gender and accent—for example, that the cooperative- ness with male interviewers would be different than with fe- male interviewers for Limburgian respondents only—we test- ed all possible interactions of interviewers’ and respondents’ gender and accent in the hope of gaining more insight into the factors that play a role in cooperativeness. Table 4 shows there are no significant interactions between interviewers’ and re- spondents’ gender and accent. Our results show clearly that in- terviewers’ and respondents’ gender and accent did not influ- ence cooperativeness. Our real life study among 1925 respon- dents did not confirm any of our expectations; this led us to perform a second experiment. Study 2: Matched-Guise R eplication, On e Female Interviewer with Two Accents Table 4 showed no significant differences between the inter- viewers in the level of success they obtained; all 24 interview- ers achieved similar cooperativeness scores. One could raise the objection that 24 interviewers could not possibly present iden- tical behavior on all levels as they are human beings, not ma- chines. Although they were instructed to observe the instruc- tions strictly, small deviations may have occurred. In some cases, for instance, the respondent’s argument that he or she was probably too old to participate was not always handled in the same way; e.g., the interviewer might forget to mention the counter argument, or use different phrasing. Although these deviations do not seem to have been systemic (every inter- viewer had some interviews presenting slight differences), they resulted in some (inevitable) variation in the data. Also, the voices and speech characteristics of 24 interviewers were not completely equal on all levels. Although two socio- linguists assessed the interviewers’ voices prior to our study, their voices were not identical. These differences may have been minimal, or they may possibly have affected the inter- viewers’ scores, but did they even out across all interviewers? In order to find out whether our results were clouded by such voice and/or behaviour differences between interviewers, we did a second real-life investigation in which we used a well- tried method from sociolinguistics: the matched-guise tech- nique (Lambert, 1967; Giles, 1973). In the matched-guise technique, a speaker is used who mas- ters two varieties of a language on a native speaker’s level: for example, the standard variety and a dialect variety. Two speech fragments are recorded by this perfectly bilingual person, one in the standard language and one in the dialect variety. The frag- ments differ only regarding language variety; apart from that, they are the same (i.e., in voice height, voice quality, and pro- sodic characteristics) because both fragments are uttered by the same person. The fragments are presented to listeners who in- dicate their appreciation of the speaker in a scaled manner in terms of intelligence, friendliness, status, etc. Since the frag- ments are uttered by the same speaker, differences in apprecia- tion of the speaker of the fragments can only be attributed to the variety they speak. This matched-guise technique was found suitable to investigate whether the results of the first study could have been clouded by voice and/or behaviour differences between interviewers. If a bilingual interviewer attained similar  M.-J. PALMEN ET AL. results as the interviewers from Study 1, that would constitute a confirmation of the findings of that study. In regular matched-guise studies, every subject is exposed twice to the speaker, once when the speaker uses one variety, once when he uses the other (within-groups design). This was not possible in our study, since it was not possible to call the same respondent twice with the same request. For that reason, we used a between-groups design: each respondent was con- tacted once and heard one variety. The female bilingual interviewer we found, according to two sociolinguists, matched the criteria applied to the standard Dutch and Limburgian interviewers in Study 1. Unfortunately, no male interviewer who met these criteria could be found. As a consequence, only the results for the female interviewers of Study 1 could be verified: Expectations 3, 4a and 4b, and par- tially Expectation 2. The female bilingual interviewer contacted 120 respondents equally divided among the same four categories (30 respon- dents in each cell) and in the same way as was done in Study 1. In this matched-guise study, not only respondents’ accents were determined by two sociolinguists, but also the accent of the bilingual interviewer, because there was a chance that she would accidentally speak standard Dutch and indicate it as a Limburgian accent, or the other way around. Table 6 shows the results of a 2 × 2 × 2 analysis of variance with the cooperativeness scores as the dependent variable and the factors: interviewer accent (standard Dutch, Limburgian), respondent gender (male, female), and respondent accent (standard Dutch, Limburgian). Table 7 presents the means and standard deviations for each of the respondent groups. The part of Expectation 2 that could be tested, does the fe- male interviewer have more success with female respondents than with male respondents, was not confirmed. The female interviewer had as much success with female respondents (M = 2.15, SD = 1.31) as with male respondents (M = 2.72, SD = 1.70). Expectation 3 was not confirmed; when the interviewer used standard Dutch, she did not have significantly more success (M = 2.47, SD = 1.56) than when she used Limburgian (M = 2.40, SD = 1.53). There was also no significant interaction between the accent of the interviewer and the accent of the respondent; for that reason, expectations 4a and 4b were not confirmed. Agreement between interviewer and respondent in accent (M = 2.50, SD = 1.57 for Standard Dutch, and M = 2.60, SD = 1.61 for Limburgian) did not lead to more success than disagreement Table 6. Female interviewer’s accent and respondents’ gender and accent: re- sults of analysis of variance. F (df = 1,112)p Expectations Gender respondent (Expectation 2, partially) 4.08 .053 Accent interviewer (Expectation 3) .07 .81 Accent interviewer*accent respondent (Expectation 4) .69 .41 Possible interactions Accent interviewer*gender respondent 1.71 .19 Accent interviewer*gender respondent*accent respondent .23 .64 Table 7. Mean cooperativeness scores (M) and standard deviations (SD) for all respondent groups, per interviewer group (n = 120, 1 = no cooperation, 5 = full cooperation). Respondents St. Dutch Male St. Dutch Female Limb. Male Limb. Female Total Accent emale interviewer n M SD n M SD n M SD n M SD n M SD St. Dutch 153,00 1.70152.00 1.31 15 2.87 1.85 15 2.00 1.14602.47 1.56 Limb. 152.20 1.57152.20 1.38 15 2.80 1.74 15 2.40 1.50602.40 1.53 Total 302.60 1.65302.10 1.32 30 2.83 1.76 30 2.20 1.32 120 2.43 1.54 did (M = 2.20, SD = 1.45 for a Limburgian interviewer and a Standard Dutch respondent, and M = 2.43, SD = 1.57 for a Standard Dutch interviewer and a Limburgian respondent). None of the expectations based on either the authority prin- ciple (Expectation 3) or the liking principle (Expectations 2 and 4a and b) were confirmed. Table 7 shows that again there were no interactions between the interviewer’s accent and the re- spondent’s gender and accent. The effect of the interviewer’s accent on cooperativeness did not depend on the gender and/or the accent of the respondent. Conclusion and Discussion We reported above on two studies into the possible impact of interviewers’ and respondents’ gender and accent on willing- ness to cooperate in a telephone survey. In Study 1, twelve standard-speaking interviewers (6 men, 6 women) and twelve interviewers with a regional accent (6 men, 6 women) called 1925 male and female respondents (speaking either the standard or the regional variety), to request them to take part in a tele- phone survey on the Dutch language. There were no significant differences in cooperation between the groups: interviewers’ and respondents’ gender and accent did not affect cooperative- ness. For that reason, none of the expectations were confirmed. The results for the female interviewers were verified and confirmed in Study 2, a matched-guise study, featuring a fe- male interviewer who mastered both the standard accent and the regional variety. She called standard-speaking and regional- speaking male and female respondents, using the two varieties alternately. She attained similar cooperativeness scores using both varieties, and when calling either men or women. In this study, there were also no significant differences between the groups; therefore, none of the expectations were confirmed here either. The number of participants per call was purposely based on a large effect size. The reason for this choice was that de- tecting medium or small effects on willingness to cooperate in a telephone survey would have been less relevant. In both studies, none of the expectations based on the au- thority principle of the compliance theory were confirmed. Male interviewers were not more successful than female inter- viewers (Expectation 1); interviewers who spoke standard Dutch were not more successful than interviewers who had a Limburgian accent (Expectation 3); nor were the expectations based on the liking principle confirmed. Cooperativeness was not higher in same-sex interviews than in interviews with a person of the opposite sex (Expectation 2), and the coopera- Copyright © 2012 SciRes. 166 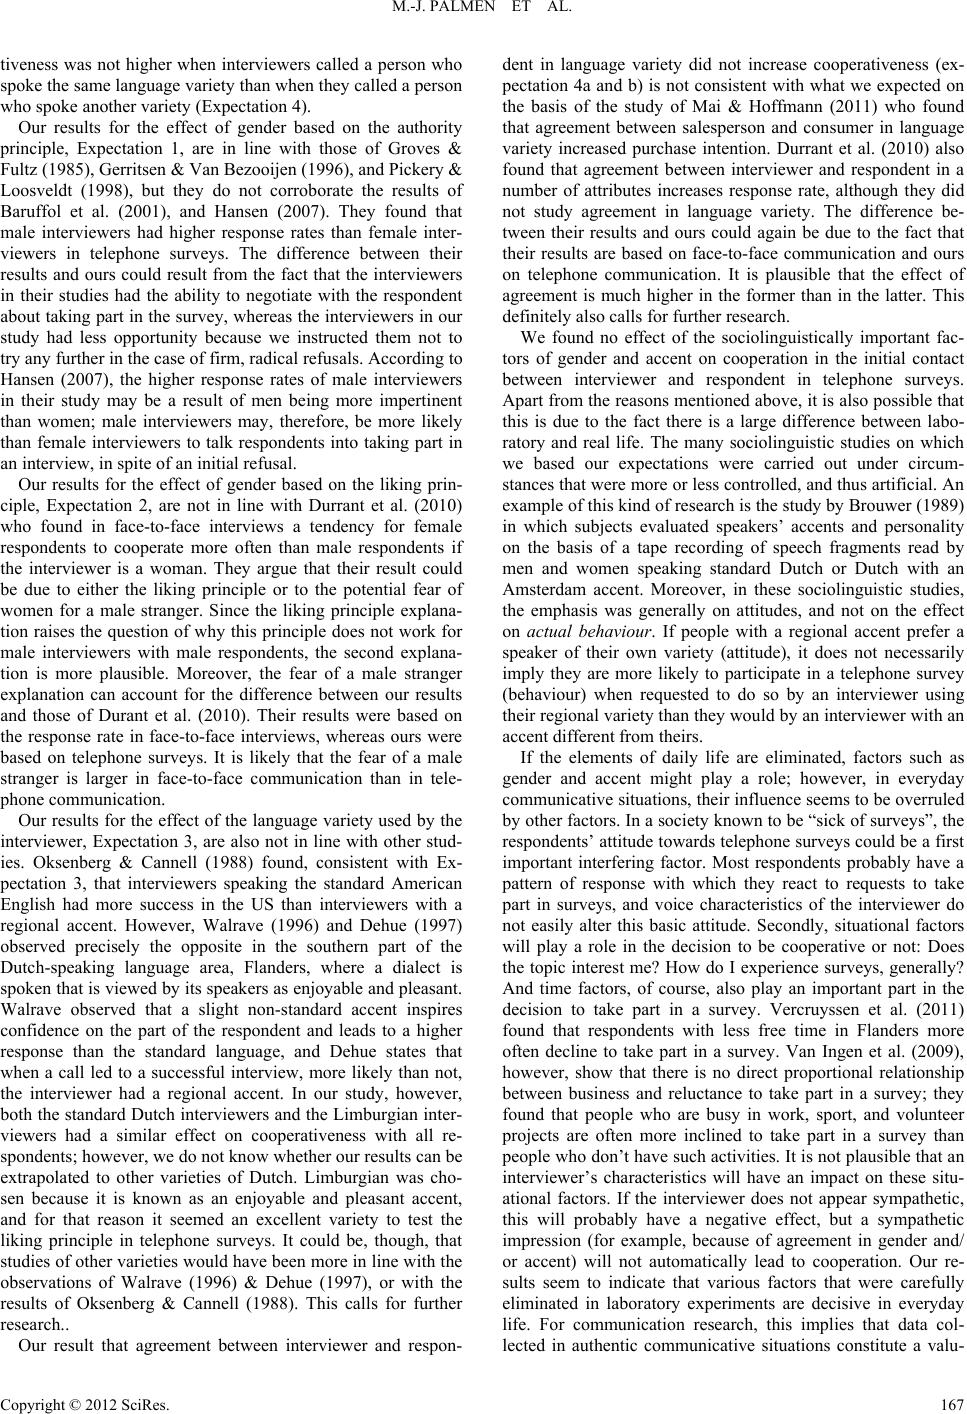 M.-J. PALMEN ET AL. tiveness was not higher when interviewers called a person who spoke the same language variety than when they called a person who spoke another variety (Expectation 4). Our results for the effect of gender based on the authority principle, Expectation 1, are in line with those of Groves & Fultz (1985), Gerritsen & Van Bezooijen (1996), and Pickery & Loosveldt (1998), but they do not corroborate the results of Baruffol et al. (2001), and Hansen (2007). They found that male interviewers had higher response rates than female inter- viewers in telephone surveys. The difference between their results and ours could result from the fact that the interviewers in their studies had the ability to negotiate with the respondent about taking part in the survey, whereas the interviewers in our study had less opportunity because we instructed them not to try any further in the case of firm, radical refusals. According to Hansen (2007), the higher response rates of male interviewers in their study may be a result of men being more impertinent than women; male interviewers may, therefore, be more likely than female interviewers to talk respondents into taking part in an interview, in spite of an initial refusal. Our results for the effect of gender based on the liking prin- ciple, Expectation 2, are not in line with Durrant et al. (2010) who found in face-to-face interviews a tendency for female respondents to cooperate more often than male respondents if the interviewer is a woman. They argue that their result could be due to either the liking principle or to the potential fear of women for a male stranger. Since the liking principle explana- tion raises the question of why this principle does not work for male interviewers with male respondents, the second explana- tion is more plausible. Moreover, the fear of a male stranger explanation can account for the difference between our results and those of Durant et al. (2010). Their results were based on the response rate in face-to-face interviews, whereas ours were based on telephone surveys. It is likely that the fear of a male stranger is larger in face-to-face communication than in tele- phone communication. Our results for the effect of the language variety used by the interviewer, Expectation 3, are also not in line with other stud- ies. Oksenberg & Cannell (1988) found, consistent with Ex- pectation 3, that interviewers speaking the standard American English had more success in the US than interviewers with a regional accent. However, Walrave (1996) and Dehue (1997) observed precisely the opposite in the southern part of the Dutch-speaking language area, Flanders, where a dialect is spoken that is viewed by its speakers as enjoyable and pleasant. Walrave observed that a slight non-standard accent inspires confidence on the part of the respondent and leads to a higher response than the standard language, and Dehue states that when a call led to a successful interview, more likely than not, the interviewer had a regional accent. In our study, however, both the standard Dutch interviewers and the Limburgian inter- viewers had a similar effect on cooperativeness with all re- spondents; however, we do not know whether our results can be extrapolated to other varieties of Dutch. Limburgian was cho- sen because it is known as an enjoyable and pleasant accent, and for that reason it seemed an excellent variety to test the liking principle in telephone surveys. It could be, though, that studies of other varieties would have been more in line with the observations of Walrave (1996) & Dehue (1997), or with the results of Oksenberg & Cannell (1988). This calls for further research.. Our result that agreement between interviewer and respon- dent in language variety did not increase cooperativeness (ex- pectation 4a and b) is not consistent with what we expected on the basis of the study of Mai & Hoffmann (2011) who found that agreement between salesperson and consumer in language variety increased purchase intention. Durrant et al. (2010) also found that agreement between interviewer and respondent in a number of attributes increases response rate, although they did not study agreement in language variety. The difference be- tween their results and ours could again be due to the fact that their results are based on face-to-face communication and ours on telephone communication. It is plausible that the effect of agreement is much higher in the former than in the latter. This definitely also calls for further research. We found no effect of the sociolinguistically important fac- tors of gender and accent on cooperation in the initial contact between interviewer and respondent in telephone surveys. Apart from the reasons mentioned above, it is also possible that this is due to the fact there is a large difference between labo- ratory and real life. The many sociolinguistic studies on which we based our expectations were carried out under circum- stances that were more or less controlled, and thus artificial. An example of this kind of research is the study by Brouwer (1989) in which subjects evaluated speakers’ accents and personality on the basis of a tape recording of speech fragments read by men and women speaking standard Dutch or Dutch with an Amsterdam accent. Moreover, in these sociolinguistic studies, the emphasis was generally on attitudes, and not on the effect on actual behaviour. If people with a regional accent prefer a speaker of their own variety (attitude), it does not necessarily imply they are more likely to participate in a telephone survey (behaviour) when requested to do so by an interviewer using their regional variety than they would by an interviewer with an accent different from theirs. If the elements of daily life are eliminated, factors such as gender and accent might play a role; however, in everyday communicative situations, their influence seems to be overruled by other factors. In a society known to be “sick of surveys”, the respondents’ attitude towards telephone surveys could be a first important interfering factor. Most respondents probably have a pattern of response with which they react to requests to take part in surveys, and voice characteristics of the interviewer do not easily alter this basic attitude. Secondly, situational factors will play a role in the decision to be cooperative or not: Does the topic interest me? How do I experience surveys, generally? And time factors, of course, also play an important part in the decision to take part in a survey. Vercruyssen et al. (2011) found that respondents with less free time in Flanders more often decline to take part in a survey. Van Ingen et al. (2009), however, show that there is no direct proportional relationship between business and reluctance to take part in a survey; they found that people who are busy in work, sport, and volunteer projects are often more inclined to take part in a survey than people who don’t have such activities. It is not plausible that an interviewer’s characteristics will have an impact on these situ- ational factors. If the interviewer does not appear sympathetic, this will probably have a negative effect, but a sympathetic impression (for example, because of agreement in gender and/ or accent) will not automatically lead to cooperation. Our re- sults seem to indicate that various factors that were carefully eliminated in laboratory experiments are decisive in everyday life. For communication research, this implies that data col- lected in authentic communicative situations constitute a valu- Copyright © 2012 SciRes. 167  M.-J. PALMEN ET AL. able and necessary complement to data collected in laboratory situations. As the survey results are decisive, measures aimed at in- creasing cooperativeness should focus on the way the fieldwork is organized. It is important for research bureaus to know they probably do not have to exclude potential employees with a regional accent, or female interviewers (which could lead to a considerable increase in the number of potential interviewers), and that it is probably not necessary to make efforts to match certain characteristics of interviewers and respondents. REFERENCES Barret, M., & Davidson, M. J. (2006). Gender and Communication at Work. Aldeshot: Ashgate Publishing. Baruffol, E. P. Verger, & Rotily, M. (2001). Using the telephone for mental health surveys. An analysis of the impact of call rank, non- response, and interviewer effect. Population, 56, 987-1010. doi:10.2307/1534750 Bethlehem, J. G. (2002). Weighting nonresponse adjustment based on auxiliary information. In R. M. Groves, D. A. Dillman, J. L. Eltinge, & J. A. Roderick (Eds.), Survey Nonresponse (pp. 275-288). New York: Wiley. Biemans, M. (2000). Gender variation in voice quality. Utrecht: Lot. Brouwer, D. (1989). Gender variation in Dutch: A sociolinguistic study of Amsterdam speech. Dordrecht: Foris. Byrne, D. (1971). The attraction paradigm. New York: Academic Press. Cacioppo, J., & Petty, R. (1982). Language variables, attitudes, and persuasion. In E. B. Ryan, & H. Giles (Eds.), Attitudes towards lan- guage variation (pp. 189-207). London: Edward Arnold. Cohen, J. (1992). Quantitative methods in psychology: A power primer. Psychological Bulletin, 112, 155-159. doi:10.1037/0033-2909.112.1.155 Couper, M., & de Leeuw, E. (2003). Nonresponse in cross-cultural and cross-national surveys. In J. Harkness, F. van de Vijver, & P. Mohler (Eds.), Cross-cultural survey methods (pp. 157-178). Hoboken, NJ: Wiley. Coupland, N., & Giles, H. (1988). Introduction: The communicative context of accommodation. Language and communication, 8, 75- 182. doi:10.1016/0271-5309(88)90015-8 Curtin, R., Presser, S., & Singer, E. (2000). The effects of response rates changes on the index of consumer sentiment. Public Opinion Quarterly, 64, 413-428. doi:10.1086/318638 Curtin, R., Presser, S., & Singer, E. (2005). Changes in telephone sur- vey nonresponse over the past quarter century. Public Opinion Quar- terly, 69, 87-98. doi:10.1093/poq/nfi002 Daan, J., & Blok, D. (1969). From the urban agglomeration of Western Holland to the border. Explanation of the map dialects and onomas- tics, the atlas of the Netherlands. Amsterdam: Noord-Hollandsche Uitgevers Maatschappij. De Heer, W. (1999). International response trends. Journal of Official Statistics, 15, 129-142. Dehue, F. (1997). Results observation introduction behaviour com- muters. Heerlen: Centraal Bureau voor de Statistiek. De Leeuw, E. D., & de Heer, W. (2002). Trends in household survey nonresponse. In R. M. Groves, D. A. Dillman, J. L. Eltinge, & J. A. Roderick (Eds.), Survey nonresponse (pp. 41-54). New York: Wiley. De Leeuw, E. D., Callegaro, M., Hox, J., Korendijk, E., & Lensveldt- Mulders, G. (2007). The influence of advance letters on response in telephone surveys. Public Opinion Quarter ly, 71, 413-443. doi:10.1093/poq/nfm014 Dijkstra, W., & Smit, J. H. (2002). Persuading reluctant recipients in telephone surveys. In R. M. Groves, D. A. Dillman, J. L. Eltinge, and R. J. A. Little (Eds.), Survey nonresponse. (pp. 121-134), New York: Wiley. Durrant, G. B., Groves, R. M., Staetsky, L., & Steele, F. (2010). Effects of interviewer attitudes and behaviors on refusal in household sur- veys. Public Opinion Quarterly, 74, 1-36. doi:10.1093/poq/nfp098 Eimers, T., & Thomas, E. (2000). Instruction callcenter personnel de- mands new approach. Nijmegen: ITS. Feskens, R., Hox, J., Lensveldt-Mulders, G., & Schmeets, H. (2007). Nonresponse among ethnic minorities: A multivariate analysis. Jour- nal of Official Statistics, 2, 387-408. Fienberg, S. E. (2007). The analysis of cross-classified categorical data. New York: Springer. doi:10.1007/978-0-387-72825-4 Gerritsen, M., & van Bezooijen, R. (1996). How can I increase the effect of my telemarketing business? Ad Rem, 4, 9-12. Gerritsen, M., & Palmen, M.-J. (2002). The effect of prenotification techniques on the refusal rate in telephone surveys. A real-life study in the light of the compliance and elaboration likelihood theory. Document Design, 3, 16-29. doi:10.1075/dd.3.1.04ger Giles, H. (1973). Communicative effectiveness as a function of ac- cented speech. Speech Monographs, 40, 330-331. doi:10.1080/03637757309375813 Grondelaers, S. A., & van Hout, R. W. N. M. (2010). Is standard Dutch with a regional accent standard or not? Evidence from native speak- ers’ attitudes. Language Variation and Change, 22, 221-239. doi:10.1017/S0954394510000086 Grondelaers, S. A., van Hout, R. W. N. M., & Steegs, M. (2010). Eva- luating regional accent variation in standard Dutch. Journal of Lan- guage and Social Psyc ho lo gy, 29, 101-116. doi:10.1177/0261927X09351681 Groves, R. M. (2006). Nonresponse rates and nonresponse bias in household surveys. Public Opinion Quarterly, 70, 646-675. doi:10.1093/poq/nfl033 Groves, R. M. (2011). Three eras of survey research. Public Opinion Quarterly, 75, 661-671. doi:10.1093/poq/nfr057 Groves, R. M., Dilman, D. A., Eltinge, J. L., & Little, R. J. A. (2002). Survey nonresponse. New York: John Wiley and Sons, Inc. Groves, R. M., Cialdini, B., & Couper, M. (1992). Understanding the decision to participate in a survey. Public Opinion Quarterly, 56, 475-495. doi:10.1086/269338 Groves, R. M., & Couper, M. (1996a). Nonresponse in household in- terview surveys. New York: Wiley-Interscience. Groves, R. M., & Couper, M. (1996b). Contact-level influences on cooperation in face-to-face surveys. Journal of Official Statistics, 12, 63-83. Groves, R. M., & Fultz, N. (1985). Gender effects among telephone interviewers in a survey of economic attitudes. Sociological Methods and Research, 14, 31-52. doi:10.1177/0049124185014001002 Groves, R. M., & McGonagle, K. A. (2001). A theory-guided inter- viewer training protocol regarding survey participation. Journal of Official Statistics, 17, 249-265. Groves, R. M., O’Hare, B. C., Gould-Smith, D., Benkí, J., & Maher, P. (2008). Telephone interviewer voice characteristics and the survey participation decision. In J. M. Lepkowski, C. Tucker, J. M. Brick, E. de Leeuw, L. Japec, P. J. Lavrakas, M. W. Link, & R. L. Sangster (Eds.), Advances in telephone survey methodology (pp. 385-400). New York: John Wiley and Sons, Inc. Groves, R. M., & Peytcheva, E. (2008). The impact of nonresponse rates on nonresponse bias. Public Opinion Quarterly, 72, 167-189. doi:10.1093/poq/nfn011 Hansen, K. M. (2007). The effect of incentives, interview length, and interviewer characteristics on response rates in a CAT study. Inter- national Journal of Public Opinion Research, 19, 112-121. doi:10.1093/ijpor/edl022 Heijmer, T., & Vonk, R. (2002). Effects of a regional accent on the evaluation of the speaker. Nederlands Tijdschrift voor de Psy- chologie, 57, 108-113. Holmes, J., & Meyerhoff, M. (2005). The handbook of language and gender. Oxford: Blackwell Publishing. Hoppenbrouwers, C. (2001). The classification of Dutch dialects. Dia- lects of 156 towns and villages classified according the FFM. Assen: Koninklijke Van Gorcum. Houtkoop-Steenstra, H., & van den Bergh, H. (2000). Effects of intro- ductions in large-scale telephone survey interviews. Sociological Me- thods and Research, 28, 281-300. doi:10.1177/0049124100028003002 Hox, J. J., & de Leeuw, E. D. (2002). The influence of interviewers’ Copyright © 2012 SciRes. 168  M.-J. PALMEN ET AL. Copyright © 2012 SciRes. 169 attitude and behavior on household survey nonresponse: An interna- tional comparison. In R. M. Groves, D. A. Dillman, J. L. Eltinge, & J. A. Roderick (Eds.), Survey nonresponse (pp. 103-120). New York: Wiley. Keeter, S., Miller, C., Kohut, A., Groves, R. M., & Presser, S. (2000). Consequences of reducing nonresponse in a national telephone sur- vey. Public Opinion Quarterly, 64, 125-148. doi:10.1086/317759 Keeter, S., Kennedy, C., Dimock, M., Best, J., & Craighill, P. (2006). Gauging the impact of growing nonresponse on estimates from a na- tional RDD telephone survey. Public Opinion Quarterly, 70, 759- 779. doi:10.1093/poq/nfl035 Kraaykamp, G. (2005). Dialect and social inequality: An empirical stu- dy of the social-economic consequences of speaking a dialect in one’s youth. Pedag og is ch e S tudiën, 85, 390-403. Lambert, W. (1967). A social psychology of bilingualism. Journal of Social Issues, 23, 91-109. doi:10.1111/j.1540-4560.1967.tb00578.x Mai, R., & Hoffmann, S. (2011). Four positive effects of a sales- person’s regional dialect in services selling. Journal of Service Re- search, 14, 460-474. doi:10.1177/1094670511414551 Maynard, D. W., & Schaeffer, N. C. (1997). Keeping the gate. Decli- nations of the request to participate in a telephone survey interview. Sociological Methods and Research, 26, 34-79. doi:10.1177/0049124197026001002 Merkle, D., & Edelman, M. (2002). Nonresponse in exit polls: A com- prehensive analysis. In R. M. Groves, D. A. Dillman, J. L. Eltinge, & J. A. Roderick (Eds.), Survey nonresponse (pp. 243-258). New York: Wiley. Merkle, D., Edelman, M., Dykeman, K., & Brogan, C. (1998). An ex- perimental study of ways to increase exit poll response rates and re- duce survey error. The Annual Meeting of the American Association for Public Opinion Research, St. Louis. Milroy, J., & Milroy, L. (1999). Authority in language: Investigating standard English. London: Routledge. Oksenberg, L., Coleman, L., & Cannel, C. F. (1986). Interviewers’ voices and refusal rates in telephone surveys. Public Opinion Quar- terly, 50, 97-111. doi:10.1086/268962 Oksenberg, L., & Cannell, C. F. (1988). Effects of vocal characteristics on nonresponse. In R. Groves, P. P. Biemer, L. E. Lyberg, J. T. Mas- sey, W. L. Nicholls, & J. Waksberg (Eds.), Telephone survey meth- odology (pp. 257-273). New York: Wiley. Palmen, M.-J. (2001). Response in telephone surveys. A study of the effect of sociolinguistic factors. Nijmegen: Nijmegen University Press. Pickery, J., & Loosveldt, G. (1998). The impact of respondent and in- terviewer characteristics on the number of “no opinion” answers: A multilevel model for count data. Quality and Qu an tit y, 3 2, 31-45. doi:10.1023/A:1004268427793 Pondman, L. M. (1998). The influence of the interviewer on the refusal rate in telephone surveys. Amsterdam: Print Partners Ipskamp. Singer, E. (2006). Introduction. Nonresponse bias in household surveys. Public Opinion Quarterly, 70, 637-645. doi:10.1093/poq/nfl034 Singer, E., van Hoewyk, J., Gebler, N., Ragunathan, T., & McGonacle, K. (1999). The effect of incentives on response rates in interview- mediated surveys. Journal of Offici a l Statistics, 15, 217-230. Smakman, D. (2006). Standard Dutch in the Netherlands. A sociolin- guistic and phonetic description. Utrecht: Lot. Snijkers, C., Hox, J., & de Leeuw, E. D. (1999). Interviewers’ tactics for fighting survey nonresponse. Journal of Official Statistics, 15, 185-198. Steeh, C. (1981). Trends in nonresponse rates. Public Opinion Quar- terly, 45, 40-57. doi:10.1086/268633 Steeh, C., Kirgis, N., Cannon, B., & DeWitt, J. (2001). Are they really as bad as they seem? Nonresponse rates at the end of the 20th cen- tury. Journal of Official Statistics, 17, 227-247. Stoop, I. A. L. (2005). The hunt for the last respondent. Nonresponse in sample surveys. The Hague: Sociaal en Cultureel Planbureau. Stoop, I., Billiet, J., Koch, A., & Fitzgerald. R. (2010). Improving sur- vey response. Lessons learned from the european social survey. Chicester: John Wiley and Sons, Ltd. doi:10.1002/9780470688335 Tielen, M. (1992). Male and female speech: An experimental study of sex-related voice and pronunciation characteristics. Ph.D. Thesis, Amsterdam: University of Amsterdam. Van Bezooijen, R. (1995). Sociocultural aspects of pitch differences between Japanese and Dutch women. Language and Speech, 38, 253- 265. Van der Vaart, W., Ongena, Y., Hoogendoorn, A., & Dijkstra, W. (2005). Do interviewers’ voice characteristics influence cooperation rates in telephone surveys? International Journal of Public Opinion Re- search, 18, 488-499. doi:10.1093/ijpor/edh117 Van Ingen, E., Stoop, I., & Breedveld, K. (2009). Nonresponse in the Dutch time use survey: Strategies for response enhancement and bias reduction. Field Methods, 21, 69-90. doi:10.1177/1525822X08323099 Vercruyssen, A., van de Putte, B., & Stoop, I. A. L. (2011). Are they really too busy for survey participation? The evolution of busyness and busyness claims in Flanders. Journal of Official Statistics, 27, 619-632. Visscher, G. (1999a). Het CBS is niet meer geloofwaardig. Statistics Netherlands is not trustworthy anymore. NRC Handelsblad, 21 Janu- ary 1999. Visscher, G. (1999b). CBS overschrijdt de grens van het betamelijke (Statistics Netherlands exceeds bounds of decency). NRC Handels- blad, 1 February 1999. Walrave, M. (1996). Telemarketing: Breakdown on the line? Leuven/ Amersfoort: Acco. Wenemark, M., Persson, A., Brage, H. N., Svensson, T., & Kristenson, M. (2011). Applying motivation theory to achieve increased response rates, respondent satisfaction, and data quality. Journal of Official Statistics, 27, 393-414.
|