Paper Menu >>
Journal Menu >>
 J. Intelligent Learning Systems & Applications, 2010, 2, 126-138 doi:10.4236/jilsa.2010.23016 Published Online August 2010 (http://www.SciRP.org/journal/jilsa) Copyright © 2010 SciRes. JILSA A New Multilevel Thresholding Method Using Swarm Intelligence Algorithm for Image Segmentation Sathya P. Duraisamy, Ramanujam Kayalvizhi 1The Department of Electrical Engineering, Faculty of Engineering and Technology, Annamalai University, Chidambaram, India; 2Department of Instrumentation Engineering, Faculty of Engineering and Technology, Annamalai University, Chidambaram, India. Email: pd.sathya@yahoo.in, mithuvig.knr@gmail.com Received June 11th, 2010; revised June 29th, 2010; accepted July 20th, 2010. ABSTRACT Thresholding is a popular image segmentation method that converts gray-level image into binary image. The selection of optimum thresholds has remained a challenge over decades. In order to determine thresholds, most methods analyze the histogram of the image. The optimal thresholds are often found by either minimizing or maximizing an objective function with respect to the values of the thresholds. In this paper, a new intelligence algorithm, particle swarm opti- mization (PSO), is presented for multilevel thresholding in image segmentation. This algorithm is used to maximize the Kapur’s and Otsu’s objective functions. The performance of the PSO has been tested on ten sample images and it is found to be superior as compared with genetic algorithm (GA). Keywords: Image Segmentation, Multilevel Thresholding, Particle Swarm Optimization 1. Introduction In many image processing applications, the gray levels of pixels belonging to an object are substantially different from those belonging to the background. As such, thres- holding techniques can be used to extract the objects from their background. Indeed, thresholding is a major operation in many image processing applications such as document processing, image compression, particle coun- ting, cell motion estimation and object recognition. The effect of many image processing applications strongly depends on the effect of image thresholding. Thresholding techniques provide an efficient way, in terms of both the implementation simplicity and the pro- cessing time to perform image segmentation. However, the automatic selection of a robust optimum threshold has remained a challenge in image segmentation. Besides being segmentation on its own, thresholding is frequently used as one of the steps in many advanced segmentation methods. In these applications, thresholding is not ap- plied on the original images, but applied in a space gen- erated by the segmentation method. For example, in fuzzy connectedness segmentation [1], a threshold is applied on the strength of connectedness among image elements to produce a final segmentation. Thus, the methods to de- termine effective thresholds have wide-spread applica- tions. However, automatic determination of the optimum threshold value is often a difficult task. While a number of approaches for automatic threshold determination have been proposed over the past several decades, applying new ideas and concepts to image thresholding remains an interesting and challenging research area. Excellent reviews on early thresholding methods can be found in [2,3], whereas the latest development in this topic was summarized in [4]. Comparative performance studies of global thresholding techniques were presented by Lee et al. [5]. Otsu [6] proposed a method that maxi- mizes between-class variance. Tao et al. [7] proposed a thresholding method for object segmentation based on fuzzy entropy theory and ant colony optimization algo- rithm. An image histogram thresholding approaches us- ing fuzzy sets was proposed by Tobias and Seara [8]. Methods based on optimizing an objective function in- clude maximization of posterior entropy to measure ho- mogeneity of segmented Classes [9-11], maximization of the measure of seperability on the basis of between- class variance [6], thresholding based on index of fuzzi- ness and fuzzy similarity measure [12,13], minimization of Bayesian error [14,15], etc. several such methods have originally been developed for bi-level thresholding and  A New Multilevel Thresholding Method Using Swarm Intelligence Algorithm for Image Segmentation 127 later extended to multilevel thresholding. Bi-level thresholding divides the pixel into two groups, one including those pixels with gray levels above a cer- tain threshold, the other including the rest. Multilevel thresholding divides the pixels into several groups; the pixels of the same group have gray levels within a speci- fied range. However the problem gets more complex when the segmentation is achieved with greater details by employing multilevel thresholding. Then the image segmentation problem becomes a multiclass classifica- tion problem where pixels having gray levels within a specified range are grouped into one class. Usually it is not simple to determine exact locations of distinct valleys in a multimodal histogram of an image, that can segment the image efficiently and hence the problem of multilevel thresholding is regarded as an important area of research interest among the research communities worldwide. A great number of thresholding methods of parametric or non-parametric type have been proposed in order to perform bi-level thresholding [16] and later extended to multilevel thresholding [17]. In [18], the Otsu’s function is modified by a fast recursive algorithm along with a look-up-table for multilevel thresholding. In [19], Lin has proposed a fast thresholding computation using Otsu’s function. Another fast multilevel thresholding technique has been proposed by Yin [20]. In recent years, several heuristic optimization tech- niques such as differential evolution (DE), Ant Colony Optimization (ACO) and Genetic Algorithms (GA) were introduced into the field of image segmentation because of their fast computing ability. Erik Cuevas et al. [21] applied the differential evolution (DE) algorithm to solve the multilevel thressholding problem. The algorithm fills the 1-D histogram of the image using a mix of Gaussian functions whose parameters are calculated using the dif- ferential evolution method. Each Gaussian function ap- proximating the histogram represents a pixel class and therefore a threshold point. Tao et al. [22] proposed the Ant Colony Optimization (ACO) algorithm to obtain the optimal parameters of the entropy-based object segmen- tation approach. Several techniques using genetic algorithms (GAs) have also been proposed to solve the multilevel thresh- olding problem [23,24]. Yin [23] introduced a neighbor- hood searching strategy in to the GA to speed up the multilevel thresholds optimization. Though GA-based approaches perform well for complex optimization prob- lems, recent research has identified certain deficiencies [25], particularly for problems in which variables are highly correlated. In such cases, the GA crossover and mutation operators do not generate individuals with bet- ter fitness of offspring as the chromosomes in the popu- lation pool have some structure towards the end of the search. PSO, first introduced by Kennedy and Eberhart [26] is a flexible, robust, population based stochastic search/opti- mization algorithm with inherent parallelism. This method has gained popularity over its competitors and is in- creasingly gaining acceptance for solving many image processing problems [27-29]. Compared with other popu- lation-based stochastic optimization methods such as DE, ACO and GA, PSO gives superior search performance with faster and more stable convergence rates [26]. This paper presents a new optimal multilevel thresh- olding algorithm; Particle Swarm Optimization (PSO) for solving the multilevel thresholding problem in image segmentation. The validity of the proposed method is tested on ten sample images and compared with the GA method. 2. Problem Formulation In this paper, two broadly used optimal thresholding methods namely entropy criterion (Kapur’s) method and between-class variance (Otsu’s) method are used. Kapur has developed the algorithm for bi-level thresh- olding and this bi-level thresholding can be described as follows: Let there be L gray levels in a given image and these gray levels are in a given image and these gray levels are in the range {0, 1, 2,………,(L-1)}. Then one can define Pi = h(i)/N, (0 ≤ i ≤ (L-1)) where h(i) denotes number of pixels for the corresponding gray-level L and N denotes total number of pixels in the image which is equal to . 1 0 L ihi Then the objective is to maximize the fitness function f(t) = H0 + H1 (1) where 1 0 000 In t ii i PP Hww , and 1 0 0 t i i w P 1 1 11 In L ii it PP Hww , 1 1 L i it wP The optimal threshold is the gray level that maximizes Equation (1). This Kapur’s entropy criterion method tries to achieve a centralized distribution for each histo- gram-based segmented region of the image. This Kapur’s entropy criterion method has also been extended to multilevel thresholding and can be described as follows: The optimal multilevel thresholding problem can be configured as a m-dimensional optimization pro- blem, for determination of m optimal thresholds for a given image [t1, t2 …tm], where the aim is to maximize the objective function: f([t1, t2, ……tm]) = H0 + H1 + H2 +….+ Hm (2) where Copyright © 2010 SciRes. JILSA  A New Multilevel Thresholding Method Using Swarm Intelligence Algorithm for Image Segmentation 128 11 0 000 In t ii i PP Hww , 11 0 0 t i i wP 2 1 1 1 11 In t ii it PP Hww , 2 1 1 1 t i it wP 3 2 1 2 22 In t ii it PP Hww , ,….. 3 2 1 2 t i it wP 1 In m L ii m it mm PP Hww , . 1 m L mi it wP As Kapur based entropy criterion method, the Otsu based between-class variance method has also been em- ployed in determining whether the optimal thresholding can provide histogram-based image segmentation with satisfactory desired. The Otsu based between-class vari- ance algorithm can be described as follows: If an image can be divided into two classes, C0 and C1, by a threshold at a level t, class C0 contains the gray lev- els from 0 to t-1 and class C1 consists of the other gray levels with t to L-1. Then, the gray level probabilities ( and ) distributions for the two classes are as follows: 0 w1 w 01 0 00 : , ...... t PP Cww and 1 1 11 : , ...... tL PP Cww . where, and 1 0 0 t i i w P 1 1 L i it wP Mean levels μ0 and μ1 for classes C0 and C1 are as fol- lows: 1 0 00 t i i iP w , 1 1 1 L i it iP w . Let μT be the mean intensity for the whole image, it is easy to show that 00 11T ww and 01 1ww Using discriminant analysis, Otsu based between-class variance thresholded image can be defined as follows: 01 ft where and 2 000T w L 2 111T w For bi-level thresholding, Otsu selects an optimal threshold t* that maximizes the between-class variance f(t); that is *arg max 0-1tftt The above formula can be easily extended to multi- level thresholding of an image. Assuming that there are m thresholds, (t0, t1, …., tm), which divide the original image into m classes: C0 for [0, …., t1-1], C1 for [t1, …., t2−1] ….. and Cm for [tm, …., L−1], the optimal thresh- olds ** * 01 , , ...., m tt t are chosen by maximizing f(t) as follows: *** 01 1 , , ...., arg max 0....-1 mm tttfttt L (3) where 012 ..... m ft with , 2 000 T w 2 111 T w , 2 222T w ,….. 2 mmmT w . The Kapur and Otsu methods have been proven as an efficient method for bi-level thresholding in image seg- mentation. However, when these methods are extended to multilevel thresholding, the computation time grows exponentially with the number of thresholds. It would limit the multilevel thresholding applications. To over- come the above problem, this paper proposes the Kapur and Otsu based PSO algorithm for solving multilevel thresholding problem. The aim of this proposed method is to maximize the Kapur’s and Otsu’s objective function using Equations (2) and (3). 3. Particle Swarm O p t imization (PSO) PSO is a simple end efficient population-based optimiza- tion method proposed by Kennedy and Eberhart [24]. It is motivated by social behavior of organisms such as fish schooling and bird flocking. In PSO, potential solutions called particles fly around in a multi-dimensional prob- lem space. Population of particles is called swarm. Each particle in a swarm flies in the search space towards the optimum solution based on its own experience, experi- ence of nearby particles, and global best position among particles in the swarm. 3.1 Advantages of PSO 1) PSO is easy to implement and only few parameters have to be adjusted. 2) Unlike the GA, PSO has no evolution operators such as crossover and mutation. 3) In GAs, chromosomes share information so that the whole population moves like one group, but in PSO, only global best particle (gbest) gives out information to the others. It is more robust than GAs. 4) PSO can be more efficient than GAs; that is, PSO often finds the solution with fewer objective function evaluations than that required by GAs. Unlike GAs and other heuristic algorithms, PSO has the Copyright © 2010 SciRes. JILSA  A New Multilevel Thresholding Method Using Swarm Intelligence Algorithm for Image Segmentation 129 flexibility to control the balance between global and local exploration of the search space. 3.2 PSO Algorithm Let X and V denote the particle’s position and its corre- sponding velocity in search space respectively. At itera- tion K, each particle i has its position defined by Xi K = [Xi,1, Xi,2 ….Xi,N ] and a velocity is defined as Vi K = [Vi,1, Vi, 2……Vi, N] in search space N. Velocity and position of each particle in the next iteration can be calculated as Vi,n k+1 = W Vi,n k + C1 rand1 (pbesti,n – Xi,n k) + C2 rand2 (gbestn – Xi,n k) i = 1, 2………m n = 1, 2……….N (4) Xi,n k+1 = Xi,n k + Vi,n k+1 if Xmin,i,n Xi k+1 Xmax i,n = Xmin i,n if Xi,n k+1 Xmin i,n = Xmax i,n if Xi,n k+1 > Xmax i,n (5) The inertia weight W is an important factor for the PSO’s convergence. It is used to control the impact of previous history of velocities on the current velocity. A large inertia weight factor facilitates global exploration (i.e., searching of new area) while small weight factor facilitates local exploration. Therefore, it is better to choose large weight factor for initial iterations and gradually reduce weight factor in successive iterations. This can be done by using W = Wmax − (Wmax – Wmin) × Iter/Itermax Where W max and W min are initial and final weight re- spectively, Iter is current iteration number and Iter max is maximum iteration number. Acceleration constant C1 called cognitive parameter pulls each particle towards local best position whereas constant C2 called social parameter pulls the particle to- wards global best position. The particle position is modi- fied by Equation (4). The process is repeated until stop- ping criterion is reached. 4. Implementation of PSO for Multilevel Thresholding Problem This paper presents a quick solution to the multilevel image thresholding problems using the PSO algorithm. The number of threshold levels is the dimension of the problem. For example, if there are ‘m’ threshold levels, the ith particle is represented as follows: Xi = (Xi1, Xi2, ………., Xim) Its implementation consists of the following steps. Step 1. Initialization of the swarm: For a population size p, the particles are randomly generated between the minimum and the maximum limits of the threshold val- ues. Step 2. Evaluation of the objective function: The ob- jective function values of the particles are evaluated us- ing the objective functions given by Equation (2) or (3). Step 3. Initialization of pbest and gbest: The objective values obtained above for the initial particles of the swarm are set as the initial pbest values of the particles. The best value among all the pbest values is identified as gbest. Step 4. Evaluation of velocity: The new velocity for each particle is computed using Equation (4). Step 5. Update the swarm: The particle position is up- dated using Equation (5). The values of the objective function are calculated for the updated positions of the particles. If the new value is better than the previous pbest, the new value is set to pbest. Similarly, gbest value is also updated as the best pbest. Step 6. Stopping criteria: If the stopping criteria are met, the positions of particles represented by gbest are the optimal threshold values. Otherwise, the procedure is repeated from step 4. 5. Experimental Results and Discussions In this section, the effectiveness and feasibility of the proposed PSO method for multilevel thresholding is demonstrated. Comparisons are performed with the re- sults provided by GA based multilevel thresholding method. Tables 1 and 2 represent the various parameters chosen for the implementation of GA and PSO algo- rithms respectively. Ten well-known images namely lena, pepper, baboon, hunter, map, cameraman, living room, house, airplane and butterfly are taken as the test images, and are gathered with their histograms in Figure 1. The quality of the thresholded images for Kapur based Table 1. Parameters chosen for GA implementation Parameter Value Population size 20 No. of Iterations 100 Crossover probability 0.9 Mutation probability 0.1 Selection operator Roulette Wheel Selection Table 2. Parameters chosen for PSO implementation Parameter Value Swam Size 20 No. of Iterations 100 Wmax, wmin 0.4,0.1 C1,C2 2 Copyright © 2010 SciRes. JILSA  A New Multilevel Thresholding Method Using Swarm Intelligence Algorithm for Image Segmentation Copyright © 2010 SciRes. JILSA 130 (a) (a’) (b) (b’) (c) (c’)  A New Multilevel Thresholding Method Using Swarm Intelligence Algorithm for Image Segmentation 131 (d) (d’) (e) (e’) (f) (f’) Copyright © 2010 SciRes. JILSA 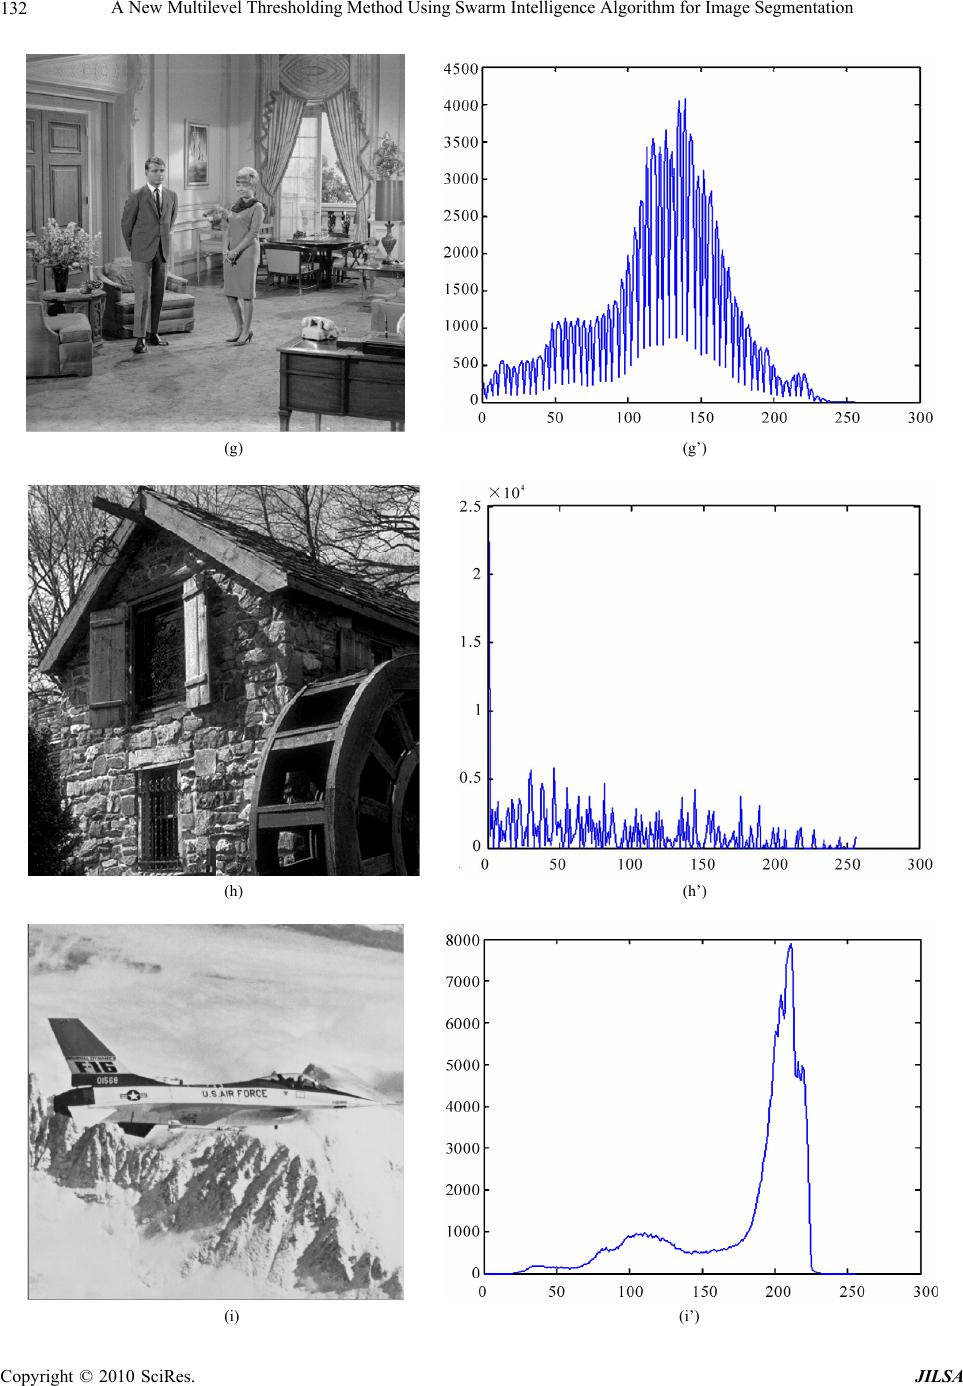 A New Multilevel Thresholding Method Using Swarm Intelligence Algorithm for Image Segmentation 132 (g) (g’) (h) (h’) (i) (i’) Copyright © 2010 SciRes. JILSA 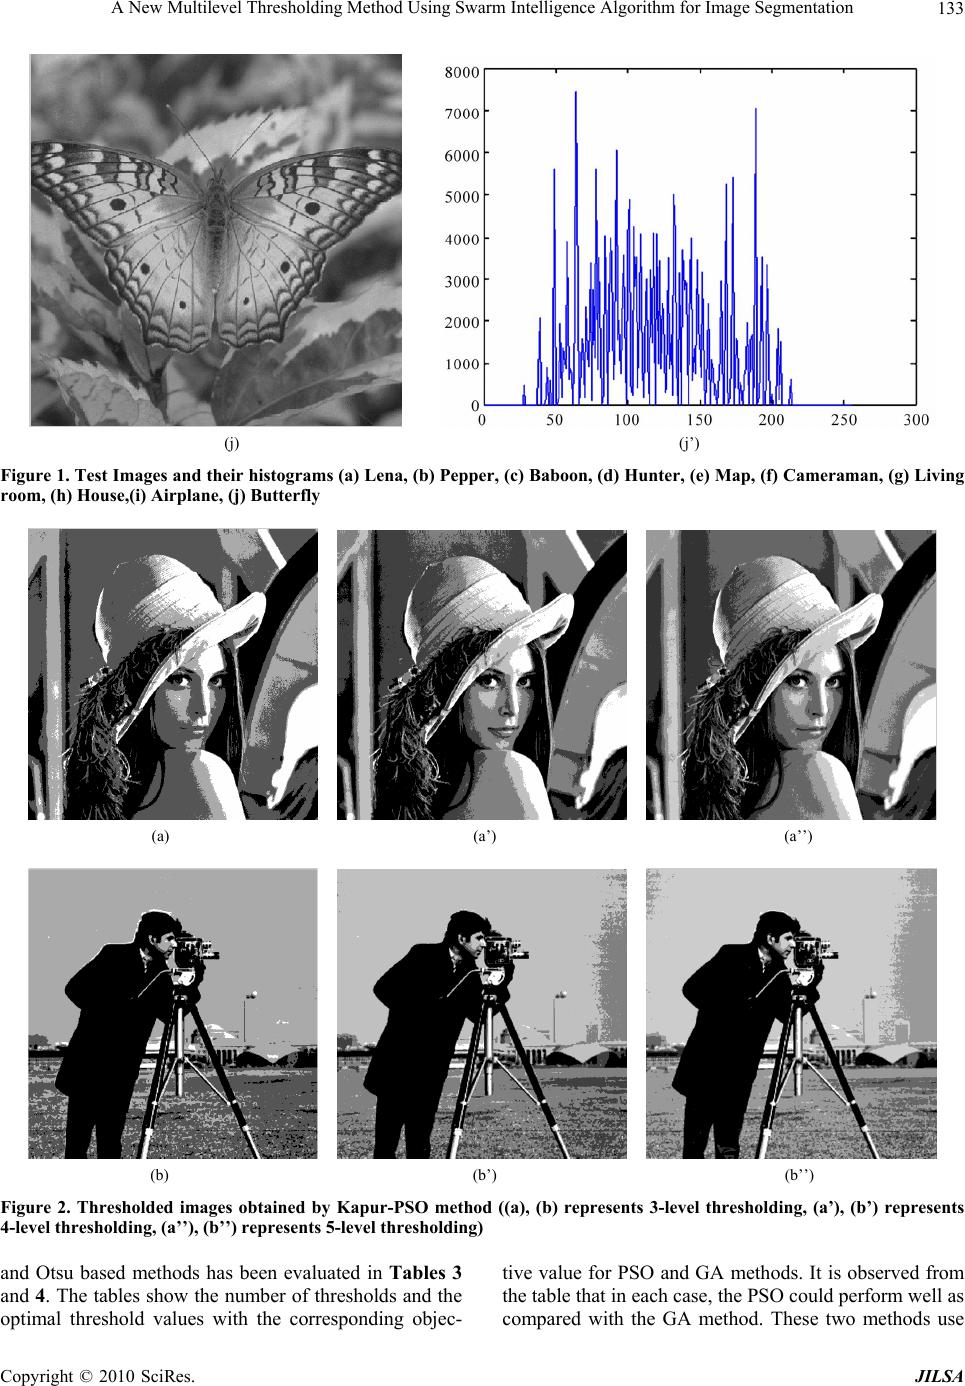 A New Multilevel Thresholding Method Using Swarm Intelligence Algorithm for Image Segmentation Copyright © 2010 SciRes. JILSA 133 (j) (j’) Figure 1. Test Images and their histograms (a) Lena, (b) Pepper, (c) Baboon, (d) Hunter, (e) Map, (f) Cameraman, (g) Living room, (h) House,(i) Airplane, (j) Butterfly (a) (a’) (a’’) (b) (b’) (b’’) Figure 2. Thresholded images obtained by Kapur-PSO method ((a), (b) represents 3-level thresholding, (a’), (b’) represents 4-level thresholding, (a’’), (b’’) represents 5-level thresholding) and Otsu based methods has been evaluated in Tables 3 and 4. The tables show the number of thresholds and the tive value for PSO and GA methods. It is observed from the table that in each case, the PSO could perform well as optimal threshold values with the corresponding objec-compared with the GA method. These two methods use  A New Multilevel Thresholding Method Using Swarm Intelligence Algorithm for Image Segmentation 134 Table 3. Comparison of optimal threshold values and objective values obtained by Kapur method Optimal threshold values Objective values Test Im PSO GA PSO GA ages m 2 9104,7 12.9 12.4 9,165 16345334 3 86,151,180 72,151,180 15.1336 14.9956 129,191 57,110,4 LENA 7 96,8 72, PEPPER 0 77,9 0 90,8 BABOON 2 96,7 70, 131,200 64,100,200 HUNTER 9 87, 62, 128,207 96,113,218 MAP 5 85,1 12. 11. 15. 14. 116,2 71,80, CAMERAMAN 66,9 124,202 74,137,175 LIVINGROOM 60,0 3 83,3 HOUSE 81,9 129,188 87,124,187 AIRPLANE 2 95,6 4 111,3 5 92,116,142,157,182 75,105,140,179,198 16.3374 15.7566 4 92,162,178,1817.8388 17.0892 5 74,115,145,170,19112,151,186,1920.4427 19.5492 2 79,146 82,146 108, 12.5168 12.5133 3 104,141,180 127,186 15.0939 14.7122 4 57,110,162,199 102,172,204 18.0974 17.6959 5 70,116,138,166,20107,124,178,2020.7338 20.0691 2 76,144 93,152 64, 12.2134 12.1847 3 72,130,181 151,181 15.0088 14.7457 4 65,121,153,18106,152,1817.5743 16.9356 5 73,110,142,166,19126,150,172,1920.2245 19.6622 2 83,179 75,178 12.3708 12.3496 3 85, 4 74, 128,166 174, 148,167 189, 15.1286 18.0401 14.8381 17.3189 5 90,120,164,190,2196,128,196,21320.5339 19.5635 2 97,181 84,174 4.9789 4.9610 3 74, 4 92, 140,181 152, 94,156 186, 5.5030 5.6903 5.1351 5.0740 5 66,109,121,150,19114,159,192,215.9165 5.4302 2 115, 3 96, 196 138,191 76,195 111,165,189 2595 2110 9414 8278 4 77,151,20141,192 18.0009 17.1665 5 64,95,121,156,198110,169,180,2020.9631 19.7950 2 86, 3 73, 175 158,187 84,171 74,138,160 12.4000 15.2123 12.3923 14.9700 4 59,172,164,18.1410 17.2063 5 72,97,119,158,197120,148,155,2020.6752 19.8410 2 81, 3 81, 144 116,155 91,145 96,134,164 10.8321 13.1006 10.7436 12.8473 4 75,123,154,19135,170,1915.1027 14.6588 5 48, 2 80, 97,139,159,189 175 107,132,157,18 90,176 17.2517 12.1503 16.9452 12.1153 3 72,121,191 75,110,199 15.2925 14.8059 4 74,162,154,18.0300 17.8923 5 81,118,144,167,19121,141,151,1920.3964 19.4465 2 95, 3 63, 141 126,172 93,142 96,103,167 10.4743 12.3130 10.4707 11.6280 4 71,113,162,18149,155,1714.2317 13.3144 BUTTERFLY Copyright © 2010 SciRes. JILSA  A New Multilevel Thresholding Method Using Swarm Intelligence Algorithm for Image Segmentation 135 Table 4. Coparison ofold valuealues obtaOtsu metho threshojective value m optimal threshs and objective vined by d Optimalld values Obs Test Images m PSO GA PSO GA 2 94,1,149 1961.40.9603 52 91149 196 3 79,80,73 211 2127 78,15 80,15 LENA 79,18 80,13 57,72 62,17 PEPPER 56,79 52,91 79,14 82,13 BABOON 74,10 73,19 36,57 39,63 HUNTER 37,877 39,904 92,06 90,14 MAP 79,14 68,14 65,12 59,13 CAMERAMAN 45,72 51,14 69,18 71,12 LIVINGROOM 56,90 65,19 40,94 41,84 HOUSE 32,88 48,19 84,01 71,00 AIRPLANE 60,14 84,14 80,17 82,84 BUTTERFLY 75,10 77,15 127,170 124,127.7776.410 4 12,134,1726,159,182180.6868 2173.7148 5 10,140,167,1816,146,179,212212.5555 2196.2745 2 76,144 84,144 2469.5788 2457.1517 3 72,124,171 65,116,175 2623.2739 2614.0841 4 92,130,108,142,172695.8867 2682.8391 5 84,115,150,190,128,166,12733.5097 2725.8750 2 96,149 98,151 1547.9977 1547.6588 3 85,126,166 86,125,155 1635.3623 1633.5220 4 05,140,1722,146,171684.3363 1677.7052 5 04,134,161,1806,140,167,191712.9582 1699.3909 2 52,116 51,115 3064.0688 3064.0156 3 39,86,135 36,89,133 3212.0585 3211.7947 4 84,130,193,142,13257.1767 3231.1313 5 5,125,154,14,130,169,23276.3173 3244.7387 2 113,177 81,173 2340.3950 2252.3864 3 81,145,197 83,132,181 2526.3034 2503.7932 4 133,162,210,158,202618.4894 2617.9534 5 16,139,162,2006,138,170,212665.4116 2660.8599 2 71,143 72,145 3609.3703 3609.0761 3 71,134,166 71,143,196 3677.1783 3643.2153 4 21,147,1719,155,203722.6447 3710.7311 5 78,121,146,106,141,167,193764.9571 3755.5529 2 88,145 89,155 1627.7966 1627.0537 3 81,127,165 83,132,174 1757.4664 1748.6885 4 10,143,1716,150,181822.1136 1816.0692 5 98,128,156,104,133,160,181865.4766 1858.0959 2 57,127 56,124 3420.9868 3418.4387 3 48,104,165 50,119,182 3617.9836 3592.1268 4 88,140,198,149,13702.2895 3686.1240 5 74,129,158,106,136,169,193752.1468 3700.3010 2 117,174 116,175 1837.7222 1837.7144 3 99,158,193 86,133,204 1905.7664 1844.5642 4 125,168,2119,164,21953.8872 1950.5919 5 01,138,177,2024,164,188,201977.9742 1973.0894 2 99,150 100,151 1553.0687 1552.4129 3 79,119,164 74,115,155 1665.7589 1662.6963 4 13,145,17119,154,11702.9069 1696.6940 5 06,129,157,1807,134,171,181730.7879 1716.0428 Copyright © 2010 SciRes. JILSA  A New Multilevel Thresholding Method Using Swarm Intelligence Algorithm for Image Segmentation 136 Table 5. Comparison of standard deviation and CPU ds) for Ktsu met ation n time time (in seconapur and Ohods Standard DeviComputatio Kapur method Otsu method Kapur method Otsu method Test PSO GA PSO GA PSO GGA Images m A PSO 2 0.9 0.17 7.9 3.5788 0033 0.004423 0.2078594 8.54681 3.96 3 0 00. 8. 4 5. LENA PEPPER BABOON HUNTER MAP CAMERAMAN LIVINGROOM HOUSE AIRPLANE 0.0390.1100.4155 55558.35948594.40312969 4 0.1810 0.2594 2.3601 3.0640 9.1719 9.5156 4.7500 5.6094 5 0.2181 0.3043 4.5341 5.7362 9.4063 10.1250 5.2031 5.8938 2 0.0012 0.0031 0.0956 0.1455 7.1358 8.6492 3.4010 3.8569 3 0.0764 0.1750 0.1629 0.2891 7.6250 9.1056 4.3125 4.9787 4 0.1080 0.2707 2.1102 3.9721 8.1254 9.6406 4.6719 5.5156 5 0.1758 0.3048 3.2057 4.9999 8.4844 9.9688 4.8125 5.9844 2 0.0077 0.0567 0.1040 0.2224 8.0016 8.3563 3.8469 4.3969 3 0.0816 0.1580 0.5720 1.5317 8.7188 9.3750 4.3125 4.7969 4 0.0853 0.1765 2.1501 3.0653 9.1084 9.6750 4.9063 5.6094 5 0.1899 0.2775 3.4447 4.6721 9.7813 10.1875 5.3281 6.0109 2 0.0068 0.0148 0.2282 0.3283 8.000 8.6406 3.8438 4.4063 3 0.0936 0.1741 0.8203 1.8080 8.7031 9.9844 4.4844 4.8625 4 0.1560 0.2192 2.9836 6.3644 9.0313 9.6219 4.8125 5.3906 5 0.2720 0.3466 7.3030 11.1247 10.1406 10.6094 5.3031 6.1563 2 0.0023 0.0030 1.2241 1.8856 6.8906 7.4625 3.6094 4.2000 3 0.1153 0.1226 1.2298 2.1368 7.1563 7.6563 4.4219 4.9688 4 0.1366 0.1849 2.2333 4.5790 8.1250 8.9094 4.8750 5.5156 5 0.1521 0.1901 3.4511 6.3580 8.3594 9.7969 5.7500 6.4188 2 0.1001 0.1270 0.0908 0.3812 8.4844 9.2500 3.4844 3.9531 3 0.1107 0.2136 6.3502 9.4711 9.0625 9.7000 4.1250 4.8125 4 0.2005 0.2857 2.4498 4.5059 9.1250 9.9844 4.7406 5.2500 5 0.2734 0.3528 8.9650 11.0079 10.1094 10.9688 5.2656 6.0025 2 0.0022 0.0039 0.2637 0.5425 7.5844 8.2156 3.3281 3.7656 3 0.0718 0.1364 1.0446 2.4428 8.7188 9.6250 4.0469 4.9531 4 0.2286 0.3220 2.0787 3.0313 9.1001 9.7656 4.5000 5.1056 5 0.2619 0.3805 2.2655 4.3189 10.1719 10.5631 5.7969 6.6094 2 0.0224 0.0637 0.8001 1.7181 7.9063 8.3656 3.6252 4.4313 3 0.0805 0.1549 3.1018 6.2939 8.2626 9.2500 4.2969 4.9844 4 0.1324 0.2555 3.7038 8.2156 8.8438 9.5938 4.6094 5.3750 5 0.1824 0.2696 6.5478 9.9390 9.6406 10.0938 5.7344 6.6963 2 0.0106 0.0305 1.1731 2.7001 7.9844 8.7188 3.4688 4.0000 3 0.1248 0.1958 2.5107 5.0948 8.9688 10.4844 4.5938 5.1875 4 0.1424 0.3011 3.4728 7.0157 9.2031 9.9531 4.7969 5.3594 5 0.2760 0.3369 4.7571 8.6500 9.9688 10.4031 5.0781 5.8125 2 0.0025 0.0872 1.6744 2.3493 7.7188 8.4906 3.5313 3.9219 3 0.1880 0.2021 2.2356 3.4016 8.5469 9.4656 4.1875 4.9531 4 0.2473 0.2596 4.2227 5.2383 9.0000 9.8659 4.8281 5.5156 BUTTERFLY 5 0.2821 0.3977 5.1212 6.2719 9.3813 10.2469 5.4594 6.1313 Copyright © 2010 SciRes. JILSA  A New Multilevel Thresholding Method Using Swarm Intelligence Algorithm for Image Segmentation Copyright © 2010 SciRes. JILSA 137 (a) (a’) (a’’) (b) (b’) (b’’) Figure 3. Thresholded images obtainedd ((a), (b) represen-level thresholding, (a’), (b’) represents 4-level thresholdin rm optimization (PSO) based segmentation. In order to verify the efficiency and effec- tiveness of the proposed PSO approach, ten standard test ated. The performance of this ap- mpared with the GA method, and it is cessing, Vol. 58, No. 3, 1996, pp. 246-261. [2] P. K. Sahoo, Song, “A Survey of Thresholding Vision, Graphics by Otsu-PSO methots 3 g, (a’’), (b’’) represents 5-level thresholding) the objective function to decide whether the number of hresholds has reached the optimal value or not. The multilevel thresholding has been presented for image t higher value of the objective function results in better segmentation. For a visual interpretation of the segmentation results, the segmented lena and cameraman images for both Ka- pu images are investig proach has been co found that PSO outperforms GA approach in terms of solution quality, convergence and robustness. Compared with all the cases, the Kapur-PSO gives lower standard deviation value. Even though the Kapur-PSO gives lower standard deviation, the Otsu-PSO method converges quickly than the Kapur method. Hence, the Otsu-PSO approach is an efficient tool for finding optimized thre- shold values. REFERENCES [1] J. K. Udupa and S. Samarasekera, “Fuzzy Connectedness and Object Definition: Theory, Algorithms and Applica- Image Segmentation,” Graphical Models and r-PSO and Otsu-PSO with m = 3, 4 and 5 are pre- sented in Figures 2 and 3 respectively. It can be easily seen that the quality of segmentation is better, in each case, when m = 5 is chosen. The standard deviation values and computation time obtained from Kapur and Otsu based evolutionary algo- rithms are given in Tabl e 5. The higher value of standard deviation shows that the results of experiment are unsta- ble. From the tables, it is seen that the PSO method is more stable than the GA method. It is also observed from the table that, even though the Kapur-based method gives lower standard deviation than the Otsu’s method, the computation time of Kapur based PSO is higher than the Otsu based PSO. 6. Conclusions In this paper, particle swa tions in Image Pro . Soltani and A. K. C. W Techniques,” Computer and Image Processing, Vol. 41, No. 2, 1998, pp. 233-260. [3] N. P. Pal and S. K. Pal, “A Review on Image Segmenta-  A New Multilevel Thresholding Method Using Swarm Intelligence Algorithm for Image Segmentation 138 tion Techniques,” Pattern Recognition, Vol. 26, No. 9, 1993, pp. 1277-1294. [4] M. Sezgin and B. Sankar, “Survey over Image Thresh- olding Techniques and Quantitative Performance Evalua- tion,” Journal of Electronic Imaging, Vol. 13, No. 1, 2004, pp. 146-165. [5] S. U. Lee, S. Y. Chung and R. H. Park, “A Comparative Performance Study of Several Global Thresholding hold Selection Method from Gray ecognition Letters, Vol. 28, No. 7, 2007, pp ransac- r Gray-Level Picture Thresholding Using the , Graphics and Image Processing, Vol. 16, 5, pp.49-56. m Error Thresh- “A Comparison of . 17, No. 5, 2001, pp. n and Applications, Vol. 13, No. 5-6, 2003, pp. o. 3, 1997, pp. 305-313. ert Systems with . 7, 95. ernational Journal of Hybrid In- th, Vol. 4, 1995, pp. 1942-1948. o. 1, 2008, pp. Image and Vision Computing, Vol. 26, No. 8, Techniques for Segmentation,” Computer Vision, Graph- ics and Image Processing, Vol. 52, No. 2, 1990, pp. 171-190. [6] N. Otsu, “A Thres- 254 Level Histograms,” IEEE Transaction on Systems, Man and Cybernetics, Vol. 9, No. 1, 1979, pp. 62-66. [7] W. Tao, H. Jin and L. Liu, “Object Segmentation Using Ant Colony Optimization Algorithm and Fuzzy Entropy,” Pattern R. [2 788-796. [8] O. J. Tobias and R. Seara, “Image Segmentation by His- togram Thresholding Using Fuzzy Sets,” IEEE T tion on Image Processing, Vol. 11, No. 12, 2002, pp. 1457-1465. [9] J. N. Kapur, P. K. Sahoo and A. K. C. Wong, “A New Method fo Entropy of The Histogram,” Computer Vision, Graphics and Image Processing, Vol. 29, No. 3, 1985, pp. 273-285. [10] T. Pun, “Entropy Thresholding: A New Approach,” Com- puter Vision No. 3, 1981, pp. 210-239. [11] A. D. Brink, “Minimum Spatial Entropy Threshold Selec- tion,” IEEE Proceedings, Vision Image and Signal Proc- essing, Vol. 142, No. 3, 1995, pp. 128-132. [12] X. Li, Z. Zhao and H. D. Cheng, “Fuzzy Entropy Thresh- old Approach to Breast Cancer Detection,” Information Sciences, Vol. 4, No. 1, 199 [13] L. K. Huang and M. J. Wang, “Image Thresholding by Minimizing the Measure of Fuzziness,” Pattern Recogni- tion, Vol. 28, No. 1, 1995, pp. 41-51. [14] J. Kittler and J. Illingworth, “Minimum Error Threshold- ing,” Pattern Recognition, Vol. 19, No. 1, 1986, pp. 41-47. [15] Q. Ye and P. Danielsson, “On Minimu olding and its Implementation,” Pattern Recognition Let- ters, Vol. 7, No. 4, 1988, pp. 201-206. [16] U. Gonzales-Baron and F. Butler, 789- Seven Thresholding Techniques with the K-Means Clus- tering Algorithm for Measurement of Bread-Crumb Fea- tures by Digital Image Analysis,” Journal of Food Engi- neering, Vol. 74, No. 2, 2006, pp. 268-278. [17] P. Y. Yin and L. H. Chen, “A Fast Iterative Scheme For Multilevel Thresholding Methods,” Signal Processing, Vol. 60, No. 3, 1997, pp. 305-313. [18] P. S. T. Liao, S. Chen and P. C. Chung, “A Fast Algo- rithm for Multilevel Thresholding,” Journal of Informa- tion Science and Engineering, Vol 713-727. [19] K. C. Lin, “Fast Image Thresholding by Finding Zero(S) of the First Derivative of between Class Variance,” Ma- chine Visio -262. [20] P.-Y. Yin and L.-H. Chen, “A Fast Iterative Scheme for Multilevel Thresholding Methods,” Signal Processing, Vol. 60, N 1] E. Cuevas, D. Zaldivar and M. Perez-Cisneros, “A Novel Multi-Threshold Segmentation Approach Based on Dif- ferential Evolution Optimization,” Exp Applications, Vol. 37, No. 7, 2010, pp. 5265-5271. [22] W. B. Tao, H. Jin and L. M. Liu, “Object Segmentation Using Ant Colony Optimization Algorithm and Fuzzy Entropy,” Pattern Recognition Letters, Vol. 28, No 2008, pp. 788-796. [23] P. Y. Yin, “A Fast Scheme for Optimal Thresholding Using Genetic Algorithms,” Signal Processing, Vol. 72, No. 2, 1999, pp. 85- [24] C. C. Lai and D. C. Tseng, “A Hybrid Approach Using Gaussian Smoothing and Genetic Algorithm for Multi- level Thresholding,” Int telligent Systems, Vol. 1, No. 3, 2004, pp. 143-152. [25] D. B. Fogel, “Evolutionary Computation: Toward a New Philosophy of Machine Intelligence,” 2nd Edition, IEEE Press, Piscataway, 2000. [26] J. Kennedy and R. Eberhart, “Particle Swarm Optimiza- tion,” Proceedings of the IEEE Conference on Neural Networks—ICNN’95, Per [27] Y.-T. Kao, E. Zahara and I-W. Kao, “A Hybridized Ap- proach to Data Clustering,” Expert Systems with Applica- tions, Vol. 34, No. 3, 2008, pp. 1754-1762. [28] Z.-J. Lee, S.-W. Lin, S.-F. Su and C.-Y. Lin, “A Hybrid Watermarking Technique Applied to Digital Images,” Expert Systems with Applications, Vol. 8, N 808. [29] C.-C. Tseng, J.-G. Hsieh and J.-H. Jeng, “Fractal Image Compression Using Visual-Based Particle Swarm Opti- mization,” 2008, pp. 1154-1162. Copyright © 2010 SciRes. JILSA |