Paper Menu >>
Journal Menu >>
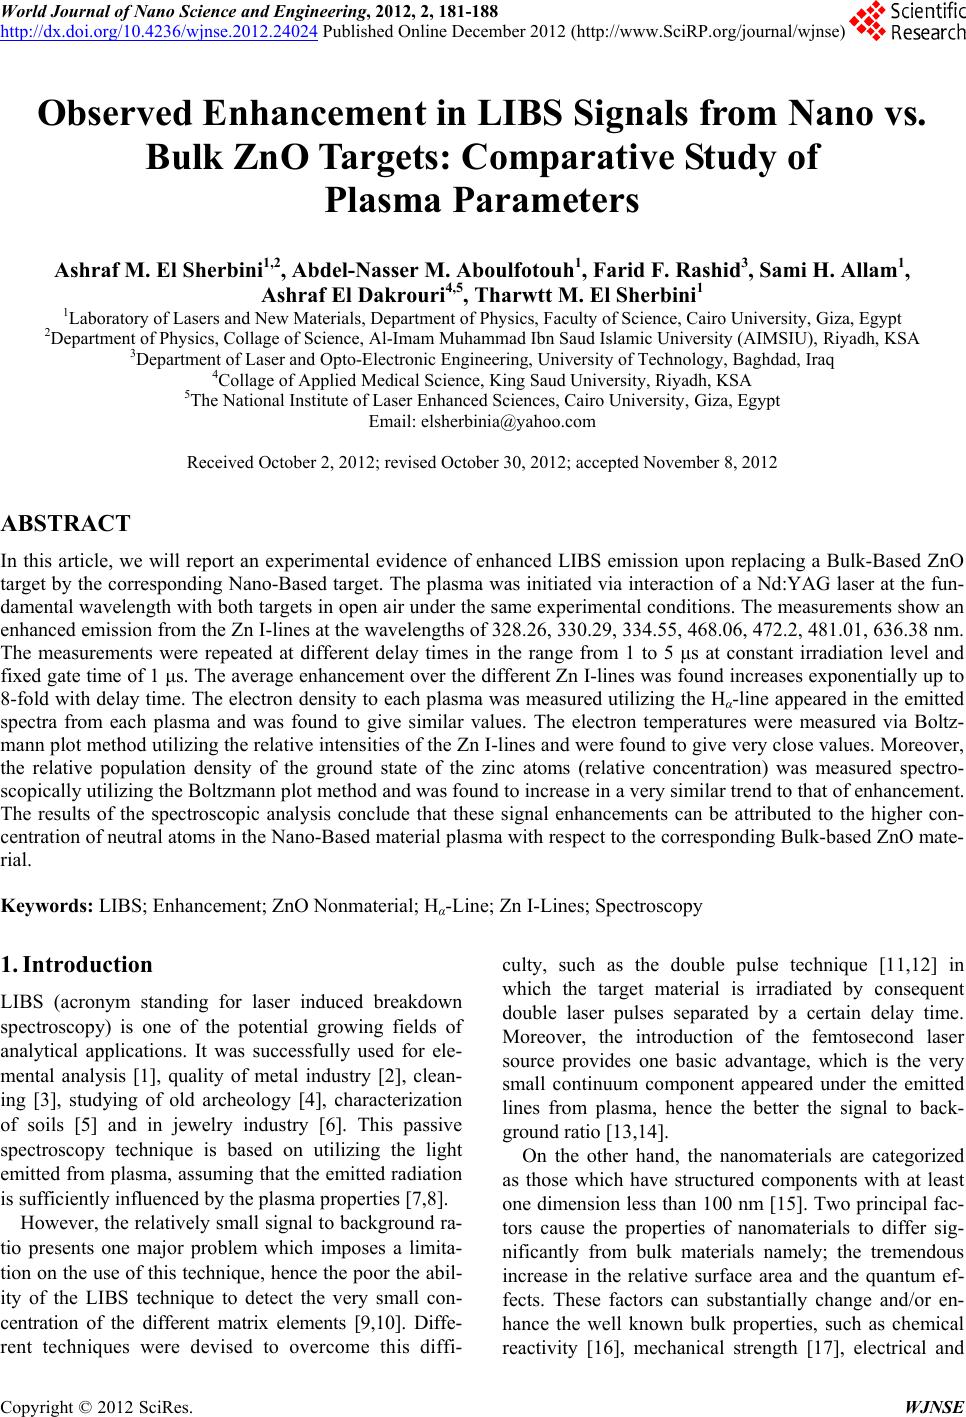 World Journal of Nano Science and Engineering, 2012, 2, 181-188 http://dx.doi.org/10.4236/wjnse.2012.24024 Published Online December 2012 (http://www.SciRP.org/journal/wjnse) Observed Enhancement in LIBS Signals from Nano vs. Bulk ZnO Targets: Comparative Study of Plasma Parameters Ashraf M. El Sherbini1,2, Abdel-Nasser M. Aboulfotouh1, Farid F. Rashid3, Sami H. Allam1, Ashraf El Dakrouri4,5, Tharwtt M. El Sherbini1 1Laboratory of Lasers and New Materials, Department of Physics, Faculty of Science, Cairo University, Giza, Egypt 2Department of Physics, Collage of Science, Al-Imam Muhammad Ibn Saud Islamic University (AIMSIU), Riyadh, KSA 3Department of Laser and Opto-Electronic Engineering, University of Technology, Baghdad, Iraq 4Collage of Applied Medical Science, King Saud University, Riyadh, KSA 5The National Institute of Laser Enhanced Sciences, Cairo University, Giza, Egypt Email: elsherbinia@yahoo.com Received October 2, 2012; revised October 30, 2012; accepted November 8, 2012 ABSTRACT In this article, we will report an experimental evidence of enhanced LIBS emission upon replacing a Bulk-Based ZnO target by the corresponding Nano-Based target. The plasma was initiated via interaction of a Nd:YAG laser at the fun- damental wavelength with both targets in open air under the same experimental conditions. The measurements show an enhanced emission from the Zn I-lines at the wavelengths of 328.26, 330.29, 334.55, 468.06, 472.2, 481.01, 636.38 nm. The measurements were repeated at different delay times in the range from 1 to 5 μs at constant irradiation level and fixed gate time of 1 μs. The average enhancement over the different Zn I-lines was found increases exponentially up to 8-fold with delay time. The electron density to each plasma was measured utilizing the Hα-line appeared in the emitted spectra from each plasma and was found to give similar values. The electron temperatures were measured via Boltz- mann plot method utilizing the relative intensities of the Zn I-lines and were found to give very close values. Moreover, the relative population density of the ground state of the zinc atoms (relative concentration) was measured spectro- scopically utilizing the Boltzmann plot method and was found to increase in a very similar trend to that of enhancement. The results of the spectroscopic analysis conclude that these signal enhancements can be attributed to the higher con- centration of neutral atoms in the Nano-Based material plasma with respect to the corresponding Bulk-based ZnO mate- rial. Keywords: LIBS; Enhancement; ZnO Nonmaterial; Hα-Line; Zn I-Lines; Spectroscopy 1. Introduction LIBS (acronym standing for laser induced breakdown spectroscopy) is one of the potential growing fields of analytical applications. It was successfully used for ele- mental analysis [1], quality of metal industry [2], clean- ing [3], studying of old archeology [4], characterization of soils [5] and in jewelry industry [6]. This passive spectroscopy technique is based on utilizing the light emitted from plasma, assuming that the emitted radiation is sufficiently influenced by the plasma properties [7,8]. However, the relatively small signal to background ra- tio presents one major problem which imposes a limita- tion on the use of this technique, hence the poor the abil- ity of the LIBS technique to detect the very small con- centration of the different matrix elements [9,10]. Diffe- rent techniques were devised to overcome this diffi- culty, such as the double pulse technique [11,12] in which the target material is irradiated by consequent double laser pulses separated by a certain delay time. Moreover, the introduction of the femtosecond laser source provides one basic advantage, which is the very small continuum component appeared under the emitted lines from plasma, hence the better the signal to back- ground ratio [13,14]. On the other hand, the nanomaterials are categorized as those which have structured components with at least one dimension less than 100 nm [15]. Two principal fac- tors cause the properties of nanomaterials to differ sig- nificantly from bulk materials namely; the tremendous increase in the relative surface area and the quantum ef- fects. These factors can substantially change and/or en- hance the well known bulk properties, such as chemical reactivity [16], mechanical strength [17], electrical and C opyright © 2012 SciRes. WJNSE 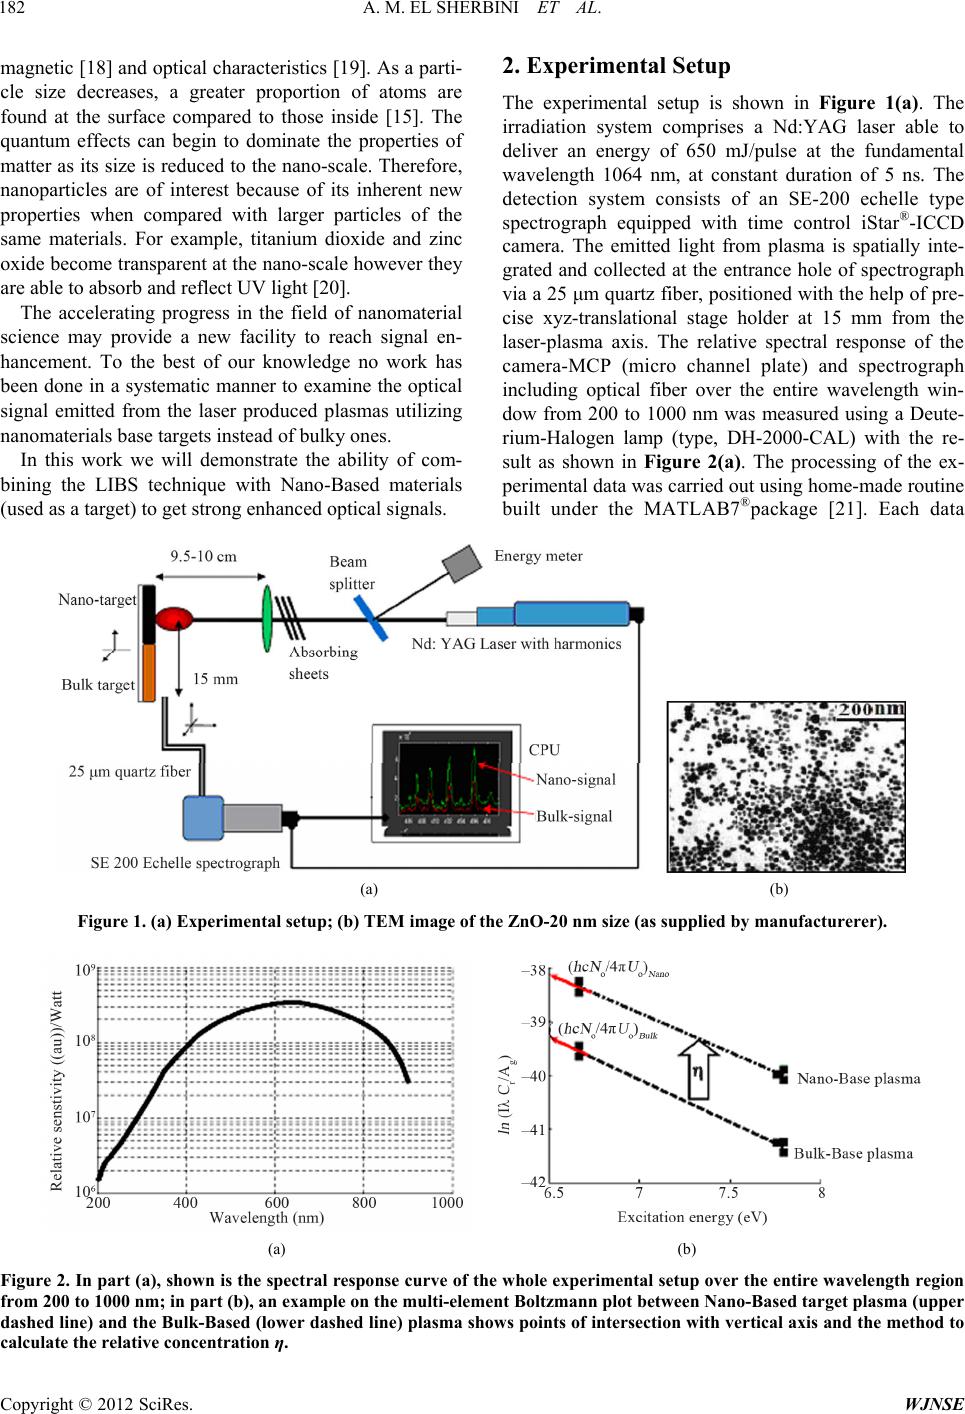 A. M. EL SHERBINI ET AL. 182 magnetic [18] and optical characteristics [19]. As a parti- cle size decreases, a greater proportion of atoms are found at the surface compared to those inside [15]. The quantum effects can begin to dominate the properties of matter as its size is reduced to the nano-scale. Therefore, nanoparticles are of interest because of its inherent new properties when compared with larger particles of the same materials. For example, titanium dioxide and zinc oxide become transparent at the nano-scale however they are able to absorb and reflect UV light [20]. The accelerating progress in the field of nanomaterial science may provide a new facility to reach signal en- hancement. To the best of our knowledge no work has been done in a systematic manner to examine the optical signal emitted from the laser produced plasmas utilizing nanomaterials base targets instead of bulky ones. In this work we will demonstrate the ability of com- bining the LIBS technique with Nano-Based materials (used as a target) to get strong enhanced optical signals. 2. Experimental Setup The experimental setup is shown in Figure 1(a). The irradiation system comprises a Nd:YAG laser able to deliver an energy of 650 mJ/pulse at the fundamental wavelength 1064 nm, at constant duration of 5 ns. The detection system consists of an SE-200 echelle type spectrograph equipped with time control iStar®-ICCD camera. The emitted light from plasma is spatially inte- grated and collected at the entrance hole of spectrograph via a 25 μm quartz fiber, positioned with the help of pre- cise xyz-translational stage holder at 15 mm from the laser-plasma axis. The relative spectral response of the camera-MCP (micro channel plate) and spectrograph including optical fiber over the entire wavelength win- dow from 200 to 1000 nm was measured using a Deute- rium-Halogen lamp (type, DH-2000-CAL) with the re- sult as shown in Figure 2(a). The processing of the ex- perimental data was carried out using home-made routine built under the MATLAB7®package [21]. Each data (a) (b) Figure 1. (a) Experimental setup; (b) TEM image of the ZnO-20 nm size (as supplied by manufacturerer). (a) (b) Figure 2. In part (a), shown is the spectral response curve of the whole experimental setup over the entire wavelength region from 200 to 1000 nm; in part (b), an example on the multi-element Boltzmann plot between Nano-Based target plasma (upper dashed line) and the Bulk-Based (lower dashed line) plasma shows points of intersection with vertical axis and the method to calculate the relative concentration η. Copyright © 2012 SciRes. WJNSE  A. M. EL SHERBINI ET AL. 183 point was taken as the average over three different single laser shots on fresh target condition which enable us to account for any fluctuations in measurements. A monitor to the incident laser power on the target was made via a beam splitter which reflects 4%, absorb 4% and with the help of absolutely calibrated power-meter (type Ophier). Unless specified, the ZnO (MKNANO-ZnO-020) material (as shown in Figure 1(b)) with almost spherical shaped powder samples was purchased from “MKNANO” and was used without further purification. The nano and bulk powder targets were compressed to a disk shape (Pressure ~ 5 ton/cm2), under the same am- bient conditions for a time period of 5 min. Both tables were positioned side by side perpendicular to laser axis on a xy-translational stage. It is worth noting that, no further chemical or heat treatment was carried out and to the best of our knowledge, both of the nano and bulk materials were synthesized using the same base material. 3. Plasma Parameters The plasma state can be described by two measurable parameters namely; the electron density and temperature [7,8]. At relatively large electron density ~ 1019 cm–3, the plasma state is said to be in complete thermodynamical equilibrium (CTE). In this situation the emitted light from the plasma displays a continuous spectrum and the plasma is characterized by single temperature. This con- dition is rarely verified in the laser induced plasma ex- periments [7]. In LIBS experiments, it was verified that the electron density is in the range from 1016 to 1018 cm–3 and the ra- diation field is dominated by a line rather than continu- ous spectrum. This state is called local thermodynamical equilibrium (LTE), at which the particle species are characterized by unique temperature which is different from the temperature of the radiation field. At a rather lower electron density regimes (1016 > ne > 109 cm–3), the electron gas in plasma tends to divide the energy levels of the atoms into two main categories. We call this state as partial local thermodynamic equilibrium (PLTE) [7,8]. 3.1. Measurement of Plasma Electron Density Spectroscopically, the electron number density can be measured by different methods namely; measurement of the optical refractivity of the plasma [7], calculation of the principal quantum number at the series limit [7,8], measurement of to stark profile of certain optically thin emitted spectral lines [22], the measurement of the abso- lute emission coefficient (spectral intensity) of spectral line [7] and finally from the measurement of the absolute emissivity of the continuum emission [8]. Among the different proposed methods, the Stark broadening of emitted lines has been the most widely used method [8]. This method is based on the assumption that the Stark effect is the dominant broadening over the Doppler broadening and the other pressure broadening mechanisms resulted from collisions with neutral atoms (i.e., resonance and Van der Waals broadenings) [22]. The theoretical calculation of Stark broadening parame- ters of hydrogenic lines is described in detail by Griem [8]. For the Hα-line, the following expression can be used to calculate the electron density [22]: 32 12 3 1/2 8.02 10cm s e H nH (1) In this expression 12 is the half width of the reduced Stark profiles in Å, it is a weak function of electron den- sity and temperature through the ion-ion correlation and Debye-shielding correction and the velocity dependence of the impact broadening. 3.2. Measurement of Plasma Temperature The second important plasma parameter is the electron temperature, which determines the strength of the differ- ent distribution functions [7]. In laser produced plasmas, a combination of the line and continuum spectra is ap- peared in the emission spectra. In this condition, the LTE is almost being fulfilled and one should employ the opti- cal emission spectroscopy technique to measure the tem- perature [7,8]. The most direct method to estimate the temperature is via measurement of the relative spectral intensity of two or more lines emerging from the same element and ioni- zation stage with small wavelength separation and large separation in upper state excitation energy. Moreover, these lines should be optically thin [7,8]. The following expression is recommended: 1112 22 112 2 lnln 4π o rr oe hcN ICI CE Ag AgUkT (2) In this expression, I, λ, A, g are the spectral intensity, wavelength, transition probability and statistical weight of the upper state respectively. The subscript numbers indicate different lines. N an d Uo are the population den- sity and the parathion function of the atom at temperature Te. The constants h and c are the Planck constant and speed of light, respectively. The lines intensities should be corrected by the relative response factors Cr1,2, at the different emitted wave- lengths; these factors are saved from the absolute calibra- tion curve, shown in Figure 2(a). Mathematically, the plot of the LHS of Equation (2) with excitation energy (RHS) yields a straight line of negative slope which de- termines the temperature. Copyright © 2012 SciRes. WJNSE  A. M. EL SHERBINI ET AL. 184 3.3. Measurement of Relative Concentration In order to measure the relative concentration of the zinc atoms in both plasmas created from the nanomaterial and the corresponding bulk material targets, we have devel- oped the following simple method. From Equation (2), the term 4π oo hcN U is a constant defined by the in- tersection of the backward extrapolation of the Boltz- mann line with the vertical axis. This method is not new, since it was suggested before [23,24] in what is called multi-element Saha-Boltzmann plot in which the relative concentration of the different matrix elements in the tar- get material can be estimated. After the construction of the two Boltzmann plots, one for the plasma emerging from the Nano-Based ZnO ma- terial target and the other for the plasma created from the Bulk-Based ZnO target, we should get two straight lines as shown in Figure 2(b). The upper line proves a higher concentration than the lower one. The two points of intersection with the verti- cal axis should give two similar quantities N ano 4π oo hcN Ufor the Nano-Based target and Bulk 4π oo hcN U for the Bulk-Based target. This means that, if the lower bulk line is multiplied by factor η we can make the two straight lines coincide (of course, with little orientation defined by the different temperatures of the two plasmas). This factor represents the relative concentration of the atoms (stoichiometry) in the plasmas created from the Nano vs. Bulk targets i.e. Nano Bulkoo N NN CC B . 4. Results and Discussion Figure 3(a) shows an example of one emitted optical signal at the Zn I-lines from the plasmas created from the Nano-Based target material (red colored) in comparison (a) (b) Figure 3. (a) Demonstration to emission enhancement at the Zn I-lines from the Nano-Based target (red color) in comparison to that from the Bulk-Based material (black color), showing the emission from the Zn I-lines as depicted in figure; (b) Dem- onstration to enhanced spectral radiance from the Zn I-lines at different wavelength regions from the Nano-Based target (red colored) in comparison to that from the Bulk-Based target at different three arbitrary delay times of 1, 3, 5 s, are shown in subsequent rows. Copyright © 2012 SciRes. WJNSE  A. M. EL SHERBINI ET AL. 185 o signals at the stame wavelengths arise from the corre- in contrast to the behavior of the spectral inten- si nce in the en- hancement factor at the different Zn I-lines (This will be hich causes this be- ha sponding Bulk-Based material target (black colored) at an arbitrary delay time of 4 μs. Qualitatively, one can notice the clear enhancement in the spectral intensity from the nano to bulk plasmas. Moreover, Figure 3(b) displays the same comparison between the two signals at the same wavelengths at regular delay times of 1, 3 and 5 μs, respectively, which demonstrates the temporal in- crease in the signal enhancement as the delay time in- creases. This is ty of the Hα-line. The reason for the decrease in the spectral intensity is not yet been resolved which grasps a need for more extensive investigations. Moreover, there is an obvious differe treated in a separate publication). An attempt to know the reason w vior can be achieved via careful examination of the different plasma parameters (electron density and tem- perature) in both plasmas. The electron density was measured utilizing the optically thin Hα-line appeared in both spectra under the same condition. Utilizing Equa- tion (1), in conjunction with special software routine written in MATLAB7®. This program was constructed to compare the spectral line shape of the measured Hα-line to the theoretically constructed Voigt profile [21] and hence to extract the Lorentzian component of the line FWHM used to calculate the electron density as shown in Figure 4 (first two columns). Figure 4. Demonstration of the H -line fitting and the measured electron densities at three different delay times of 1, 3, 5 s from the Nano-Based plasma target (black color) and the Bulk-Based plasma (blue color). The third column demonstrates the measurement of the plasma temperature at three delay times of 1, 3, 5 s from the Nano-Based plasma (upper red line) in comparison to Bulk-Based plasma (lower black line) in addition to method of calculation f the relative concentration Copyright © 2012 SciRes. WJNSE  A. M. EL SHERBINI ET AL. 186 An example of the fitting of the Hα-line at regular de- ay times of 1, 3, 5 μs to both plasmas arises from Nano- l Based target (first column with red curves) in compari- son to the second column in Figure 4, which shows the fitting of the Hα-line appeared in the spectra arises from the Bulk-Based plasma (blue curves) together with the estimated electron densities. On the other hand, in order to calculate the plasma electron temperature, we have constructed the Boltzmann pl ted fr both plasmas (fac- to olid squares) an ral intensity from the Zn I- Wavelength (n Transition Statistical weight Energy of upper ) ots utilizing the spectral lines intensities emitted by the Zn I-lines at 330.29, 334.55, 472.2, 481.01, 636.38 nm with the results as shown in Figure 4 (third column). The atomic parameters of the Zn I-lines used to con- struct the Boltzmann plot are presented in Table 1. Also, Figure 4 (third column) reveals that; first, the concentration of the zinc atoms in the plasma crea om the Nano-Based target is higher than the corre- sponding plasma arising from the Bulk-Based material and second, both plasmas show nearly similar tempera- tures at the different delay times, since both of the Boltzmann lines are almost parallel. Finally, in order to calculate the relative concentration (stoichiometry) of the neutral zinc in r η); we have utilized the predictions of set of Boltz- mann plots in Figure 4 in which the factor η was calcu- lated at each delay time. The overall result of the meas- urement of the average enhancement factor over the dif- ferent emission wavelengths from the neutral Zn I-lines at the wavelengths of 328.26, 330.29, 334.55, 468.06, 472.2, 481.01, 636.38 nm with delay time is shown in Figure 5, (red squares) whereas an obvious increase in an exponential manner to the signal enhancement from the nano vs. bulk based materials is shown. For a comparison reason, we have plotted both of the measured relative electron density (blue s d the relative electron temperature (black disks) as well as the measured relative concentration (inverted green triangles) with delays times in the range from 1 to 5 μs, respectively, in Figure 5. Figure 5 reveals the following conclusions, first, it ensures that the enhanced spect lines can’t be attributed to the plasma temperature dif- ference or the difference in the electron densities. Second, Table 1. The atomic parameters of the Zn I-lines. m) λ probability A ( s–1) g state E (eV 481.01 7.00 × 10⁷ 3 6.6674 472.2 4.58 × 10⁷ 3 6.6673 Figure 5. This figure represents the temporal variation of the relative parameters; spectral intensity (enhancement; red squares) and the relative concentration ( inverted green triangles) and the relative electron density ( eN eB nn temperature ; black disks) and finally, the relative electron ( eN eB TT blue squares) with de lay time . from this figure it is clear that the signal enhancement depends only on the relative atomic concentre plasma created from the Nano-Based material with re- spulk-Based plasma. Neverthe ation th ect to Bless, the relative oncentration (inverted green triangles) increases in a tting st ity is in the order of 10 cm c very combatable manner with signal enhancement. This fact can be qualitatively explained in terms of the collisional radiative modeling: The intense emission from the nanomaterial plasma with respect to the bulk one under the same experimental conditions can be related to the higher number of excited atoms to the upper emi ate (labeled j). This state can be populated via different atomic processes e.g. collisional excitation from all lower laying states, especially from the ground state and/or collisional de-excitation from the upper states, especially from the ground state of the next ionization stage and/or radiative decay from the upper excited states, especially recombination of both types (radiative or non-radiative three particle recombination). All the relevant processes can contribute by a certain amount depending on the predominant rate coefficients and the electron density present in the plasma, as well as the electron temperature [7]. In the laser produced plas- mas (LIBS), the electron dens17 –3, which means that the collisional processes are the dominant ones. For close approximation, the number of collisional processes from the ground state leading to population of the upper emitting state j per unit volume per unit time is in direct proportion to the spectral inten- sity of the emitted radiation. Hence the relative intensity from either plasma (Enhancement) should amount to; 330.29 1.07 × 10⁸ 5 7.7975 334.55 1.50 × 10⁸ 7 7.7980 636.38 4.65 × 10⁷ 5 7.7585 jNjN oN eNN jBjBoBeBB INNnR I NNnR (3) whereas, Ij, Nj, No are the spectral intensity of lines and Copyright © 2012 SciRes. WJNSE  A. M. EL SHERBINI ET AL. 187 the population density of this upper state and the popula- tion density of the ground state, respectively. R, ne are the electron-atom collision excitation rate coeffi electron density, respectively. The subscripts N, B ind ca cient and i- te nano and the corresponding bulk quantity. Equation (3) indicates that the relative spectral intensity would increase linearly with both of relative concentration oN oB NN and the relative electron density eN eB nnand the relative electron temperature through temperature dependant electron-atom collisional excita- tion rate coefficient [7]. Experimentally, the observed invariance of the relative electature, density and together with the relative enhancement compatible relative con- centration variation under different conditions leads to conclusion that the higher concentration of atoms in the N ron temper measured nO. This signal enhancem igation of the different plasma pa- uted to the larger concentration of the n, Washington DC, 2005). As well as the Col- ive a Spectroscopy,” Critical Reviews in Analytical Chemistry, Vol. 27, No. 4, 1997, pp. 257-290. doi:10.1080/10 ano-Based plasma is decisive in the observed en- hancement phenomenon. 5. Conclusion An enhanced emission optical signal from the Nano- Based material target was observed in comparison to Bulk-Based plasma from Zent, after a careful invest rameters, was attrib zinc atoms in the plasma created from the Nano-Based material with respect to that created from the Bulk-based one. Further investigation would be appreciated to ex- plore more the effects of the different laser wavelengths and laser fluence as well as the type of the material tar- get. 6. Acknowledgements and Dedication This work is financially supported in part by the Iraq Scholar Rescue Fund Project (Institute of International Educatio lage of Applied Medical Science, King Saud Un KSA at which the calculations and the written m rsity, terial were prepared. The authors address their gratitude to Prof’s. N. Omenetto, H.-J. Kunze, and A. El Dawyyan for their valuable discussions and guidance. This work is completely dedicated to the memory of souls of the Egyptian martyrs during our revolution on Jan. 25, 2011. REFERENCES [1] D. A. Rusak, B. C. Castle, B. W. Smith and J. D. Wine- fordner, “Fundamentals and Applications of Laser-Induced Breakdown 408349708050587 d H. Aranami, “Analysis[2] M. Kuzuya an of a High-Con- 30. -9 centration Copper in Metal Alloys by Emission Spec- troscopy of a Laser-Produced Plasma in Air at Atmos- pheric Pressure,” Spectrochimica Acta Part B: Atomic Spectroscopy, Vol. 55, No. 9, 2000, pp. 1423-14 doi:10.1016/S0584-8547(00)00246 and l Heritage, Vol. 4, [3] M. Jankowsk and G. Śliwiński, “Acoustic Monitoring for the Laser Cleaning of Sandstone,” Journal of Cultural Heritage, Vol. 4, No. 1, 2003, pp. 65-71. [4] M. Chappé, J. Hildenhagen, K. Dickmann and M. Bredol, “Laser Irradiation of Medieval Pigments at IR, VIS UV Wavelengths,” Journal of Cultura No. 1, 2003, pp. 264-270. doi:10.1016/S1296-2074(02)01206-2 [5] F. Hilbk-Kortenbruck, R. Noll, P. Wintjens, H. Falkb and l. 56, No. 6, 2001, pp. 933- 3-0 C. Becker, “Analysis of Heavy Metals in Soils Using La- ser-Induced Breakdown Spectrometry Combined with Laser-Induced Fluorescence,” Spectrochimica Acta Part B: Atomic Spectroscopy, Vo 945. doi:10.1016/S0584-8547(01)0021 [6] A. Jurado-López and M. D. Luque de Castro, “Laser- Induced Breakdown Spectrometry in Jewellery Industry, Part II: Quantitative Characterization of Gold-Filled In- terface,” Talanta, Vol. 59, No. 2, 2003, pp. 409-415. doi:10.1016/S0039-9140(02)00527-1 [7] H.-J. Kunze, “Introduction to Plasma Spectroscopy,” omic Spectroscopy, Vol. 005.06.007 Springer Series on Atomic, Optical and Plasma Physics, Vol. 56, Springer, Berlin, 2009. [8] H. R. Griem, “Plasma Spectroscopy,” McGrow-Hill, Inc., New York, 1964. [9] V. Lazic, F. Colao, R. Fantoni and V. Spizzicchino, “La- ser-Induced Breakdown Spectroscopy in Water: Improve- ment of the Detection Threshold by Signal Processing,” Spectrochimica Acta Part B: At 60, No. 7-8, 2005, pp. 1002-1013. doi:10.1016/j.sab.2 [10] D. Alamelu, A. Sarkar and S. K. Aggarwal, “Laser-Induced Breakdown Spectroscopy for Simultaneous Determina- tion of Sm, Eu and Gd in Aqueous Solution,” Talanta, Vol. 77, No. 1, 2008, pp. 256-261. doi:10.1016/j.talanta.2008.06.021 [11] V. I. Babushok, F. C. DeLucia Jr., J. L. Gottfried, C. A. 06, pp. 999-1014. Munson and A. W. Miziolek, “Double Pulse Laser Abla- tion and Plasma: Laser Induced Breakdown Spectroscopy Signal Enhancement,” Spectrochimica Acta Part B: Ato- mic Spectroscopy, Vol. 61, No. 9, 20 doi:10.1016/j.sab.2006.09.003 [12] C. Sánchez-Aké, M. Bolaños and C. Z. Ramírez, “Emis- sion Enhancement Using Two Orthogonal Targets in Double Pulse Laser-Induced Breakdown Spectroscopy,” Spectrochimica Acta Part B: Atomic Spectroscopy, Vol. 64, No. 9, 2009, pp. 857-862. doi:10.1016/j.sab.2009.07.001 [13] V. Piñon and D. Anglos, “Optical Emission Studies of Plasma Induced by Single and Double Femtosecond La- ser Pulses,” Spectrochimica Acta Part B: Atomic Spec- troscopy, Vol. 64, No. 10, 2009, pp. 950-960. doi:10.1016/j.sab.2009.07.036 [14] D. E. Roberts, A. du Plessis, J. Steyn, L. R. Botha, C. A. Strydom and I. J. van Rooyen, “Femtosecond Laser In- Copyright © 2012 SciRes. WJNSE  A. M. EL SHERBINI ET AL. Copyright © 2012 SciRes. WJNSE 188 ctroscopy 26. duced Breakdown Spectroscopy of Silver within Surro- gate High Temperature Gas Reactor Fuel Coated Parti- cles,” Spectrochimica Acta Part B: Atomic Spe Vol. 65, No. 11, 2010, pp. 918-9 , doi:10.1016/j.sab.2010.09.001 [15] C. P. Poole and F. J. Owens Jr., “Introduction to Nano- technology,” John Wiley & Sons, Inc., Hoboken, 2003. [16] J. Chen, Z. Xiu, V. L. Gregory and J. J. A. Pedro, “Effect of Natural Organic Matter on Toxicity and Reactivity of Nano-Scale Zero-Valent Iron,” Water Re No. 5, 2011, pp. 1995-2001. search, Vol. 45, doi:10.1016/j.watres.2010.11.036 [17] T. V. Shubina, D. S. Plotnikov, A. Vasson, J. Leymarie, M. Larsson, P. O. Holtzc, B. Monemarc, H. Lu, W. J. Schaffd and P. S. Kop’ev, “Surface-Plasmon Resonances in Indium Nitride with Metal-Enriched Nano-Particles,” Journal of Crystal Growth, V 230-235. ol. 288, No. 2, 2006, pp 05.12.003 . doi:10.1016/j.jcrysgro.20 [18] M. A. Suarez, T. Grosjean, D. Charraut and D. Courjon, “Nanoring as a Magnetic or Electric Field Sensitive Nano-Antenna for Near-Field Optics Applications,” Op- tics Communications, Vol. 270, No. 2, 2007, pp. 447-454. doi:10.1016/j.optcom.2006.09.020 [19] P. Adamson, “Optical Diagnostics of Nanoscale Dielec- tric Layers on Interference Films by Polarization-Depen- dent Differential Reflectivity,” Optics Communications, Vol. 268, No. 1, 2006, pp. 174-181. doi:10.1016/j.optcom.2006.07.004 [20] R. Yang, P. A. Christensen, T. A. Ege “Degradation Products Formed du rton and J. R. White, ring UV Exposure of Polyethylene ZnO Nano-Composites,” Polymer Degra- dation and Stability, Vol. 95, No. 9, 2010, pp. 1533-1541. doi:10.1016/j.polymdegradstab.2010.06.010 [21] A. M. EL Sherbini and A. S. AL Aamer, “Development of a Simple Software Program Used for Evaluation of Plasma Electron Density in LIBS Experiments via Spec- tral Line Shape Analysis,” Journal of Signal and Infor- mation Processing, Vol. 3, No. 4, 2012, pp. 502-515. [22] A. M. El Sherbini, H. Hegazy and Th. M. El Sherbini, “Measurement of Electron Density Utilizing the Hα-line from Laser Produced Plasma in Air,” Spectrochimica Acta Part B: Atomic Spectroscopy, Vol. 61, No. 5, 2006, pp. 532-539. doi:10.1016/j.sab.2006.03.014 [23] J. A. Aguilera and C. Aragón, “Multi-Element Saha- Boltzmann and Boltzmann Plots in Laser-Induced Plas- mas,” Spectrochimica Acta Part B: Atomic Spectroscopy, Vol. 62, No. 4, 2007, pp. 378-385. doi:10.1016/j.sab.2007.03.024 [24] J. A. Aguilera and C. Aragón, “Chara Induced Plasmas by Emission cterization of Laser- Spectroscopy with Curve- of-Growth Measurements. Part II: Effect of the Focusing Distance and the Pulse Energy,” Spectrochimica Acta Part B: Atomic Spectroscopy, Vol. 63, No. 7, 2008, pp. 793-799. doi:10.1016/j.sab.2008.04.013 |