 Advances in Applied Sociology 2012. Vol.2, No.4, 245-252 Published Online December 2012 in SciRes (http://www.SciRP.org/journal/aasoci) http://dx.doi.org/10.4236/aasoci.2012.24032 Copyright © 2012 SciRes. 245 Estimating the Size of the Methamphetamine-Using Population in New York City Using Network Sampling Techniques Kirk Dombrowski1*, Bilal Khan1, Travis Wendel1, Katherine McLean2, Evan Misshula2, Ric Curtis1 1Social Networks Research Group, John Jay College, CUNY, New York, USA 2CUNY Graduate Center, New York, USA Email: *kdombrowski@jjay.cuny.edu Received July 21st, 2012; revised August 24th, 2012; accepted September 10th, 2012 As part of a recent study of the dynamics of the retail market for methamphetamine use in New York City, we used network sampling methods to estimate the size of the total networked population. This process involved sampling from respondents’ list of co-use contacts, which in turn became the basis for cap- ture-recapture estimation. Recapture sampling was based on links to other respondents derived from demographic and “telefunken” matching procedures–the latter being an anonymized version of telephone number matching. This paper describes the matching process used to discover the links between the solic- ited contacts and project respondents, the capture-recapture calculation, the estimation of “false matches”, and the development of confidence intervals for the final population estimates. A final population of 12,229 was estimated, with a range of 8235 - 23,750. The techniques described here have the special vir- tue of deriving an estimate for a hidden population while retaining respondent anonymity and the ano- nymity of network alters, but likely require larger sample size than the 132 persons interviewed to attain acceptable confidence levels for the estimate. Keywords: Population Estimation; Network Methods; Methamphetamine; Anonymous Sampling Introduction Statistics such as the size of hard-to-enumerate populations are both important and difficult challenges for social science: important in that they represent one area where sociological results impact the allocation of public funds for both law en- forcement and public health resources (Aceijas et al., 2006, Dengenhardt & Hall, 2012), yet difficult because they often require estimation procedures that pit ideal methods against the difficulties of research implementation. Such questions lie at the heart of applied sociology. In particular, estimates of the size of hidden populations often hinge on data drawn from a single source, such as arrests or hospital admissions, whose relationship to overall population levels remains largely un- known, leaving both policy makers and researchers unsatisfied with results. Recent modeling work not withstanding (Simeone et al., 2003; Zhao, 2011; see Berchenko & Frost, 2011 for dis- cussion) this represents a less than ideal situation, a point aptly summed up in the titled of a recent article: “The numbers game: Let’s all guess the size of the illegal drug industry!” (Thoumi, 2005). As noted by Thoumi, such problems are particularly true for drug using populations, where limited data from disparate sources often indicates countervailing trends, yet population estimates and overall community dynamics continue to occupy important policy decisions. In these situations, research con- fronts hidden populations whose illegal behaviors invoke the need for anonymous sampling, further exacerbating an already difficult research scenario. New York City methamphetamine users represent such a population. Indeed, meth-users in NYC have received little attention until recently when concern about growing levels of methamphetamine use were associated HIV risk behaviors in the MSM (men who have sex with men)/gay community (Hirshfield et al., 2004; Morin et al., 2005). Methamphetamine has actually been available in New York City for decades (Drug Enforcement Administration (DEA) 2004, 2006, National Drug Intelligence Center (NDIC) 2008). Yet New York’s metham- phetamine markets have remained mostly inaccessible to re- searchers, and the small body of literature that is currently available on methamphetamine use in New York City focuses mainly on use among MSM while offering little information about market size, numbers of users, or distribution in general; nor about use outside of MSM communities, and what effect this has on the total number of users in the area. Local data such as these are important. While DAWN (2009: pp. 18-19) reports that the national estimate of methamphetamine-related emer- gency room visits in the US dropped from 132,576 in 2004 to 66,308 in 2008, and ADAM II (2009) data show significant declines in those testing positive for methamphetamine upon arrest, the NDIC (2008) notes that “the number of ampheta- mine-related (including methamphetamine-related) admissions to publicly funded treatment facilities in the New York/New Jersey Region increased 15 percent overall from 2002 (685) to 2006 (787)”. Network-Based Population Estimates Estimation techniques for hidden population sizes using so- cial network techniques have grown as sociological exposure to social network analysis has exploded over the last two decades. Among the most popular of these techniques is Respondent *Corresponding author.  K. DOMBROWSKI ET AL. Driven Sampling developed by sociologist Douglas Heckathorn (1997, 2002, 2007; see recent review of 128 RDS studies by Johnston et al., 2008). However, RDS does not present overall population sizes (rather, only population prevalences) and has recently received some criticism for its base estimation proce- dures (see Gile et al., 2012 for a summary of those criticisms). Handcock and Giles’ proposed replacement estimator (the “se- quential sampling” estimator, see Gile & Handcock, 2010) relies, however, on an estimate of the total size of the hidden population—and thus reintroduces a variable that the original RDS estimators had sought to escape. Given the adoption of RDS estimation by the World Health Organization (for esti- mating national rates of HIV and AIDS) and UNAIDS, and growing interest in using network techniques in determining overall size estimations of hidden populations, in this paper we propose a method of network-based capture-recapture popula- tion estimation that involves only a single sampling round (rather than the two rounds implied by standard capture-re- capture techniques) and which can be used to supplement RDS data collection or more conventional venue based ap- proaches. The method proposed below is capable of producing total population estimates which can be used with the Gile and Handcock estimator, or as a means for supplementing the original RDS estimator with a total population estimate for the group in question. And perhaps most importantly, it does so while maintaining respondent anonymity, a crucial considera- tion when dealing with drug using and other illegal or highly stigmatized behaviors. This factor, taken together with the fact that the recapture phase takes place simultaneous with the original capture phase of the sampling, and the easy fit of the technique with ordinary RDS methods, creates what we feel to be an important new tool for applied sociological research. To show an application of the technique in concrete terms, we demonstrate the development of an estimate for the population of methamphetamine users in New York City. This method contrasts with two other network-related at- tempts to estimate total population size: 1) network scale-up methods and 2) other capture-recapture methods using multiple RDS samples. In the words of a recent summary, network scale-up methods (or NSUM) “rests on the assumption that people’s social networks—the set of people whom you ‘know’ —are, on average, representative of the general population in which you live and move” (Bernard et al., 2010: p. ii12). In this procedure, individual estimates of sub-populations are “scaled” to aggregate levels, and the estimates of many individuals are combined. For example, if a respondent answers that he/she knows two pregnant women out of a total of 100 contacts, we could estimate the number of pregnant women in his/her county of 10,000 people (via consistent proportion) to be 200. By combining this estimate with the estimates drawn from many others, more accurate figures can be obtained. NSUM advo- cates see this as a means for estimating the size of sub-popula- tions that may be known but difficult to enumerate. Still, sig- nificant problems arise for NSUM methods when trying to estimate rates of participation in activities that individuals might try to keep secret even (or especially) from close associ- ates (see Salganik et al., 2011). Such a situation, obviously, could occur with any illegal or highly stigmatized activity, such as illegal drug use. A second popular method of estimation depends less on in- formation known to individuals and more on researchers ability to reach hidden populations repeatedly (by means, for example, such as successive waves of Respondent Driven Sampling). According to the logic of capture-recapture studies, successive samples that discover a proportion of identical individuals can be used to estimate the total population size by the well-known Lincoln-Peterson formula (discussed below). Multiple resam- pling increases the accuracy of these predictions. Where RDS has proven capable of reaching large samples of hidden popula- tions, it would appear ideally suited to such tasks. Problems arise, however, where initial sampling paths can be seen to affect subsequent referral paths, thus skewing the “recapture” process to those in the original sample (and resulting in an in- accurate recapture number, see Berchenko & Frost, 2011). Given these issues, what seems needed is a process that is less susceptible to discovery bias around stigmatized behaviors (a problem for NSUM) and not dependent on resampling proce- dures that may be biased by initial sampling (as is the issue for RDS-based capture-recapture methods), and finally, one that is capable of retaining respondent anonymity throughout the re- search process. Below we propose such a method. Estimating the Size of the NYC Methamphetamine Using Population In an attempt to estimate the size of the New York City methamphetamine using population, we have developed a net- work-based variant of standard capture-recapture methods that is capable of estimating the total size of a hidden, networked population from a network sample of current users, even while maintaining respondent anonymity. The proposed method re- quires sampling from each respondent’s network connections, and matching these connections against both the other respon- dents in the sample and the list of their respective contacts. Such methods are not particularly complex, and make use of capture/recapture methods with a long history in both social and biological sciences. In current circumstances, however, considerable modifications are required, as network sampling in the context of illicit and often socially stigmatized activity re- quires retaining anonymity of both research subjects and their network connections. These concerns necessarily complicate the matching of contacts assumed by the capture-recapture methods. For this reason, a naïve matching strategy of simply matching the names of respondents and contacts across inter- views is not possible. We address this challenge by a novel means of establishing network connections while maintaining the anonymity of participants and their contacts which we refer to as the “telefunken method”. This process requires the recruitment of a sample pool of network participants and the elicitation of a number of contacts from each. In addition to personal descriptives later used in the matching process, each participant was asked for his/her own “telefunken code”, derived from the last three digits of their own mobile phone number. To arrive at the code, each of the three digits is encoded as being either even or odd, and low or high (with 4.5 being the threshold). Together with height, ap- proximate weight, hair color, eye color, gender, and race/eth- nicity, this produced a six bit code for each respondent that served in matching the respondent to contacts reported by other Copyright © 2012 SciRes. 246  K. DOMBROWSKI ET AL. study respondents1. Importantly, the telefunken encoding en- sures (and assures) that actual telephone numbers of respon- dents remain unknown to researchers throughout the study. As will be seen below, a critical question raised by this method is the estimation of error scores (in the event of false matches between individuals who by coincidence have the same code) and error estimation of the resulting population estimate. We note that these questions would be greatly simplified by attain- ing a code for more phone number digits. In our case, however, pre-testing found that asking for more than 3 digits raised sus- picion among our research subjects and equally importantly, questions about the assurance of anonymity by our Institutional Review Board. Given these concerns, a method capable of producing and bounding an estimate within a range of confi- dence estimates seems particularly important. In the current study, respondents were recruited using Re- spondent Driven Sampling (RDS), an established research method for anonymously recruiting hard-to-reach populations (Heckathorn, 1997, 2002, 2007) such as the New York City methamphetamine user network. This process resulted in the recruitment of 132 eligible participants, starting from (n = 37) RDS “seeds” reached using a Craigslist advertisement. Addi- tional (n = 95) respondents were obtained by referrals via the standard RDS protocol. Respondent interviews included a number of use-related questions, and the appearance-based and demographic information. Further, in addition to their own personal information and telefunken code, each respondent was asked to select up to five methamphetamine-using contacts whose phone number they currently had in their mobile phone’s directory. This selection was carried out by choosing initial letters of last names from a randomized list of alphabet letters2. The respondent was then questioned about the randomly se- lected contacts, in order to obtain data on the contacts’ personal characteristics (approximate height, approximate weight, hair color, eye color, gender, and race/ethnicity) and telefunken code. For purposes of the population estimate, project respondents were treated as the “capture” population, while each of the contacts provided during the interviews (“reports”) was consid- ered a “recapture assay”. By finding the number of original respondents discovered via recapture assays (as a proportion of the total number of assays), researchers had a basis for esti- mateing the overall size of the population under consideration. Again, among the main contribution of the proposed method is that anonymity can be maintained throughout the process, with personal descriptions and telefunken codes together forming the sole means of identification and matching. Capture-recapture methods have been used extensively in es- timating population levels in biology and epidemiology, and more recently, employed in conjunction with methods designed to sample hidden populations of people (Bouchard, 2007; Hope et al., 2005; Paz-Bailey et al., 2011). At issue in these ap- proaches is not normally the validity of the standard Lin- coln-Peterson methodology or its appropriateness to the prob- lem, but rather the question of whether the original “capture” or subsequent “recapture” techniques are, in fact, sufficiently ran- dom (see Berchenko & Frost, 2011 for review and discussion). This issue is taken up in the discussion, below, but we note here that one difference between past studies and the method de- scribed here is that this method does not depend on data from outside the study (such as arrest numbers or hospital admissions) to determine either the capture or recapture statistic. Both are determined simultaneously during the sampling/recruitment process. Whether this results in an advantage or disadvantage over capture-recapture methods dependent on external data sources likely depends on context. Regardless, in this sense the proposed strategy represents a significant departure from other uses of capture-recapture in drug use and other research. The remainder of this paper details the steps involved in two separate attempts to estimate the methamphetamine using population in New York City3. As will be seen below, an esti- mate from the joint population was required due to the small sample size of the research population. Even with this second step, the range of estimates is still quite wide. One may con- clude from this fact that the current method leaves much to be desired. The “cup half full” interpretation, however, is that the current method is able to produce a statistically sound method for population estimation of a hidden population from a rela- tively small sample, and to do so while maintaining anonymity. It is this fact that, we feel, makes this method an important new tool in research on illegal activities where questions of ano- nymity and the protection of human subjects are paramount. Baseline Estimate The population estimate (P) entails a capture/recapture form of estimation using the respondents (n = 132) to define the capture population, and matches between the reports (s = 466) and the respondents to define the recaptured subset. Matches are defined by considering seven categorical variables: tele- funken code, gender, race, height, weight, hair color, and eye color. A respondent from the original sample was said to “match” a report if the two agreed on all seven of these vari- ables. With this definition, we found there were 11 matches between the 466 reports and the 132 respondents4. These 11 matches were used to define the recapture number (t = 11). Naïve extrapolation from this capture/recapture paradigm using the Lincoln-Peterson method yields: ns Pt (1) where P is the total estimated population, n is the size of the capture population, t is the recapture number, and s is the num- ber of recapture assays. Using 11 matches between 466 reports, and an initial sample of 132 respondents, yields a population estimate P = 5592. The sections that follow provide successive refinements to this figure. 3The choice of NYC was not arbitrary. We received a grant to do a popula- tion estimate of methamphetamine users in New York City (among other things) from the US National Institute of Justice, and so the necessary data was collected there. No similar data is available for a similar population in another city for comparative purposes, nor are other formal estimates for the size of the NYC meth using population available via other methods. This significantly limits the comparability of the results and the opportuni- ties for their verification by other means, though we hope this will be reme- died in the future. 4The details of the matching procedure, which utilized approximate match- ing of height, weight, and other continuous variables, is described in the appendix of the original project report (Wendel et al., 2011). 1For example, the telefunken code for any phone numbers which end in 123 (or 343, or 301) is odd-even-odd-low-low-low, while for phone numbers ending in 701 (or 523) the code is odd-even-odd-high-low-low. The name “telefunken” is borrowed from a Frank Zappa song (from the album oe’s Garage). It is intended to imply “funky telephone” code, as we felt like this was a good description of the coding method used here. 2Those respondents with five or fewer use-contacts in their mobile phone directory simply selected all of them without using the randomized alphabet page. Copyright © 2012 SciRes. 247  K. DOMBROWSKI ET AL. False Matches The matching technique maintains anonymity of both re- spondents and reports by considering general characteristics that are shared by entire segments of the ambient population of methamphetamine users, but the technique also introduces the possibility of “false matches” during the matching process. In particular, a false match occurs whenever a report “matches” a respondent based on agreement across all seven criteria, but when the report actually refers to someone outside of our sam- ple. Indeed, because false matches are possible, we have possi- bly over-estimated the recapture number (t = 11), and hence the P = 5592 estimate should be taken as a conservative lower es- timate of population size. To further refine the population estimate, it is necessary to consider the probability distribution governing the number of matches (amongst the 11 telefunken matches observed) that are likely to be “false”. Initial Estimation via Marginals To estimate the expected number of false matches E[F], we shall need to refer to the marginal sample distributions of each categorical variable involved in the matching process (see Ta- ble 1). We assume that the sample size is large enough so that its marginals approximate the population marginals. In addition, in this first attempt at refining the population estimate, we as- sume that the six categorical variables are independent. We begin by way of illustrative example. Consider a categorical vari- able V, say Gender. The possible values assumed by V are known: 12 3 Male, Female, Transgenderxx x and associated probabilities are computable from the marginals in Table 1: Prob(V = Male) = 119/132 Prob(V = Female) = 11/132 Prob(V = Transgender) = 2/132. Suppose we choose two individuals at random from an infi- nite population satisfying the above marginal distribution for the Gender variable. Since 119 of the 132 respondents were male, the probability that both individuals in this pair will be male is (119/132)2, or 0.81 (i.e. about 81% of the time). Simi- larly, the probability of the two individuals both being female is (11/132)2 = 0.007, or about 0.7% of the time. Finally, the probability of the individuals both being transgender is (2/132)2 = 0.0002, a mere 0.02% of the time. The total probability of a match across the Gender variable is then given by: 222 1191321113221320.82. Repeating this same calculation we can determine the prob- ability of agreement between the two individuals for each of the other variables (race, gender, hair color, eye color, height and weight). The results are shown in Table 2. Now, assuming independent sequential assignment of categorical variables, the probability that two randomly chosen individuals will match on all six descriptive categorical variables is the product of the individual probabilities listed in Table 2: 3 .3805 0.8198 0.32570.70720.2320 0.22363.7210 Since each telefunken code is 6 bits, there are 26 = 64 distinct codes, and thus, the probability that two individuals will match by sheer chance, is given by: Table 1. Sample distributions by attribute values. Attribute (k) Category (n=) Race (5) Black/African American (71) Hispanic (26) White (30) Asian (3) Other (2) Gender (3)Male (119) Female (11) Trans (2) Hair (5) Black (65) Brown (21) Blonde (3) Grey/Salt and Pepper (10) Other (30) Eye (2) Brown/Dark (109) Blue/Green/Light (21) Height (5) Below 5’4” (8) 5’4”-5’8” (36) 5’7”-5’11” (45) 5’10”-6’2” (24) Over 6’1” (9) Weight (5)Below 125-145 (15) 135-165 (41) 155-185 (36) 175-205 (23) Over 195 (13) Table 2. Probability of agreement between randomly selected sample members by attributes. AttributeSum of the Squares of the Marginals Probability of Agreement Race 0.2893 + 0.0388 + 0.0517 + 0.0005 + 0.0002 0.3805 Gender 0.8127 + 0.0069 + 0.0002 0.8198 Hair Color0.2425 + 0.0253 + 0.0005 + 0.0057 + 0.0517 0.3257 Eye Color0.6819 + 0.0253 0.7072 Height 0.0037 + 0.0744 + 0.1162 + 0.0331 + 0.0046 0.2320 Weight 0.0129 + 0.0964 + 0.0743 + 0.0303 + 0.0097 0.2236 35 3.72 101645.8110 . For any specific respondent then, the expected the number of reports (drawn from a population represented accurately by the sample itself) that would telefunken match by sheer chance is: 52 4665.81102.71 10 . The expected total number of false matches over all (n = 132) respondents can now be estimated using linearity of expecta- tion: 2 '1322.71 103.58.F The number F' = 3.58 provides an initial estimate of E[F] ≈ F' which takes into account the marginal distributions of the population from which the sample is drawn (to the extent that the marginals of the population conform to those of the sample). Adjusting the recapture number t' = t − F' to incorporate these findings yields t' = 11 − 3.58 = 7.42 and the revised population estimate P' = 8290. Better Estimate via the Joint The previous estimate of false matches provided a first at- tempt at correcting for the fact that the number of matches gen- erally exceeds the true recapture set. Nonetheless, there are some shortcomings to the false match estimation procedure described above. In particular, the procedure outlined above Copyright © 2012 SciRes. 248 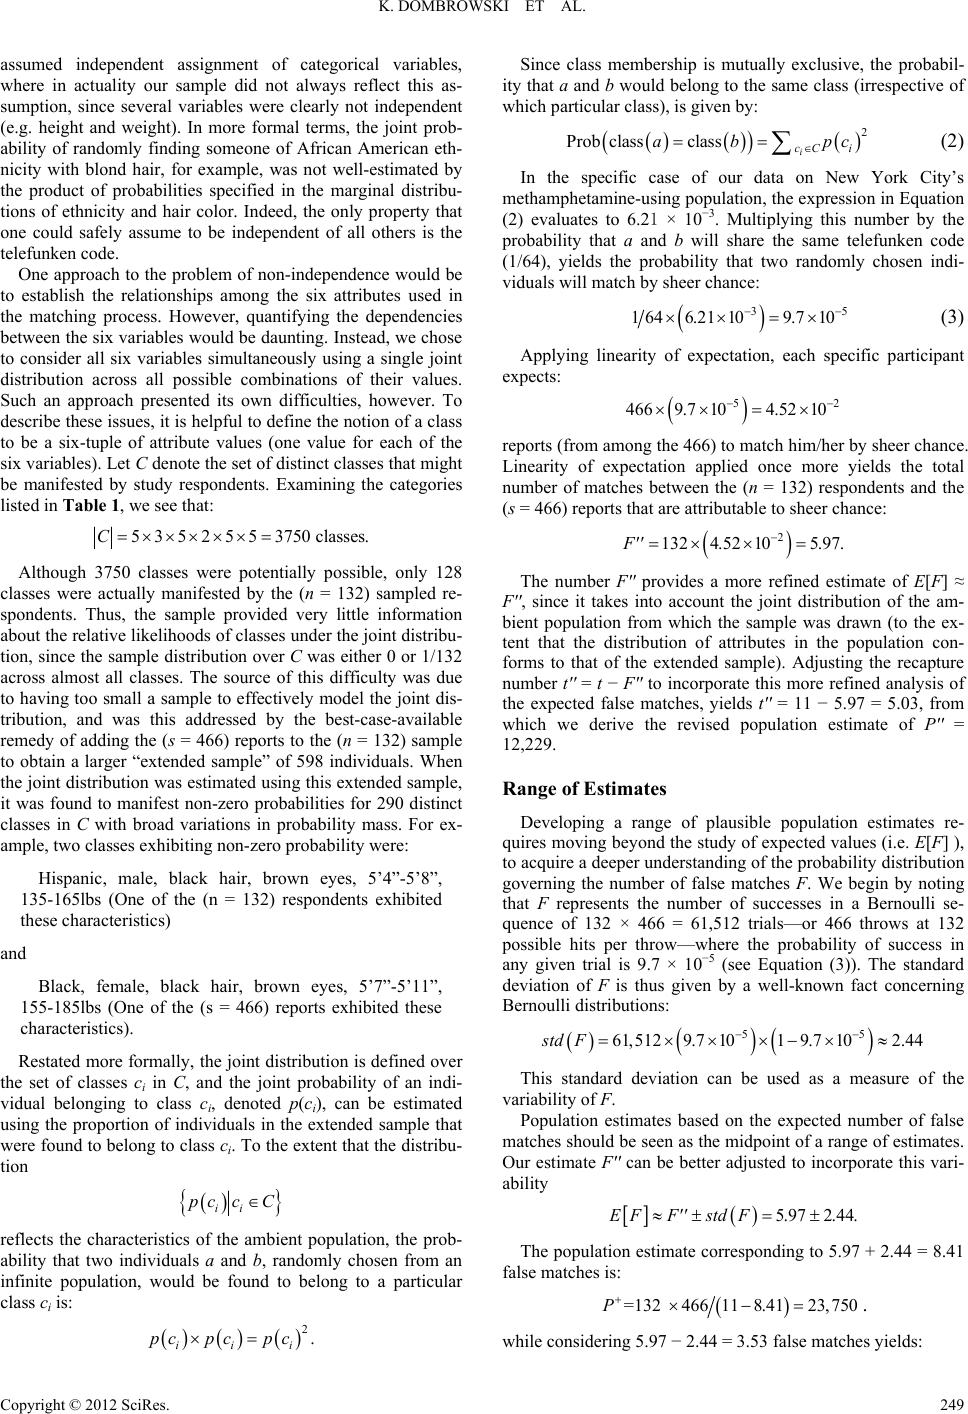 K. DOMBROWSKI ET AL. assumed independent assignment of categorical variables, where in actuality our sample did not always reflect this as- sumption, since several variables were clearly not independent (e.g. height and weight). In more formal terms, the joint prob- ability of randomly finding someone of African American eth- nicity with blond hair, for example, was not well-estimated by the product of probabilities specified in the marginal distribu- tions of ethnicity and hair color. Indeed, the only property that one could safely assume to be independent of all others is the telefunken code. One approach to the problem of non-independence would be to establish the relationships among the six attributes used in the matching process. However, quantifying the dependencies between the six variables would be daunting. Instead, we chose to consider all six variables simultaneously using a single joint distribution across all possible combinations of their values. Such an approach presented its own difficulties, however. To describe these issues, it is helpful to define the notion of a class to be a six-tuple of attribute values (one value for each of the six variables). Let C denote the set of distinct classes that might be manifested by study respondents. Examining the categories listed in Table 1, we see that: 5352553750 classes.C Although 3750 classes were potentially possible, only 128 classes were actually manifested by the (n = 132) sampled re- spondents. Thus, the sample provided very little information about the relative likelihoods of classes under the joint distribu- tion, since the sample distribution over C was either 0 or 1/132 across almost all classes. The source of this difficulty was due to having too small a sample to effectively model the joint dis- tribution, and was this addressed by the best-case-available remedy of adding the (s = 466) reports to the (n = 132) sample to obtain a larger “extended sample” of 598 individuals. When the joint distribution was estimated using this extended sample, it was found to manifest non-zero probabilities for 290 distinct classes in C with broad variations in probability mass. For ex- ample, two classes exhibiting non-zero probability were: Hispanic, male, black hair, brown eyes, 5’4”-5’8”, 135-165lbs (One of the (n = 132) respondents exhibited these characteristics) and Black, female, black hair, brown eyes, 5’7”-5’11”, 155-185lbs (One of the (s = 466) reports exhibited these characteristics). Restated more formally, the joint distribution is defined over the set of classes ci in C, and the joint probability of an indi- vidual belonging to class ci, denoted p(ci), can be estimated using the proportion of individuals in the extended sample that were found to belong to class ci. To the extent that the distribu- tion ii pc cC reflects the characteristics of the ambient population, the prob- ability that two individuals a and b, randomly chosen from an infinite population, would be found to belong to a particular class ci is: 2. ii i pc pcpc Since class membership is mutually exclusive, the probabil- ity that a and b would belong to the same class (irrespective of which particular class), is given by: 2 Prob classclassi cC i ab p c (2) In the specific case of our data on New York City’s methamphetamine-using population, the expression in Equation (2) evaluates to 6.21 × 10⁻³. Multiplying this number by the probability that a and b will share the same telefunken code (1/64), yields the probability that two randomly chosen indi- viduals will match by sheer chance: 3 1 646.21109.710 5 (3) Applying linearity of expectation, each specific participant expects: 52 4669.7 104.5210 reports (from among the 466) to match him/her by sheer chance. Linearity of expectation applied once more yields the total number of matches between the (n = 132) respondents and the (s = 466) reports that are attributable to sheer chance: 2 1324.52105.97.F The number F′′ provides a more refined estimate of E[F] ≈ F′′, since it takes into account the joint distribution of the am- bient population from which the sample was drawn (to the ex- tent that the distribution of attributes in the population con- forms to that of the extended sample). Adjusting the recapture number t′′ = t − F′′ to incorporate this more refined analysis of the expected false matches, yields t′′ = 11 − 5.97 = 5.03, from which we derive the revised population estimate of P′′ = 12,229. Range of Estimates Developing a range of plausible population estimates re- quires moving beyond the study of expected values (i.e. E[F] ), to acquire a deeper understanding of the probability distribution governing the number of false matches F. We begin by noting that F represents the number of successes in a Bernoulli se- quence of 132 × 466 = 61,512 trials—or 466 throws at 132 possible hits per throw—where the probability of success in any given trial is 9.7 × 10⁻⁵ (see Equation (3)). The standard deviation of F is thus given by a well-known fact concerning Bernoulli distributions: 55 61,5129.7 1019.7 102.44std F This standard deviation can be used as a measure of the variability of F. Population estimates based on the expected number of false matches should be seen as the midpoint of a range of estimates. Our estimate F′′ can be better adjusted to incorporate this vari- ability 5.97 2.44.EF FstdF The population estimate corresponding to 5.97 + 2.44 = 8.41 false matches is: =132 466118.4123,750P. while considering 5.97 − 2.44 = 3.53 false matches yields: Copyright © 2012 SciRes. 249 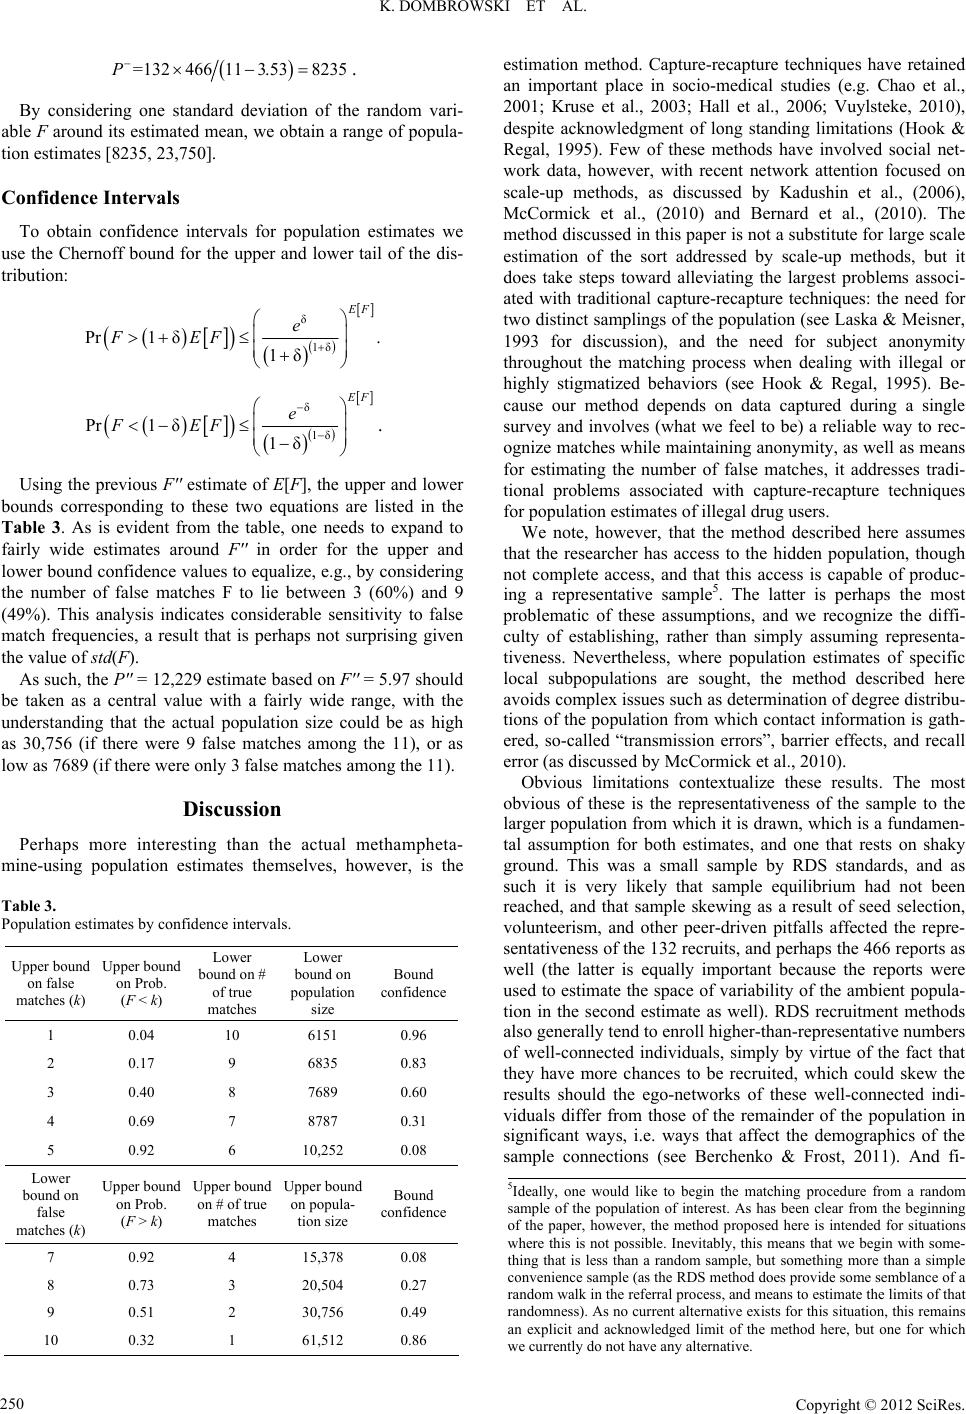 K. DOMBROWSKI ET AL. =132466 113.538235P. By considering one standard deviation of the random vari- able F around its estimated mean, we obtain a range of popula- tion estimates [8235, 23,750]. Confidence Intervals To obtain confidence intervals for population estimates we use the Chernoff bound for the upper and lower tail of the dis- tribution: δ 1δ Pr1 δ 1δ . F e FEF δ 1δ Pr1 δ 1δ F e FEF . Using the previous F′′ estimate of E[F], the upper and lower bounds corresponding to these two equations are listed in the Table 3. As is evident from the table, one needs to expand to fairly wide estimates around F′′ in order for the upper and lower bound confidence values to equalize, e.g., by considering the number of false matches F to lie between 3 (60%) and 9 (49%). This analysis indicates considerable sensitivity to false match frequencies, a result that is perhaps not surprising given the value of std(F). As such, the P′′ = 12,229 estimate based on F′′ = 5.97 should be taken as a central value with a fairly wide range, with the understanding that the actual population size could be as high as 30,756 (if there were 9 false matches among the 11), or as low as 7689 (if there were only 3 false matches among the 11). Discussion Perhaps more interesting than the actual methampheta- mine-using population estimates themselves, however, is the Table 3. Population estimates by confidence intervals. Upper bound on false matches (k) Upper bound on Prob. (F < k) Lower bound on # of true matches Lower bound on population size Bound confiden ce 1 0.04 10 6151 0.96 2 0.17 9 6835 0.83 3 0.40 8 7689 0.60 4 0.69 7 8787 0.31 5 0.92 6 10,252 0.08 Lower bound on false matches (k) Upper bound on Prob. (F > k) Upper bound on # of true matches Upper bound on popula- tion size Bound confiden ce 7 0.92 4 15,378 0.08 8 0.73 3 20,504 0.27 9 0.51 2 30,756 0.49 10 0.32 1 61,512 0.86 estimation method. Capture-recapture techniques have retained an important place in socio-medical studies (e.g. Chao et al., 2001; Kruse et al., 2003; Hall et al., 2006; Vuylsteke, 2010), despite acknowledgment of long standing limitations (Hook & Regal, 1995). Few of these methods have involved social net- work data, however, with recent network attention focused on scale-up methods, as discussed by Kadushin et al., (2006), McCormick et al., (2010) and Bernard et al., (2010). The method discussed in this paper is not a substitute for large scale estimation of the sort addressed by scale-up methods, but it does take steps toward alleviating the largest problems associ- ated with traditional capture-recapture techniques: the need for two distinct samplings of the population (see Laska & Meisner, 1993 for discussion), and the need for subject anonymity throughout the matching process when dealing with illegal or highly stigmatized behaviors (see Hook & Regal, 1995). Be- cause our method depends on data captured during a single survey and involves (what we feel to be) a reliable way to rec- ognize matches while maintaining anonymity, as well as means for estimating the number of false matches, it addresses tradi- tional problems associated with capture-recapture techniques for population estimates of illegal drug users. We note, however, that the method described here assumes that the researcher has access to the hidden population, though not complete access, and that this access is capable of produc- ing a representative sample5. The latter is perhaps the most problematic of these assumptions, and we recognize the diffi- culty of establishing, rather than simply assuming representa- tiveness. Nevertheless, where population estimates of specific local subpopulations are sought, the method described here avoids complex issues such as determination of degree distribu- tions of the population from which contact information is gath- ered, so-called “transmission errors”, barrier effects, and recall error (as discussed by McCormick et al., 2010). Obvious limitations contextualize these results. The most obvious of these is the representativeness of the sample to the larger population from which it is drawn, which is a fundamen- tal assumption for both estimates, and one that rests on shaky ground. This was a small sample by RDS standards, and as such it is very likely that sample equilibrium had not been reached, and that sample skewing as a result of seed selection, volunteerism, and other peer-driven pitfalls affected the repre- sentativeness of the 132 recruits, and perhaps the 466 reports as well (the latter is equally important because the reports were used to estimate the space of variability of the ambient popula- tion in the second estimate as well). RDS recruitment methods also generally tend to enroll higher-than-representative numbers of well-connected individuals, simply by virtue of the fact that they have more chances to be recruited, which could skew the results should the ego-networks of these well-connected indi- viduals differ from those of the remainder of the population in significant ways, i.e. ways that affect the demographics of the sample connections (see Berchenko & Frost, 2011). And fi- 5Ideally, one would like to begin the matching procedure from a random sample of the population of interest. As has been clear from the beginning of the paper, however, the method proposed here is intended for situations where this is not possible. Inevitably, this means that we begin with some- thing that is less than a random sample, but something more than a simple convenience sample (as the RDS method does provide some semblance of a random walk in the referral process, and means to estimate the limits of that randomness). As no current alternative exists for this situation, this remains an explicit and acknowledged limit of the method here, but one for which we currently do not have any alternative. Copyright © 2012 SciRes. 250 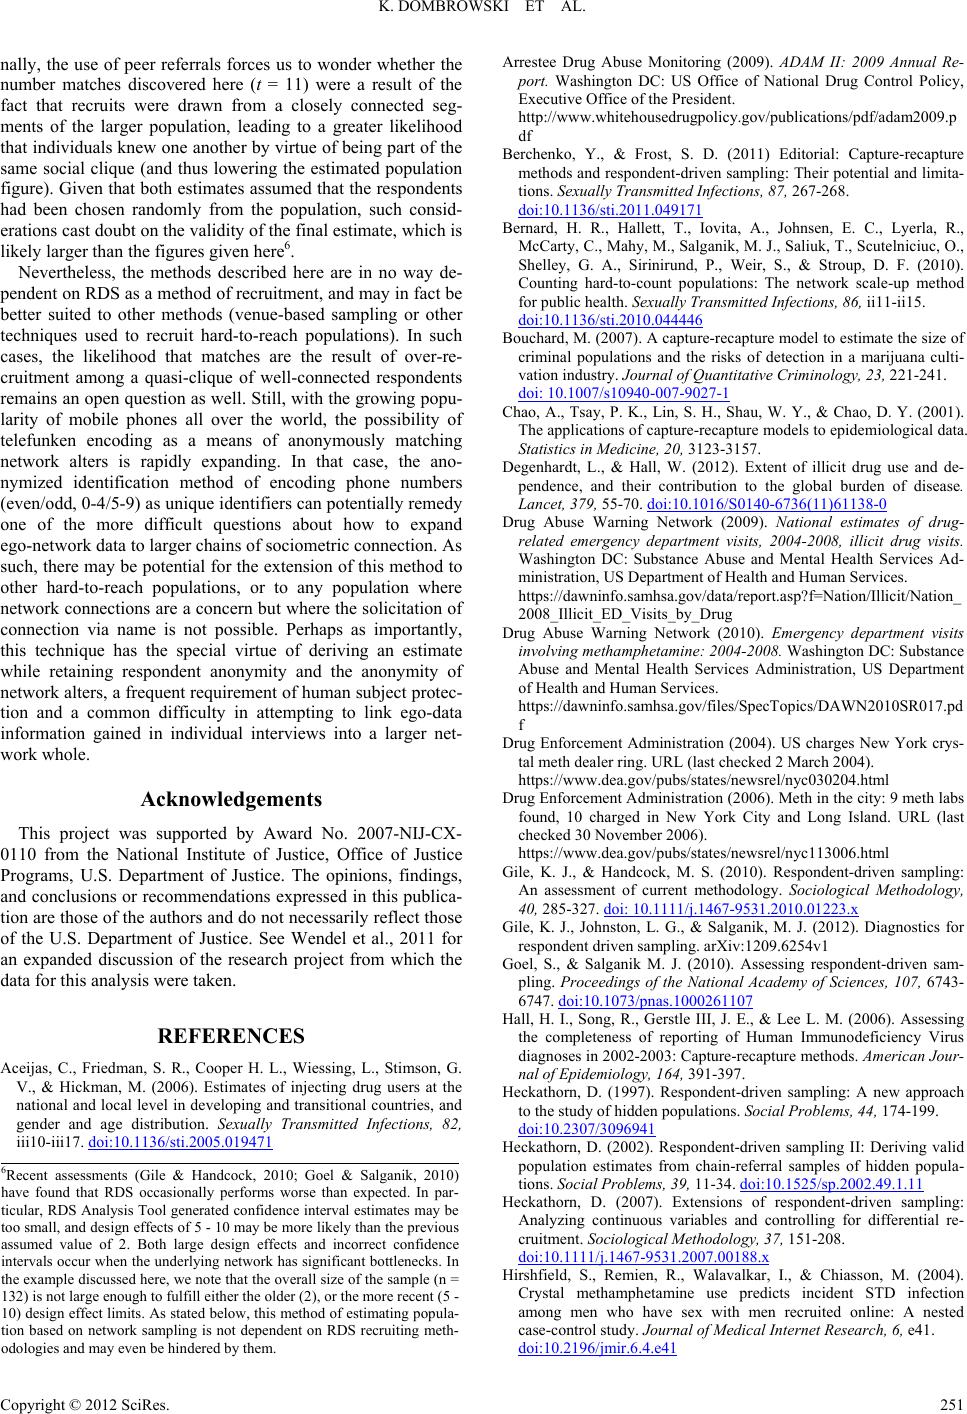 K. DOMBROWSKI ET AL. nally, the use of peer referrals forces us to wonder whether the number matches discovered here (t = 11) were a result of the fact that recruits were drawn from a closely connected seg- ments of the larger population, leading to a greater likelihood that individuals knew one another by virtue of being part of the same social clique (and thus lowering the estimated population figure). Given that both estimates assumed that the respondents had been chosen randomly from the population, such consid- erations cast doubt on the validity of the final estimate, which is likely larger than the figures given here6. Nevertheless, the methods described here are in no way de- pendent on RDS as a method of recruitment, and may in fact be better suited to other methods (venue-based sampling or other techniques used to recruit hard-to-reach populations). In such cases, the likelihood that matches are the result of over-re- cruitment among a quasi-clique of well-connected respondents remains an open question as well. Still, with the growing popu- larity of mobile phones all over the world, the possibility of telefunken encoding as a means of anonymously matching network alters is rapidly expanding. In that case, the ano- nymized identification method of encoding phone numbers (even/odd, 0-4/5-9) as unique identifiers can potentially remedy one of the more difficult questions about how to expand ego-network data to larger chains of sociometric connection. As such, there may be potential for the extension of this method to other hard-to-reach populations, or to any population where network connections are a concern but where the solicitation of connection via name is not possible. Perhaps as importantly, this technique has the special virtue of deriving an estimate while retaining respondent anonymity and the anonymity of network alters, a frequent requirement of human subject protec- tion and a common difficulty in attempting to link ego-data information gained in individual interviews into a larger net- work whole. Acknowledgements This project was supported by Award No. 2007-NIJ-CX- 0110 from the National Institute of Justice, Office of Justice Programs, U.S. Department of Justice. The opinions, findings, and conclusions or recommendations expressed in this publica- tion are those of the authors and do not necessarily reflect those of the U.S. Department of Justice. See Wendel et al., 2011 for an expanded discussion of the research project from which the data for this analysis were taken. REFERENCES Aceijas, C., Friedman, S. R., Cooper H. L., Wiessing, L., Stimson, G. V., & Hickman, M. (2006). Estimates of injecting drug users at the national and local level in developing and transitional countries, and gender and age distribution. Sexually Transmitted Infections, 82, iii10-iii17. doi:10.1136/sti.2005.019471 Arrestee Drug Abuse Monitoring (2009). ADAM II: 2009 Annual Re- port. Washington DC: US Office of National Drug Control Policy, Executive Office of the President. http://www.whitehousedrugpolicy.gov/publications/pdf/adam2009.p df Berchenko, Y., & Frost, S. D. (2011) Editorial: Capture-recapture methods and respondent-driven sampling: Their potential and limita- tions. Sexually Transmitted Infections, 87, 267-268. doi:10.1136/sti.2011.049171 Bernard, H. R., Hallett, T., Iovita, A., Johnsen, E. C., Lyerla, R., McCarty, C., Mahy, M., Salganik, M. J., Saliuk, T., Scutelniciuc, O., Shelley, G. A., Sirinirund, P., Weir, S., & Stroup, D. F. (2010). Counting hard-to-count populations: The network scale-up method for public health. Sexually Transmitted Infections, 86, ii11-ii15. doi:10.1136/sti.2010.044446 Bouchard, M. (2007). A capture-recapture model to estimate the size of criminal populations and the risks of detection in a marijuana culti- vation industry. Journal of Quantitative Criminology, 23, 221-241. doi: 10.1007/s10940-007-9027-1 Chao, A., Tsay, P. K., Lin, S. H., Shau, W. Y., & Chao, D. Y. (2001). The applications of capture-recapture models to epidemiological data. Statistics in Medicine, 20, 3123-3157. Degenhardt, L., & Hall, W. (2012). Extent of illicit drug use and de- pendence, and their contribution to the global burden of disease. Lancet, 379, 55-70. doi:10.1016/S0140-6736(11)61138-0 Drug Abuse Warning Network (2009). National estimates of drug- related emergency department visits, 2004-2008, illicit drug visits. Washington DC: Substance Abuse and Mental Health Services Ad- ministration, US Department of Health and Human Services. https://dawninfo.samhsa.gov/data/report.asp?f=Nation/Illicit/Nation_ 2008_Illicit_ED_Visits_by_Drug Drug Abuse Warning Network (2010). Emergency department visits involving methamphetamine: 2004-2008. Washington DC: Substance Abuse and Mental Health Services Administration, US Department of Health and Human Services. https://dawninfo.samhsa.gov/files/SpecTopics/DAWN2010SR017.pd f Drug Enforcement Administration (2004). US charges New York crys- tal meth dealer ring. URL (last checked 2 March 2004). https://www.dea.gov/pubs/states/newsrel/nyc030204.html Drug Enforcement Administration (2006). Meth in the city: 9 meth labs found, 10 charged in New York City and Long Island. URL (last checked 30 November 2006). https://www.dea.gov/pubs/states/newsrel/nyc113006.html Gile, K. J., & Handcock, M. S. (2010). Respondent-driven sampling: An assessment of current methodology. Sociological Methodology, 40, 285-327. doi: 10.1111/j.1467-9531.2010.01223.x Gile, K. J., Johnston, L. G., & Salganik, M. J. (2012). Diagnostics for respondent driven sampling. arXiv:1209.6254v1 Goel, S., & Salganik M. J. (2010). Assessing respondent-driven sam- pling. Proceedings of the National Academy of Sciences, 107, 6743- 6747. doi:10.1073/pnas.1000261107 Hall, H. I., Song, R., Gerstle III, J. E., & Lee L. M. (2006). Assessing the completeness of reporting of Human Immunodeficiency Virus diagnoses in 2002-2003: Capture-recapture methods. American Jour- nal of Epidemiology, 164, 391-397. Heckathorn, D. (1997). Respondent-driven sampling: A new approach to the study of hidden populations. Social Problems, 44, 174-199. doi:10.2307/3096941 Heckathorn, D. (2002). Respondent-driven sampling II: Deriving valid population estimates from chain-referral samples of hidden popula- tions. Social Problems, 39, 11-34. doi:10.1525/sp.2002.49.1.11 6Recent assessments (Gile & Handcock, 2010; Goel & Salganik, 2010) have found that RDS occasionally performs worse than expected. In par- ticular, RDS Analysis Tool generated confidence interval estimates may be too small, and design effects of 5 - 10 may be more likely than the previous assumed value of 2. Both large design effects and incorrect confidence intervals occur when the underlying network has significant bottlenecks. In the example discussed here, we note that the overall size of the sample (n = 132) is not large enough to fulfill either the older (2), or the more recent (5 - 10) design effect limits. As stated below, this method of estimating popula- tion based on network sampling is not dependent on RDS recruiting meth- odologies and may even be hindered by them. Heckathorn, D. (2007). Extensions of respondent-driven sampling: Analyzing continuous variables and controlling for differential re- cruitment. Sociological Methodology, 37, 151-208. doi:10.1111/j.1467-9531.2007.00188.x Hirshfield, S., Remien, R., Walavalkar, I., & Chiasson, M. (2004). Crystal methamphetamine use predicts incident STD infection among men who have sex with men recruited online: A nested case-control study. Journal of Medical Internet Research, 6, e41. doi:10.2196/jmir.6.4.e41 Copyright © 2012 SciRes. 251  K. DOMBROWSKI ET AL. Copyright © 2012 SciRes. 252 Hope, V., Hickman, M., & Tilling, K. (2005). Capturing crack cocaine use: Estimating the prevalence of crack cocaine use in London using capture-recapture with covariates. Addiction, 100, 1701-1708. doi: 10.1111/j.1360-0443.2005.01244.x Hook, E. B., & Regal, R. R. (1995). Capture-recapture methods in epidemiology: Methods and limitations. Epidemiology Review, 17, 243-264. Johnston, L. G., Malekinejad, M., Kendall, C., Iuppa, I. M., & Ruther- ford, G. W. (2008). Implementation challenges to using respondent- driven sampling methodology for HIV biological and behavioral surveillance: Field experiences in international settings. AIDS and Behavior, 12, 131-141. Kadushin, C., Killworth, P. D., Bernard, H. R., & Beveridge, A. A. (2006). Scale-up methods as applied to estimates of heroin use. Journal of Drug Issues, 36, 417-440. doi:10.1177/002204260603600209 Kruse, N., Behets, F., Vaovola, G., Burkhardt, G., Barivelo, T., Amida, X., & Dallabetta, G. (2003). Participatory mapping of sex trade and enumeration of sex workers using capture-recapture methodology in Diego-Suarez, Madagascar. Sexually Transmitted Diseases, 30, 664- 670. Laska, E. M., & Meisner, M. A. (1993). A plant-capture method for estimating the size of a population from a single sample. Biometrics, 49, 209-220. http://www.jstor.org/stable/2532614 Maxwell, J., & Rutkowski, B. (2008). The prevalence of metham- phetamine and amphetamine abuse in North America: A review of the indicators, 1992-2007. Drug and Alcohol Review, 27, 229-235. McCormick, T. H., Salganik, M. J., & Zheng, T. (2010). How many people do you know? Efficiently estimating personal network size. Journal of the American Statistical Association, 105, 59-70. doi:10.1198/jasa.2009.ap08518 Morin, S., Steward, W., Charlebois, E., Remien, R., Pinkerton, S., Johnson, M., Rotheram-Borus, M., Lightfoot, M., Goldstein, R., Kit- tel, L., Samimy-Muzaffar, F., Weinhardt, L., Kelly, J., & Chesney, M., (2005). Predicting HIV transmission risk among HIV-infected men who have sex with men: Findings from the healthy living pro- ject. Journal of Acquired Immune Deficiency Syndromes, 40, 226- 235. National Drug Intelligence Center (2008). Methamphetamine Threat Assessment 2009. Washington DC: US Department of Justice. Paz-Bailey, G., Jacobson, J. O., Guardado, M. E., Hernandez, F. M., Nieto, A. I., Estrada, M., & Creswell, J. (2011). How many men who have sex with men and female sex workers live in El Salvador? Us- ing respondent-driven sampling and capture-recapture to estimate population sizes. Sexually Transmitted Infections, 87, 279-282. Salganik, M. J., Fazito, D., Bertoni, N., Abdo, A. H., Mello, M. B., & Bastos, F. I. (2011). Assessing network scale-up estimates for groups most at risk of HIV/AIDS: Evidence from a multiple-method study of heavy drug users in Curitiba, Brazil. American Journal of Epide- miology, 174, 1190-1196. doi: 10.1093/aje/kwr246 Schoeneberger, M., Leukefeld, C., Hiller, M., & Godlaski, T. (2006). Substance abuse among rural and very rural drug users at treatment entry. American Journal of Drug and Alcohol Abuse, 32, 87-110. Simeone, R., Holland, L., & Viveros-Aquilero, R. (2003). Estimating the size of an illicit-drug-using population. Statistics in Medicine, 22, 2969-2993. doi: 10.1002/sim.1528 Thoumi, T. (2005). The numbers game: Let’s all guess the size of the illegal drug industry! Journal of Drug Issues, 35, 185-200. doi:10.1177/002204260503500109 Vuylsteke, B., Vandenhoudt, H., Langat, L., le Semde, G., Menten, J., Odongo, F., Anapapa, A., Sika, L., Buve, A., & Laga, M. (2010). Capture-recapture for estimating the size of the female sex worker population in three cities in Cote d’Ivoire and in Kisumu, western Kenya. Tropical Medicine and International Health, 15, 1537-1543. Wendel, T., Khan, B., Dombrowski, K., Curtis, R., McLean, K., Mis- shula, E., Riggs, R., & Marshall IV, D. M. (2011). Dynamics of retail methamphetamine markets in New York City. Final report to the Na- tional Institute of Justice, office of justice programs. Washington DC: US Department of Justice. Zhao, Y. (2011). Estimating the size of an injecting drug user popula- tion. World Journal of AIDS, 1, 88-93. doi:10.4236/wja.2011.13013
|