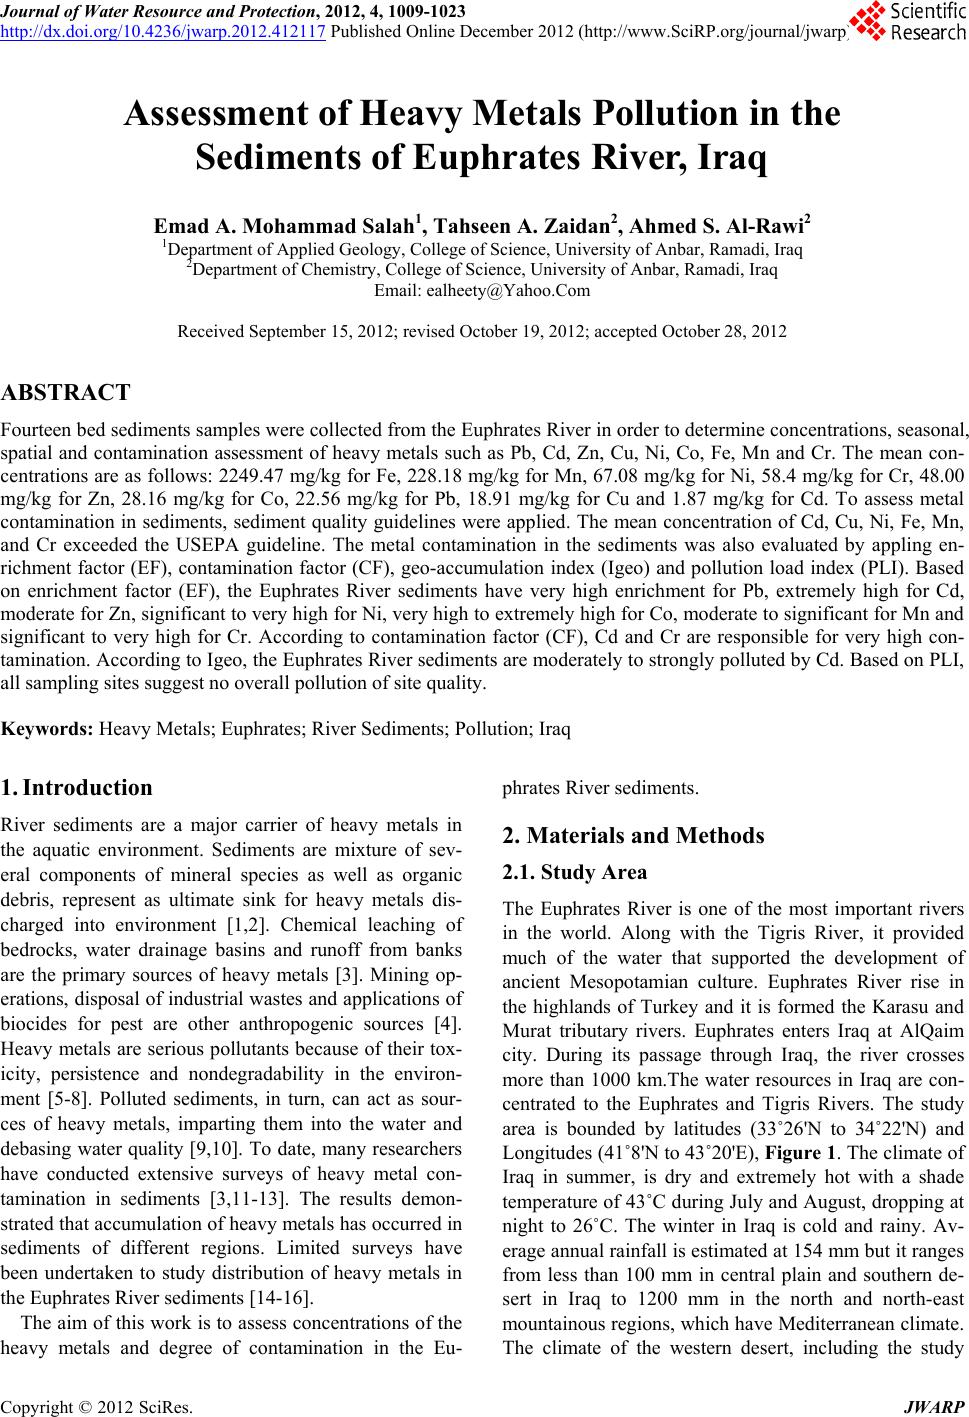
 Journal of Water Resource and Protection, 2012, 4, 1009-1023 http://dx.doi.org/10.4236/jwarp.2012.412117 Published Online December 2012 (http://www.SciRP.org/journal/jwarp) Assessment of Heavy Metals Pollution in the Sediments of Euphrates River, Iraq Emad A. Mohammad Salah1, Tahseen A. Zaidan2, Ahmed S. Al-Rawi2 1Department of Applied Geology, College of Science, University of Anbar, Ramadi, Iraq 2Department of Chemistry, College of Science, University of Anbar, Ramadi, Iraq Email: ealheety@Yahoo.Com Received September 15, 2012; revised October 19, 2012; accepted October 28, 2012 ABSTRACT Fourteen bed sediments samples were collected from the Euphrates River in order to determine concentrations, seasonal, spatial and contamination assessment of heavy metals such as Pb, Cd, Zn, Cu, Ni, Co, Fe, Mn and Cr. The mean con- centrations are as follows: 2249.47 mg/kg for Fe, 228.18 mg/kg for Mn, 67.08 mg/kg for Ni, 58.4 mg/kg for Cr, 48.00 mg/kg for Zn, 28.16 mg/kg for Co, 22.56 mg/kg for Pb, 18.91 mg/kg for Cu and 1.87 mg/kg for Cd. To assess metal contamination in sediments, sediment quality guidelines were applied. The mean concentration of Cd, Cu, Ni, Fe, Mn, and Cr exceeded the USEPA guideline. The metal contamination in the sediments was also evaluated by appling en- richment factor (EF), contamination factor (CF), geo-accumulation index (Igeo) and pollution load index (PLI). Based on enrichment factor (EF), the Euphrates River sediments have very high enrichment for Pb, extremely high for Cd, moderate for Zn, significant to very high for Ni, very high to extremely high for Co, moderate to significant for Mn and significant to very high for Cr. According to contamination factor (CF), Cd and Cr are responsible for very high con- tamination. According to Igeo, the Euphrates River sediments are moderately to strongly polluted by Cd. Based on PLI, all sampling sites suggest no overall pollution of site quality. Keywords: Heavy Metals; Euphrates; River Sediments; Pollution; Iraq 1. Introduction River sediments are a major carrier of heavy metals in the aquatic environment. Sediments are mixture of sev- eral components of mineral species as well as organic debris, represent as ultimate sink for heavy metals dis- charged into environment [1,2]. Chemical leaching of bedrocks, water drainage basins and runoff from banks are the primary sources of heavy metals [3]. Mining op- erations, disposal of industrial wastes and applications of biocides for pest are other anthropogenic sources [4]. Heavy metals are serious pollutants because of their tox- icity, persistence and nondegradability in the environ- ment [5-8]. Polluted sediments, in turn, can act as sour- ces of heavy metals, imparting them into the water and debasing water quality [9,10]. To date, many researchers have conducted extensive surveys of heavy metal con- tamination in sediments [3,11-13]. The results demon- strated that accumulation of heavy metals has occurred in sediments of different regions. Limited surveys have been undertaken to study distribution of heavy metals in the Euphrates River sediments [14-16]. The aim of this work is to assess concentrations of the heavy metals and degree of contamination in the Eu- phrates River sediments. 2. Materials and Methods 2.1. Study Area The Euphrates River is one of the most important rivers in the world. Along with the Tigris River, it provided much of the water that supported the development of ancient Mesopotamian culture. Euphrates River rise in the highlands of Turkey and it is formed the Karasu and Murat tributary rivers. Euphrates enters Iraq at AlQaim city. During its passage through Iraq, the river crosses more than 1000 km.The water resources in Iraq are con- centrated to the Euphrates and Tigris Rivers. The study area is bounded by latitudes (33˚26'N to 34˚22'N) and Longitudes (41˚8'N to 43˚20'E), Figure 1. The climate of Iraq in summer, is dry and extremely hot with a shade temperature of 43˚C during July and August, dropping at night to 26˚C. The winter in Iraq is cold and rainy. Av- erage annual rainfall is estimated at 154 mm but it ranges from less than 100 mm in central plain and southern de- sert in Iraq to 1200 mm in the north and north-east mountainous regions, which have Mediterranean climate. The climate of the western desert, including the study C opyright © 2012 SciRes. JWARP 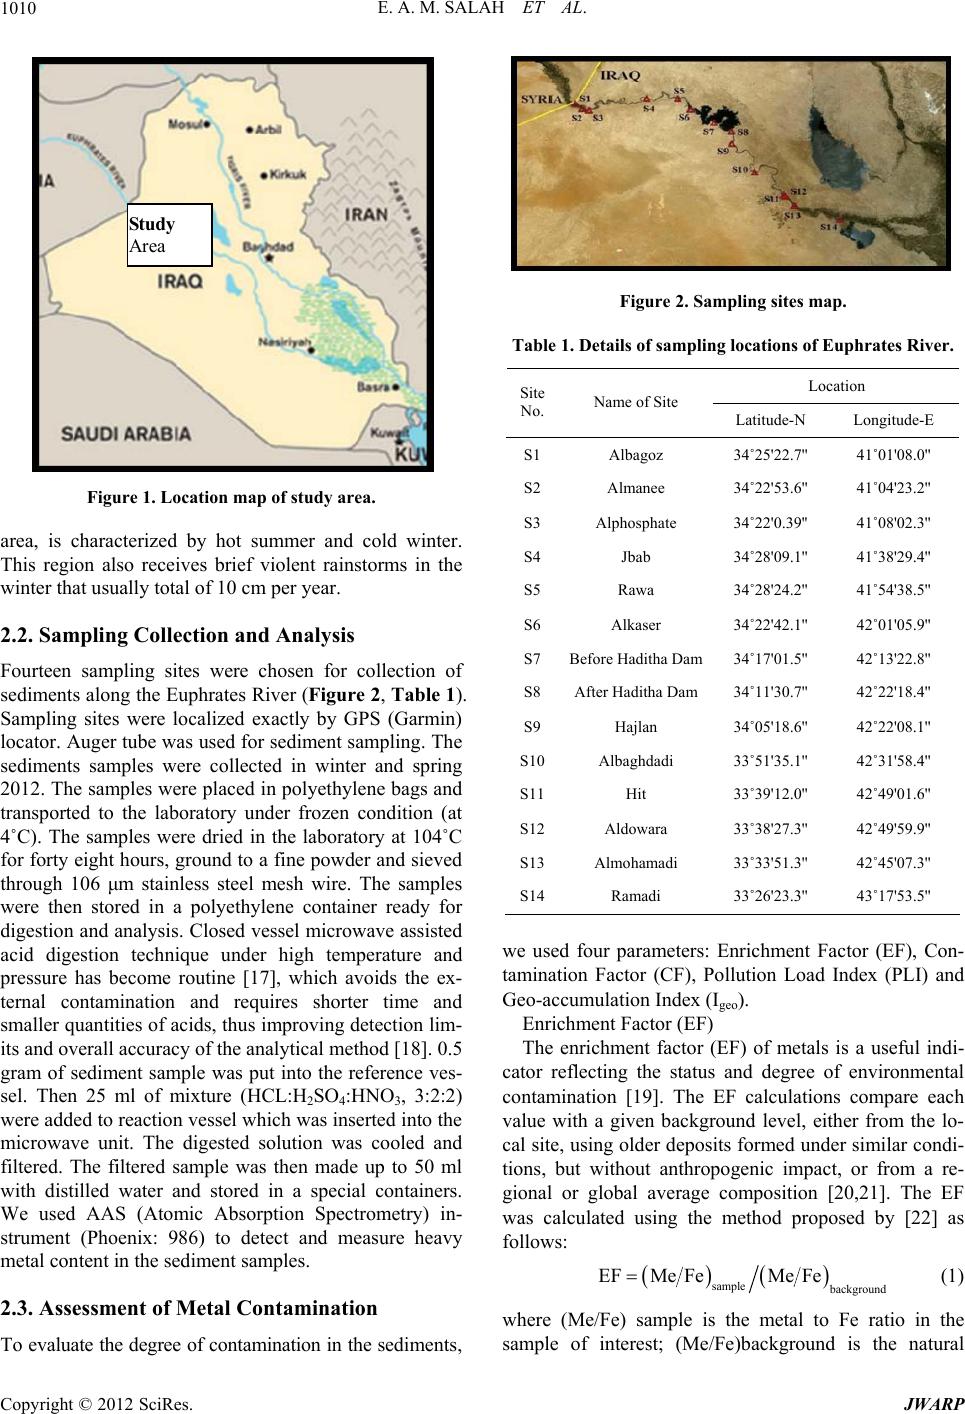 E. A. M. SALAH ET AL. 1010 Study Area Figure 1. Location map of study area. area, is characterized by hot summer and cold winter. This region also receives brief violent rainstorms in the winter that usually total of 10 cm per year. 2.2. Sampling Collection and Analysis Fourteen sampling sites were chosen for collection of sediments along the Euphrates River (Figure 2, Table 1). Sampling sites were localized exactly by GPS (Garmin) locator. Auger tube was used for sediment sampling. The sediments samples were collected in winter and spring 2012. The samples were placed in polyethylene bags and transported to the laboratory under frozen condition (at 4˚C). The samples were dried in the laboratory at 104˚C for forty eight hours, ground to a fine powder and sieved through 106 μm stainless steel mesh wire. The samples were then stored in a polyethylene container ready for digestion and analysis. Closed vessel microwave assisted acid digestion technique under high temperature and pressure has become routine [17], which avoids the ex- ternal contamination and requires shorter time and smaller quantities of acids, thus improving detection lim- its and overall accuracy of the analytical method [18]. 0.5 gram of sediment sample was put into the reference ves- sel. Then 25 ml of mixture (HCL:H2SO4:HNO3, 3:2:2) were added to reaction vessel which was inserted into the microwave unit. The digested solution was cooled and filtered. The filtered sample was then made up to 50 ml with distilled water and stored in a special containers. We used AAS (Atomic Absorption Spectrometry) in- strument (Phoenix: 986) to detect and measure heavy metal content in the sediment samples. 2.3. Assessment of Metal Contamination To evaluate the degree of contamination in the sediments, Figure 2. Sampling sites map. Table 1. Details of sampling locations of Euphrates River. Location Site No. Name of Site Latitude-N Longitude-E S1 Albagoz 34˚25'22.7'' 41˚01'08.0'' S2 Almanee 34˚22'53.6'' 41˚04'23.2'' S3 Alphosphate 34˚22'0.39'' 41˚08'02.3'' S4 Jbab 34˚28'09.1'' 41˚38'29.4'' S5 Rawa 34˚28'24.2'' 41˚54'38.5'' S6 Alkaser 34˚22'42.1'' 42˚01'05.9'' S7 Before Haditha Dam34˚17'01.5'' 42˚13'22.8'' S8 After Haditha Dam 34˚11'30.7'' 42˚22'18.4'' S9 Hajlan 34˚05'18.6'' 42˚22'08.1'' S10Albaghdadi 33˚51'35.1'' 42˚31'58.4'' S11Hit 33˚39'12.0'' 42˚49'01.6'' S12Aldowara 33˚38'27.3'' 42˚49'59.9'' S13Almohamadi 33˚33'51.3'' 42˚45'07.3'' S14Ramadi 33˚26'23.3'' 43˚17'53.5'' we used four parameters: Enrichment Factor (EF), Con- tamination Factor (CF), Pollution Load Index (PLI) and Geo-accumulation Index (Igeo). Enrichment Factor (EF) The enrichment factor (EF) of metals is a useful indi- cator reflecting the status and degree of environmental contamination [19]. The EF calculations compare each value with a given background level, either from the lo- cal site, using older deposits formed under similar condi- tions, but without anthropogenic impact, or from a re- gional or global average composition [20,21]. The EF was calculated using the method proposed by [22] as follows: (1) sample ackground EFMe FeMe Fe where (Me/Fe) sample is the metal to Fe ratio in the sample of interest; (Me/Fe)background is the natural Copyright © 2012 SciRes. JWARP  E. A. M. SALAH ET AL. 1011 background value of metal to Fe ratio. As we do not have metal background values for our study area, we used the values from surface world rocks [23]. Iron was chosen as the element of normalization because natural sources (1.5%) vastly dominate its input [24]. Enrichment factor categories are listed in Table 2. Contamination Factor (CF) The level of contamination of sediment by metal is expressed in terms of a contamination factor (CF) calcu- lated as: mm CFCSampleCBackground (2) where, Cm Sample is the concentration of a given metal in river sediment, and Cm Background is value of the metal equals to the world surface rock average given by [23]. CF values for describing the contamination level are shown in Table 3. Pollution Load Index (PLI) Pollution load index (PLI), for a particular site, has been evaluated following the method proposed by [25]. This parameter is expressed as: 1n 3 n F CF 12 PLICF CFC (3) where, n is the number of metals. Geo-accumulation Index (Igeo) Enrichment of metal concentration above baseline concentrations was calculated using the method proposed by [26], termed the geo-accumulation index (Igeo). Geo- accumulation index is expressed as follows: geo2 mm ILogC Sample1.5CB ackground (4) where Cm Sample is the measured concentration of ele- ment n in the sediment sample and Bm Background is the geochemical background value (world surface rock av- erage given by [23]). The factor 1.5 is introduced to in- clude possible variation of the background values due to lithogenic effect. Muller [27] proposed seven grades or classes of the geo-accumulation index. These classes are given in Table 4. The overall total geo-accumulation index (Itot) is defined as the sum of Igeo for all trace ele- ments obtain from the site [28]. The number of toxic elements determined in a sediment sample and their re- spective Igeo value would influence the Itot. Table 2. Enrichment factor (EF) categories ( Mmolawa et al. 2011). Enrichment factor (EF) Enrichment factor (EF) Categories EF < 2 Deficiency to minimal enrichment 2 ≤ EF < 5 Moderate enrichment 5 ≤ EF < 20 Significant enrichment 20 ≤ EF < 40 Very high enrichment EF ≥ 40 Extremely high enrichment Table 3. Contamination factor (CF) and level of contamina- tion (Hakanson, 1980). Contamination Factor (CF) Contamination Level CF < 1 Low contamination 1 ≤ CF < 3 Moderate contamination 3 ≤ CF < 6 Considerable contamination CF > 6 Very high contamination Table 4. Muller’s classification for geo-accumulation index (Igeo). Igeo ValueClass Sediment Quality ≤0 0 Unpolluted 0 - 1 1 From unpolluted to moderately polluted 1 - 2 2 Moderately polluted 2 - 3 3 From moderately to strongly polluted 3 - 4 4 Strongly polluted 4 - 5 5 From strongly to extremely polluted >6 6 Extremely 3. Results and Discussion The descriptive statistics of the data set pertaining to the Euphrates River sediments, geochemical background concentration and sediment quality guidelines are pre- sented in Table 5. Intermetallic correlation, seasonal and spatial variations were delineated in Table 6 and shown in Figures 3 and 4. Results of this study were compared with the other previous local and global studies, Table 7. The enrichment factor (EF) is a convenient measure of geochemical trends and is used for making comparisons between areas [22]. The EF values of heavy metals in the Euphrates River sediments were listed and Table 8 and shown in Figure 5. The contamination factor (CF) was used to determine the contamination status of sediments of Euphrates River. The calculated CF for various heavy metals in sediments of Euphrates River is presented in Table 9 and shown in Figure 6. The PLI provides simple but comparative means for assessing a site quality, where a value of PLI < 1 denotes perfection; PLI = 1 presents that only baseline levels of pollutants are presented and PLI > 1 would indicate dete- rioration of site quality [25]. The PLI values for heavy metals in the Euphrates River sediments are listed in Ta- ble 10 and shown in Figure 7. The geo-accumulation index (Igeo) was used to determine the pollution level of sediments. The calculated Igeo values, based on the world surface rock average, are presented in Copyright © 2012 SciRes. JWARP  E. A. M. SALAH ET AL. Copyright © 2012 SciRes. JWARP 1012 Table 5. Concentration of heavy metals in the sediments samples of Euphrates river during the study period. Geochemical Background Metal Minimum Maximum Mean Standard deviation World1 surface rock average Mean shale concentration2 WHO3 SQG* USEPA4 SQG* CCME5 SQG* Pb 8.02 32.69 22.56 7.37 16 20 - 40 35 Cd 0.87 2.35 1.87 0.45 0.2 0.3 6 0.6 0.6 Zn 14.96 130.25 48.00 31.25 127 95 123 110 123 Cu 10.35 30.52 18.91 5.59 32 11.2 25 16 35.7 Ni 39.98 103.98 67.08 19.36 49 68 20 16 - Co 21.88 38.73 28.16 4.91 13 29 - - - Fe 928.7 3441.05 2249.47 571.18 35900 46700 - 30 - Mn 136.05 312.11 228.18 56.13 750 850 - 30 - Cr 36.45 120.11 58.40 21.73 71 90 25 25 37.3 Values are in milligram per Kilogram (mg/kg); 1Martin and Meybeck [23]; 2Venkatesha Raju [3]; 3WHO [32]; 4USEPA [33]; 5CCME [17]; *Sediment quality guidelines. Table 6. Pearson’s correlation coefficient of heavy metals in Euphrates River sediments. Metal Pb Cd Zn Cu Ni Co Fe Mn Cr Pb 1.000 Cd 0.436 1.000 Zn 0.515 0.374 1.000 Cu 0.519 0.598 0.758 1.000 Ni 0.380 0.487 0.387 0.683 1.000 Co 0.472 0.032 0.577 0.234 0.053 1.000 Fe 0.610 0.522 0.595 0.617 0.318 0.084 1.000 Mn 0.047 0.699 –0.086 0.401 0.342 –0.485 0.208 1.00 Cr 0.441 0.580 0.808 0.574 0.421 0.668 0.451 –0.035 1.00 Marked correlations are significant at p < 0.05. Table 11 and the variations are shown in F igure 8. The concentration of Pb varied from 8.02 to 32.69 mg/kg, and mean value was 22.56 mg/kg. It was more than the world surface rock average and the shale con- centration as a background level. In comparison with sediment quality guideline, the mean value did not ex- ceed the limits, and this result shows that the Euphrates River sediments are not polluted by Pb. Pb expressed a strong positive correlation with Fe at 0.05 level. The strong correlation indicates that the two elements have common sources. In general, Pb concentrations in sedi- ments were high during the spring than winter (Figure 3(a)). Pb concentration varies between 8.02 mg/kg at S6 and 32.69 mg/kg at S1, Figure 4(a). High values of Pb concentration at S7, S8 (Haditha Dam), S12 (Heet city) and S14 (Ramadi city) as well as S1 (AlQaim city) might be due to increased human activity since these are town- ship areas. Pb concentration was in a good agreement to that reported in study of [14] for the upper region of Eu- phrates River (same study area) and study of [29] for the Euphrates River profile in Iraq (Table 7). It was less than that recorded by [15] for two stations in Heet and Ramadi cities. It was also less than the world rivers av- erage [23]. The EF values for Pb in Euphrates River sediments were ranged from 9.35 to 35.97. The EF values for Pb were found to be greater than 20 in most of sampling sites (Table 8), suggesting that these sites are classified as very high enrichment for Pb. Rabee et al. [15] found that the EF values for Pb in two stations in Heet and Ramadi cities are 5.4 and 6.20, respectively. They classi- fied these stations as significant enrichment for Pb. The 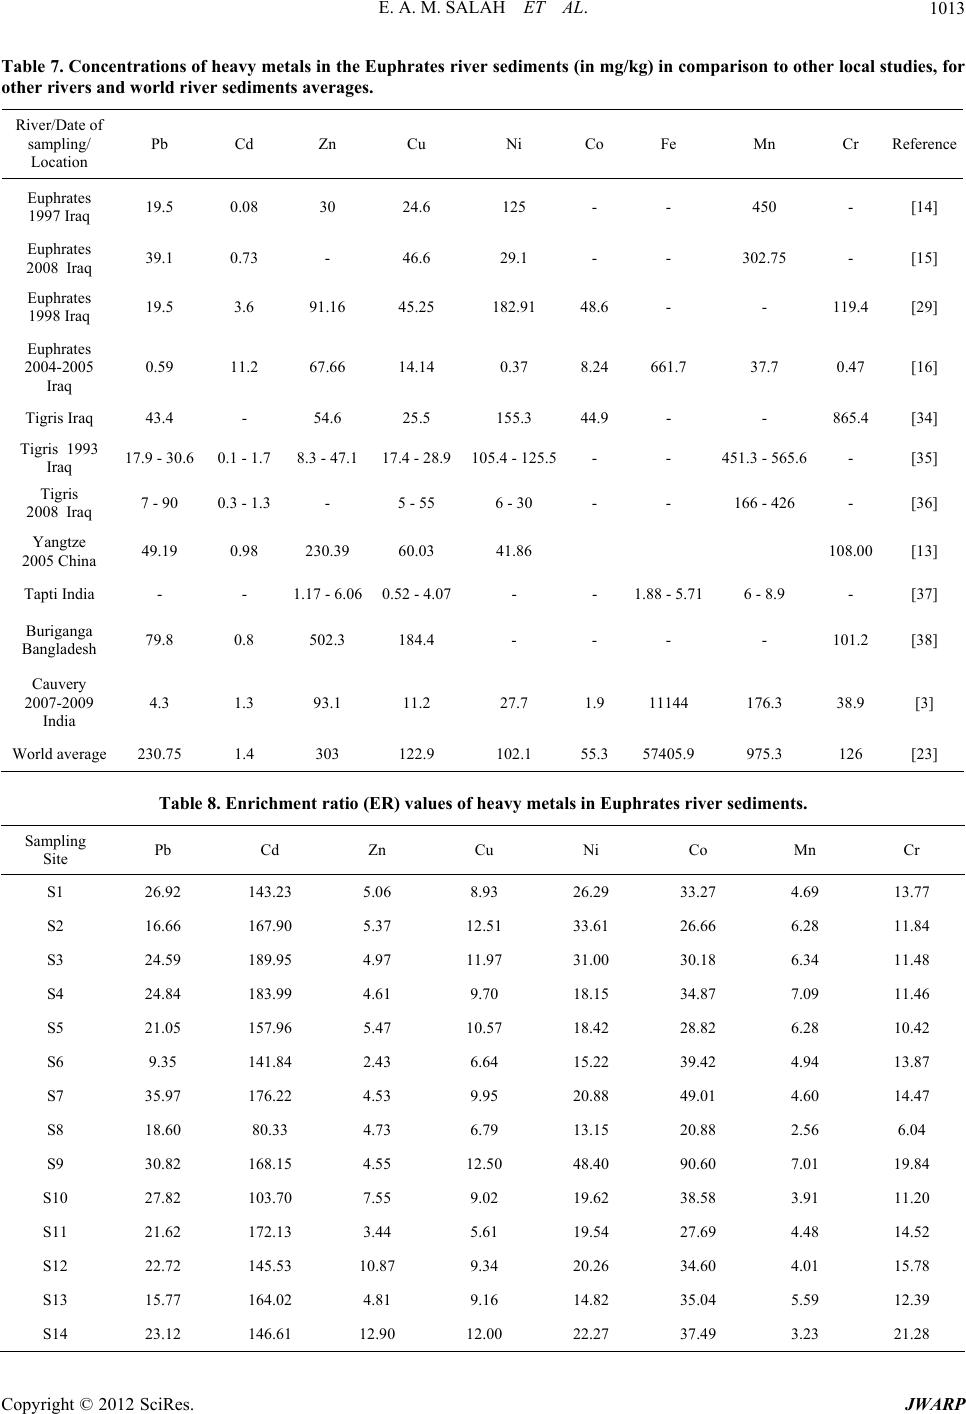 E. A. M. SALAH ET AL. 1013 Table 7. Concentrations of heavy metals in the Euphrates river sediments (in mg/kg) in comparison to other local studies, for other rivers and world river sediments averages. River/Date of sampling/ Location Pb Cd Zn Cu Ni Co Fe Mn Cr Reference Euphrates 1997 Iraq 19.5 0.08 30 24.6 125 - - 450 - [14] Euphrates 2008 Iraq 39.1 0.73 - 46.6 29.1 - - 302.75 - [15] Euphrates 1998 Iraq 19.5 3.6 91.16 45.25 182.91 48.6 - - 119.4 [29] Euphrates 2004-2005 Iraq 0.59 11.2 67.66 14.14 0.37 8.24 661.7 37.7 0.47 [16] Tigris Iraq 43.4 - 54.6 25.5 155.3 44.9 - - 865.4 [34] Tigris 1993 Iraq 17.9 - 30.6 0.1 - 1.7 8.3 - 47.1 17.4 - 28.9105.4 - 125.5- - 451.3 - 565.6 - [35] Tigris 2008 Iraq 7 - 90 0.3 - 1.3 - 5 - 55 6 - 30 - - 166 - 426 - [36] Yangtze 2005 China 49.19 0.98 230.39 60.03 41.86 108.00[13] Tapti India - - 1.17 - 6.06 0.52 - 4.07- - 1.88 - 5.716 - 8.9 - [37] Buriganga Bangladesh 79.8 0.8 502.3 184.4 - - - - 101.2 [38] Cauvery 2007-2009 India 4.3 1.3 93.1 11.2 27.7 1.9 11144 176.3 38.9 [3] World average 230.75 1.4 303 122.9 102.1 55.3 57405.9 975.3 126 [23] Table 8. Enrichment ratio (ER) values of heavy metals in Euphrates river sediments. Sampling Site Pb Cd Zn Cu Ni Co Mn Cr S1 26.92 143.23 5.06 8.93 26.29 33.27 4.69 13.77 S2 16.66 167.90 5.37 12.51 33.61 26.66 6.28 11.84 S3 24.59 189.95 4.97 11.97 31.00 30.18 6.34 11.48 S4 24.84 183.99 4.61 9.70 18.15 34.87 7.09 11.46 S5 21.05 157.96 5.47 10.57 18.42 28.82 6.28 10.42 S6 9.35 141.84 2.43 6.64 15.22 39.42 4.94 13.87 S7 35.97 176.22 4.53 9.95 20.88 49.01 4.60 14.47 S8 18.60 80.33 4.73 6.79 13.15 20.88 2.56 6.04 S9 30.82 168.15 4.55 12.50 48.40 90.60 7.01 19.84 S10 27.82 103.70 7.55 9.02 19.62 38.58 3.91 11.20 S11 21.62 172.13 3.44 5.61 19.54 27.69 4.48 14.52 S12 22.72 145.53 10.87 9.34 20.26 34.60 4.01 15.78 S13 15.77 164.02 4.81 9.16 14.82 35.04 5.59 12.39 S14 23.12 146.61 12.90 12.00 22.27 37.49 3.23 21.28 Copyright © 2012 SciRes. JWARP 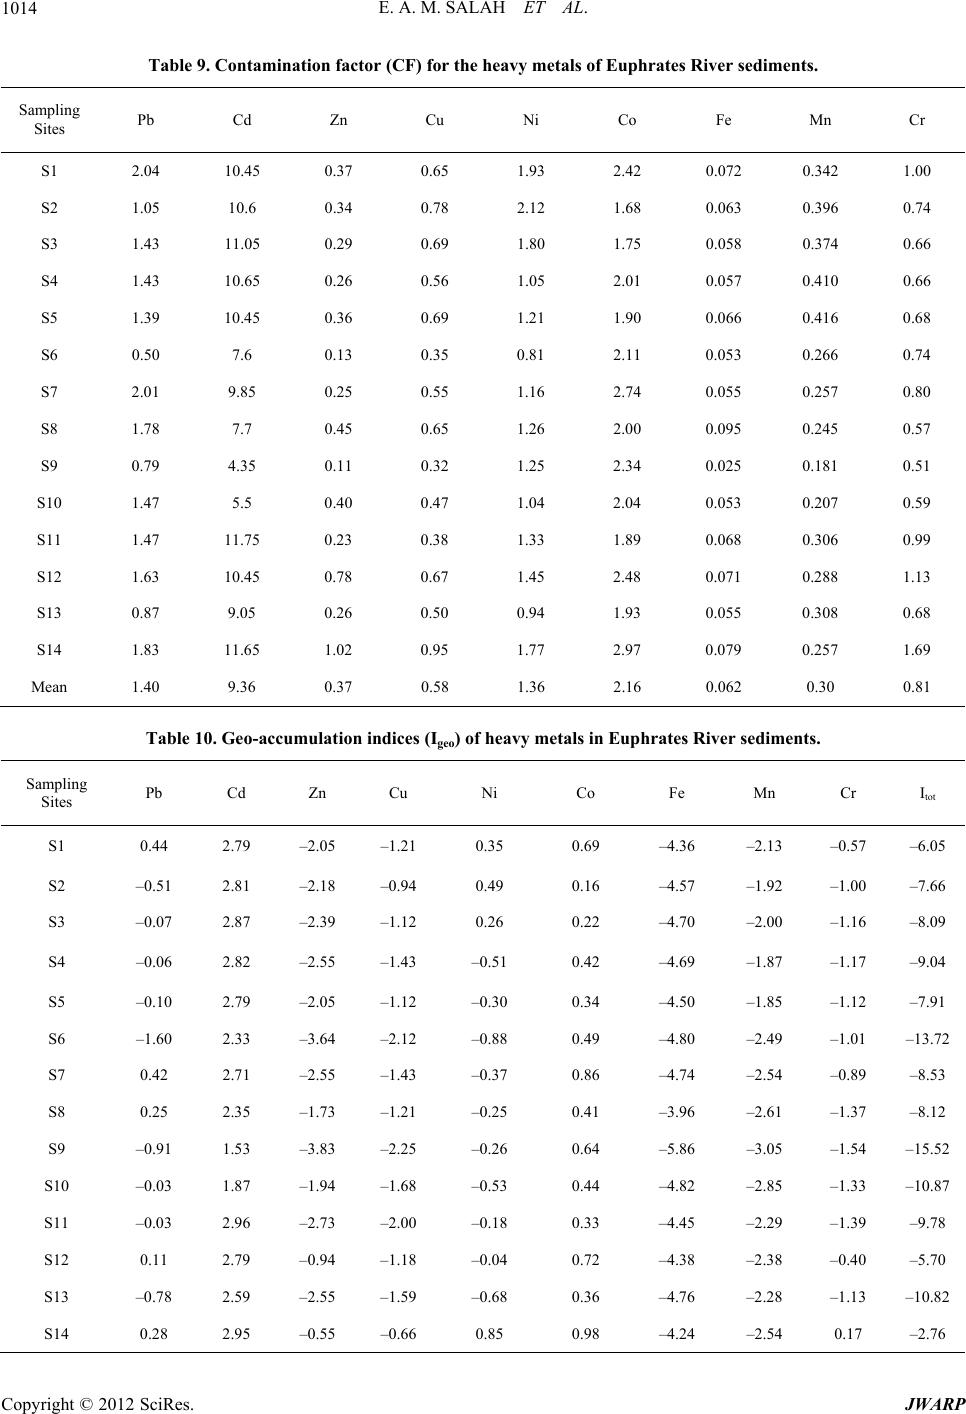 E. A. M. SALAH ET AL. 1014 Table 9. Contamination factor (CF) for the heavy metals of Euphrates River sediments. Sampling Sites Pb Cd Zn Cu Ni Co Fe Mn Cr S1 2.04 10.45 0.37 0.65 1.93 2.42 0.072 0.342 1.00 S2 1.05 10.6 0.34 0.78 2.12 1.68 0.063 0.396 0.74 S3 1.43 11.05 0.29 0.69 1.80 1.75 0.058 0.374 0.66 S4 1.43 10.65 0.26 0.56 1.05 2.01 0.057 0.410 0.66 S5 1.39 10.45 0.36 0.69 1.21 1.90 0.066 0.416 0.68 S6 0.50 7.6 0.13 0.35 0.81 2.11 0.053 0.266 0.74 S7 2.01 9.85 0.25 0.55 1.16 2.74 0.055 0.257 0.80 S8 1.78 7.7 0.45 0.65 1.26 2.00 0.095 0.245 0.57 S9 0.79 4.35 0.11 0.32 1.25 2.34 0.025 0.181 0.51 S10 1.47 5.5 0.40 0.47 1.04 2.04 0.053 0.207 0.59 S11 1.47 11.75 0.23 0.38 1.33 1.89 0.068 0.306 0.99 S12 1.63 10.45 0.78 0.67 1.45 2.48 0.071 0.288 1.13 S13 0.87 9.05 0.26 0.50 0.94 1.93 0.055 0.308 0.68 S14 1.83 11.65 1.02 0.95 1.77 2.97 0.079 0.257 1.69 Mean 1.40 9.36 0.37 0.58 1.36 2.16 0.062 0.30 0.81 Table 10. Geo-accumulation indices (Igeo) of heavy metals in Euphrates River sediments. Sampling Sites Pb Cd Zn Cu Ni Co Fe Mn Cr Itot S1 0.44 2.79 –2.05 –1.21 0.35 0.69 –4.36 –2.13 –0.57 –6.05 S2 –0.51 2.81 –2.18 –0.94 0.49 0.16 –4.57 –1.92 –1.00 –7.66 S3 –0.07 2.87 –2.39 –1.12 0.26 0.22 –4.70 –2.00 –1.16 –8.09 S4 –0.06 2.82 –2.55 –1.43 –0.51 0.42 –4.69 –1.87 –1.17 –9.04 S5 –0.10 2.79 –2.05 –1.12 –0.30 0.34 –4.50 –1.85 –1.12 –7.91 S6 –1.60 2.33 –3.64 –2.12 –0.88 0.49 –4.80 –2.49 –1.01 –13.72 S7 0.42 2.71 –2.55 –1.43 –0.37 0.86 –4.74 –2.54 –0.89 –8.53 S8 0.25 2.35 –1.73 –1.21 –0.25 0.41 –3.96 –2.61 –1.37 –8.12 S9 –0.91 1.53 –3.83 –2.25 –0.26 0.64 –5.86 –3.05 –1.54 –15.52 S10 –0.03 1.87 –1.94 –1.68 –0.53 0.44 –4.82 –2.85 –1.33 –10.87 S11 –0.03 2.96 –2.73 –2.00 –0.18 0.33 –4.45 –2.29 –1.39 –9.78 S12 0.11 2.79 –0.94 –1.18 –0.04 0.72 –4.38 –2.38 –0.40 –5.70 S13 –0.78 2.59 –2.55 –1.59 –0.68 0.36 –4.76 –2.28 –1.13 –10.82 S14 0.28 2.95 –0.55 –0.66 0.85 0.98 –4.24 –2.54 0.17 –2.76 Copyright © 2012 SciRes. JWARP 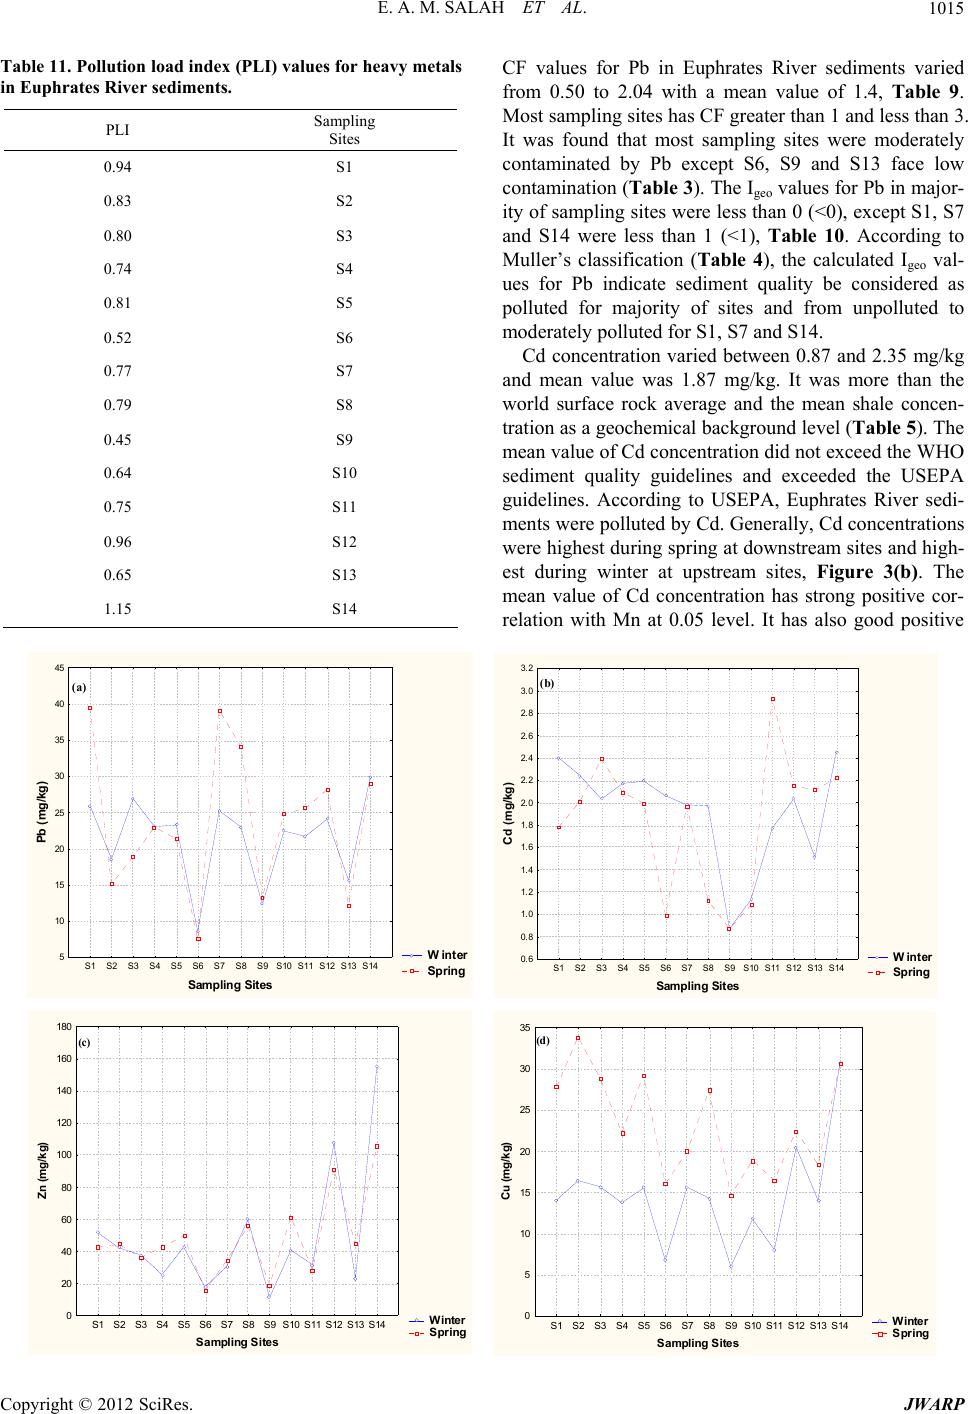 E. A. M. SALAH ET AL. JWARP 1015 Table 11. Pollution load index (PLI) values for heavy metals in Euphrates River sediments. PLI Sampling Sites 0.94 S1 0.83 S2 0.80 S3 0.74 S4 0.81 S5 0.52 S6 0.77 S7 0.79 S8 0.45 S9 0.64 S10 0.75 S11 0.96 S12 0.65 S13 1.15 S14 CF values for Pb in Euphrates River sediments varied from 0.50 to 2.04 with a mean value of 1.4, Table 9. Most sampling sites has CF greater than 1 and less than 3. It was found that most sampling sites were moderately contaminated by Pb except S6, S9 and S13 face low contamination (Table 3). The Igeo values for Pb in major- ity of sampling sites were less than 0 (<0), except S1, S7 and S14 were less than 1 (<1), Table 10. According to Muller’s classification (Table 4), the calculated Igeo val- ues for Pb indicate sediment quality be considered as polluted for majority of sites and from unpolluted to moderately polluted for S1, S7 and S14. Cd concentration varied between 0.87 and 2.35 mg/kg and mean value was 1.87 mg/kg. It was more than the world surface rock average and the mean shale concen- tration as a geochemical background level (Table 5). The mean value of Cd concentration did not exceed the WHO sediment quality guidelines and exceeded the USEPA guidelines. According to USEPA, Euphrates River sedi- ments were polluted by Cd. Generally, Cd concentrations were highest during spring at downstream sites and high- est during winter at upstream sites, Figure 3(b). The mean value of Cd concentration has strong positive cor- relation with Mn at 0.05 level. It has also good positive Copyright © 2012 SciRes. Winter Spring S1 S2 S3 S4 S5 S6 S7S8 S9S10S11S12S13S14 Sa mpling Sites 5 10 15 20 25 30 35 40 45 Pb (mg/kg) (a) 0.6 0.8 1.0 1.2 1.4 1.6 1.8 2.0 2.2 2.4 2.6 2.8 3.0 3.2 Cd (m g/kg) Winter S1 S2 S3 S4 S5 S6 S7 S8 S9S10S11S12S13S14 Sampling Sites (b) Spring Winter Spring S1 S2 S3 S4 S5 S6 S7 S8 S9S10S11S12S13 Sampling Sites S14 0 20 40 60 80 100 120 140 160 180 Zn (mg/kg) (c) 0 5 10 15 20 25 30 35 Cu (mg/kg) (d) Winter S1 S2S3 S4S5S6 S7S8S9S10S11S12S13S14 Sampling Sites Spring 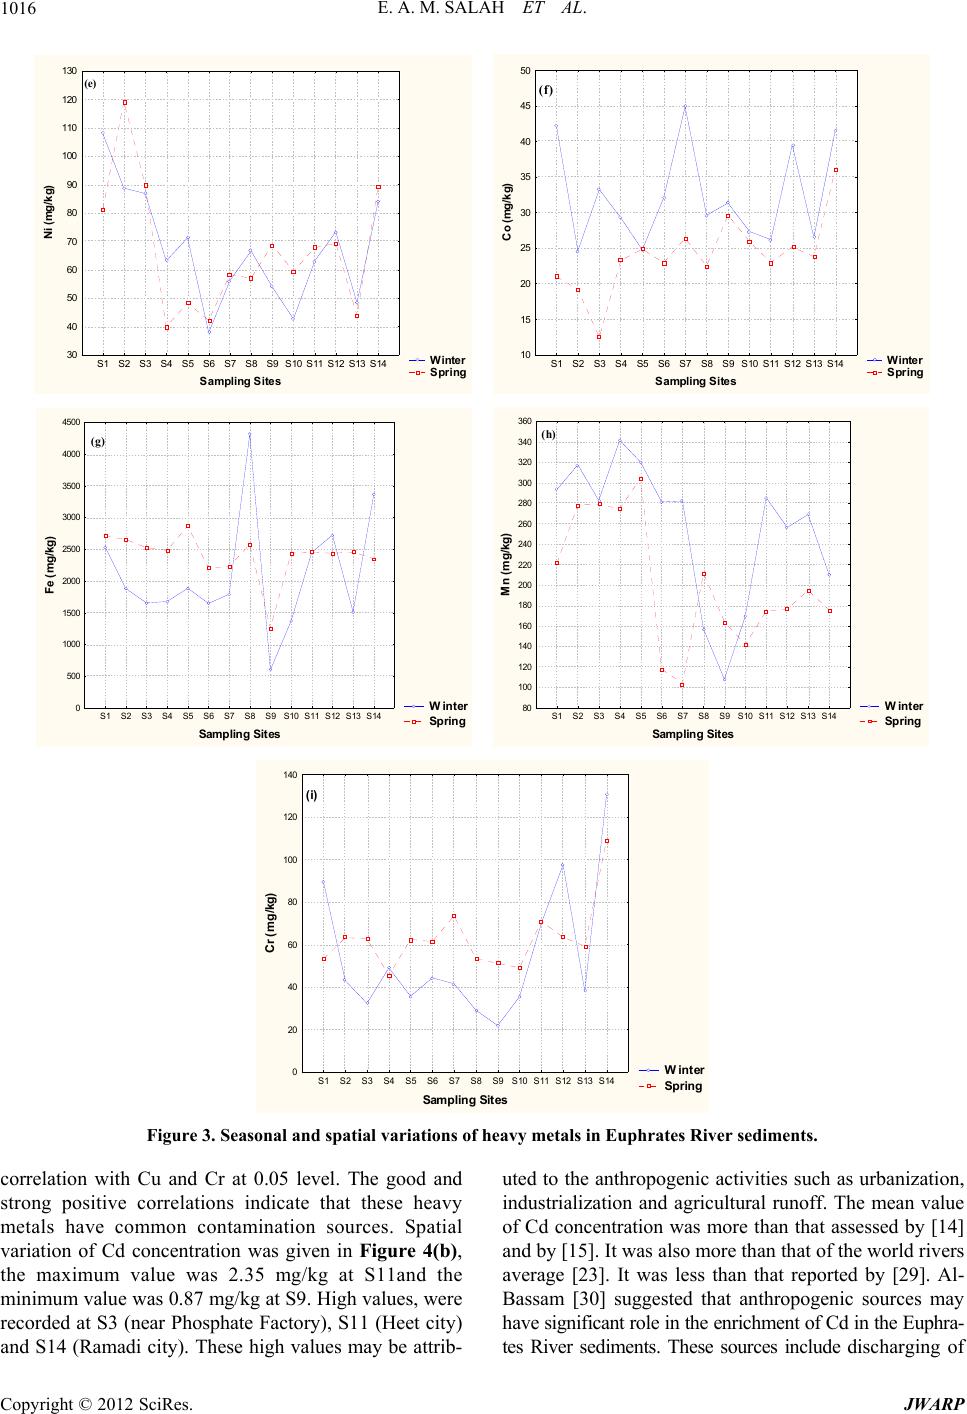 E. A. M. SALAH ET AL. 1016 Winter Spring S1 S2S3 S4 S5S6 S7S8 S9S10S11S12S13 Sampling Sites S14 30 40 50 60 70 80 90 100 110 120 130 Ni (mg/kg) (e) 10 15 20 25 30 35 40 45 50 Co (mg/kg) (f) Winter S1 S2 S3 S4 S5 S6 S7 S8 S9S10S11S12S13S14 Sampling Sites Spring Winter Spring S1 S2S3 S4 S5S6 S7 S8S9S10S11S12S13S Sa mpling Sites 14 0 500 1000 1500 2000 2500 3000 3500 4000 4500 Fe (mg/ kg) (g) 80 100 120 140 160 180 200 220 240 260 280 300 320 340 360 Mn (m g/kg) (h) Winter S1 S2S3 S4S5 S6 S7S8 S9S10S11S12S13S14 Sampling Si tes Spring S1 S2 S3 S4 S5 S6 S7 S8S9S10S11S12S13 Sampling Sites Winter Spring S14 0 20 40 60 80 100 120 140 Cr (m g /kg) (i) Figure 3. Seasonal and spatial variations of heavy metals in Euphrates River sediments. correlation with Cu and Cr at 0.05 level. The good and strong positive correlations indicate that these heavy metals have common contamination sources. Spatial variation of Cd concentration was given in Figure 4(b), the maximum value was 2.35 mg/kg at S11and the minimum value was 0.87 mg/kg at S9. High values, were recorded at S3 (near Phosphate Factory), S11 (Heet city) and S14 (Ramadi city). These high values may be attrib- uted to the anthropogenic activities such as urbanization, industrialization and agricultural runoff. The mean value of Cd concentration was more than that assessed by [14] and by [15]. It was also more than that of the world rivers average [23]. It was less than that reported by [29]. Al- Bassam [30] suggested that anthropogenic sources may have significant role in the enrichment of Cd in the Euphra- tes River sediments. These sources include discharging of Copyright © 2012 SciRes. JWARP  E. A. M. SALAH ET AL. 1017 S1 S2 S3 S4 S5 S6 S7S8 S9S10S1 Sampling Sites 1 S12S13S14 6 8 10 12 14 16 18 20 22 24 26 28 30 32 34 Pb (mg/k g) (a) 0.8 1.0 1.2 1.4 1.6 1.8 2.0 2.2 2.4 2.6 Cd (m g/kg ) (b) S1 S2 S3 S4 S5 S6 S7S8 S9S10S11S12S13S14 Sampling Sites S1 S2 S3 S4 S5 S6 S7 S8 S9S10S11 Sampling Sites S12 S13 S14 0 20 40 60 80 100 120 140 Zn (mg/kg) (c) 8 10 12 14 16 18 20 22 24 26 28 30 32 Cu (mg/k g) (d) S1 S2 S3S4S5 S6S7S8 S9S10S11S12S13S14 Samp ling Sites S1 S2 S3 S4 S5 S6 S7 S8 S9S10S1 Sampling Sites 1 S12S13S14 30 40 50 60 70 80 90 100 110 Ni (mg / k g ) (e) 20 22 24 26 28 30 32 34 36 38 40 Co (mg / k g ) (f) S1 S2 S3 S4 S5 S6 S7 S8 S9S10S11S12S13S14 Sampling Sites S1 S2 S3 S4 S5 S6 S7 S8 S9S10S1 Sampling Sites 1 S12S13S14 800 1000 1200 1400 1600 1800 2000 2200 2400 2600 2800 3000 3200 3400 3600 Fe (mg/ k g ) (g) 120 140 160 180 200 220 240 260 280 300 320 Mn ( mg/k g ) (h) S1 S2 S3 S4 S5 S6 S7 S8 S9S10S11S12S13S14 Sampling Sites Copyright © 2012 SciRes. JWARP 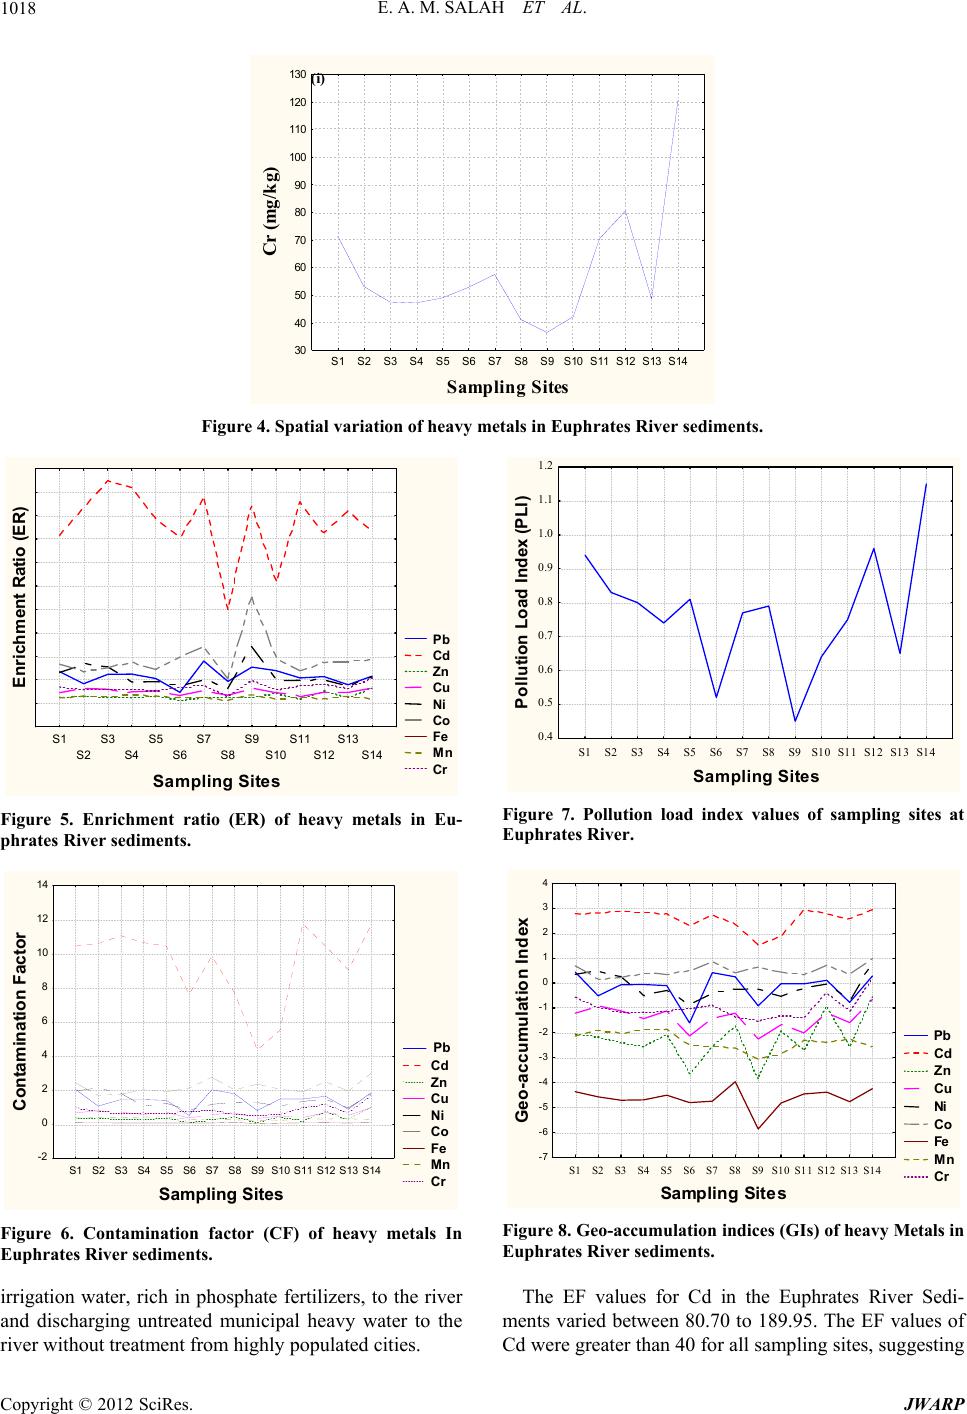 E. A. M. SALAH ET AL. 1018 S1 S2 S3 S4 S5 S6 S7 S8 S9S10S11 Sampling Sites S12 S13S14 30 40 50 60 70 80 90 100 110 120 130 Cr (mg/ kg) (i) Figure 4. Spatial variation of heavy metals in Euphrates River sediments. 0.4 0.5 0.6 0.7 0.8 0.9 1.0 1.1 1.2 P o l l u ti o n L o ad In d ex (P LI) S1 S2 S3S4 S5S6 S7S8S9 S10 S11S12 S13 Sampling S i te s Pb Cd Zn Cu Ni Co Fe Mn Cr S14 Enrichment Ratio (ER) S1 S2 S3 S4S5 S6S7 S8 S9S10S11S12S13S14 Sam pling Sites Figure 5. Enrichment ratio (ER) of heavy metals in Eu- phrates River sediments. Pb Cd Zn Cu Ni Co Fe Mn Cr S1 S2 S3 S4 S5S6 S7 S8S9S10S11S12S Sampling Sites 13 S14 -2 0 2 4 6 8 10 12 14 Contamination Factor Figure 6. Contamination factor (CF) of heavy metals In Euphrates River sediments. irrigation water, rich in phosphate fertilizers, to the river and discharging untreated municipal heavy water to the river without treatment from highly populated cities. Figure 7. Pollution load index values of sampling sites at Euphrates River. -7 -6 -5 -4 -3 -2 -1 0 1 2 3 4 Geo-accumulation Index Pb Cd Zn Cu Ni Co Fe Mn S1 S2 S3 S4 S5 S6 S7 S8 S9S10S11S12S13S14 Sa mpling Sites Cr Figure 8. Geo-accumulation indices (GIs) of heavy Metals in Euphrates River sediments. The EF values for Cd in the Euphrates River Sedi- ments varied between 80.70 to 189.95. The EF values of Cd were greater than 40 for all sampling sites, suggesting Copyright © 2012 SciRes. JWARP 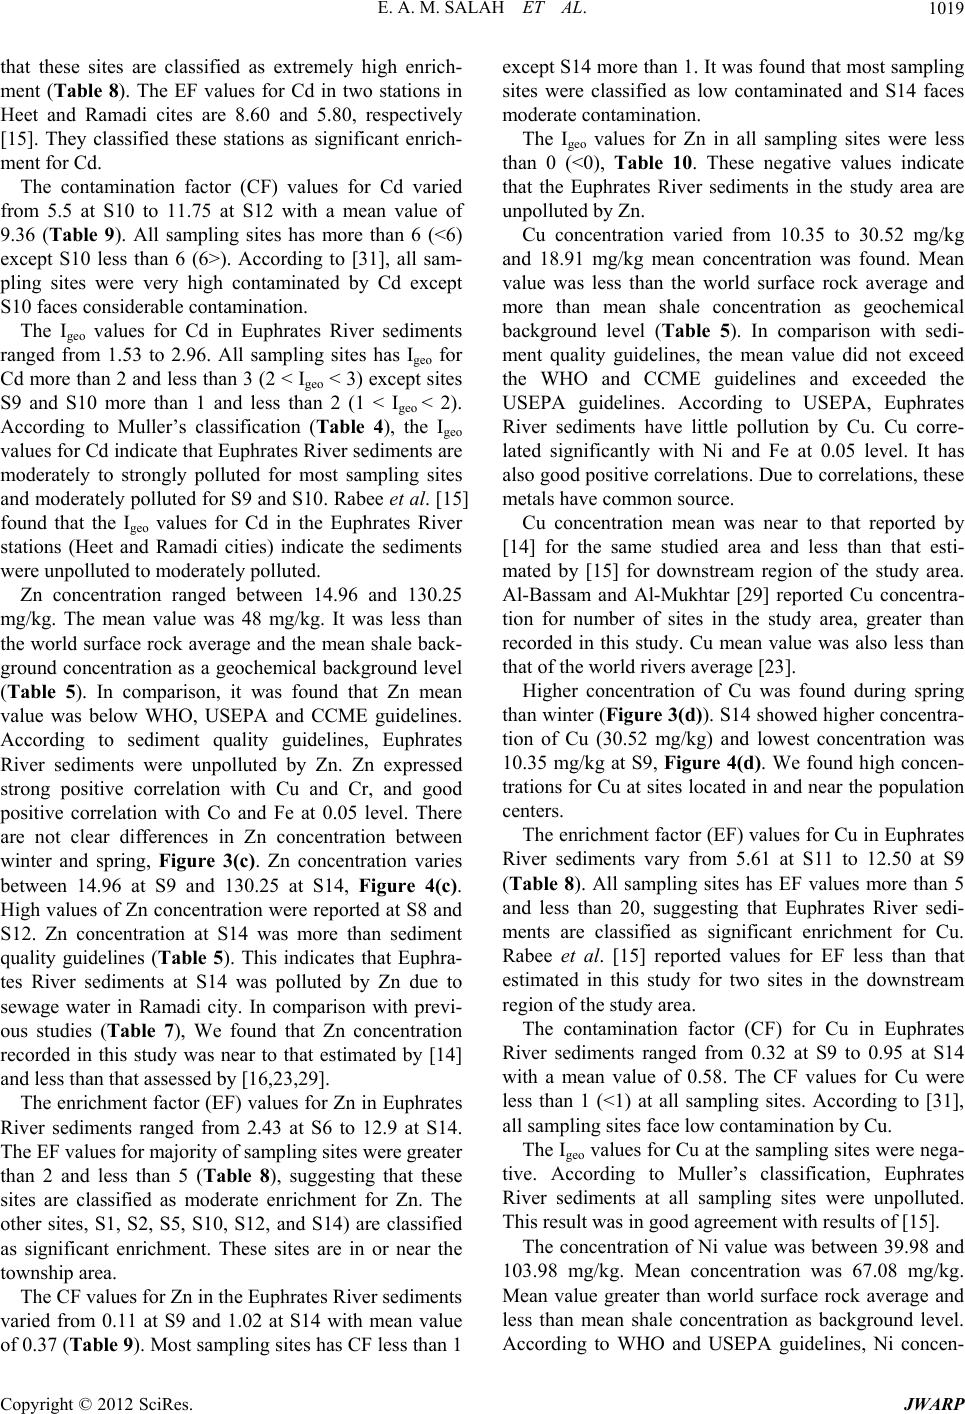 E. A. M. SALAH ET AL. 1019 that these sites are classified as extremely high enrich- ment (Table 8). The EF values for Cd in two stations in Heet and Ramadi cites are 8.60 and 5.80, respectively [15]. They classified these stations as significant enrich- ment for Cd. The contamination factor (CF) values for Cd varied from 5.5 at S10 to 11.75 at S12 with a mean value of 9.36 (Table 9). All sampling sites has more than 6 (<6) except S10 less than 6 (6>). According to [31], all sam- pling sites were very high contaminated by Cd except S10 faces considerable contamination. The Igeo values for Cd in Euphrates River sediments ranged from 1.53 to 2.96. All sampling sites has Igeo for Cd more than 2 and less than 3 (2 < Igeo < 3) except sites S9 and S10 more than 1 and less than 2 (1 < Igeo < 2). According to Muller’s classification (Table 4), the Igeo values for Cd indicate that Euphrates River sediments are moderately to strongly polluted for most sampling sites and moderately polluted for S9 and S10. Rabee et al. [15] found that the Igeo values for Cd in the Euphrates River stations (Heet and Ramadi cities) indicate the sediments were unpolluted to moderately polluted. Zn concentration ranged between 14.96 and 130.25 mg/kg. The mean value was 48 mg/kg. It was less than the world surface rock average and the mean shale back- ground concentration as a geochemical background level (Table 5). In comparison, it was found that Zn mean value was below WHO, USEPA and CCME guidelines. According to sediment quality guidelines, Euphrates River sediments were unpolluted by Zn. Zn expressed strong positive correlation with Cu and Cr, and good positive correlation with Co and Fe at 0.05 level. There are not clear differences in Zn concentration between winter and spring, Figure 3(c). Zn concentration varies between 14.96 at S9 and 130.25 at S14, Figure 4(c). High values of Zn concentration were reported at S8 and S12. Zn concentration at S14 was more than sediment quality guidelines (Table 5). This indicates that Euphra- tes River sediments at S14 was polluted by Zn due to sewage water in Ramadi city. In comparison with previ- ous studies (Table 7), We found that Zn concentration recorded in this study was near to that estimated by [14] and less than that assessed by [16,23,29]. The enrichment factor (EF) values for Zn in Euphrates River sediments ranged from 2.43 at S6 to 12.9 at S14. The EF values for majority of sampling sites were greater than 2 and less than 5 (Table 8), suggesting that these sites are classified as moderate enrichment for Zn. The other sites, S1, S2, S5, S10, S12, and S14) are classified as significant enrichment. These sites are in or near the township area. The CF values for Zn in the Euphrates River sediments varied from 0.11 at S9 and 1.02 at S14 with mean value of 0.37 (Tab le 9 ). Most sampling sites has CF less than 1 except S14 more than 1. It was found that most sampling sites were classified as low contaminated and S14 faces moderate contamination. The Igeo values for Zn in all sampling sites were less than 0 (<0), Table 10. These negative values indicate that the Euphrates River sediments in the study area are unpolluted by Zn. Cu concentration varied from 10.35 to 30.52 mg/kg and 18.91 mg/kg mean concentration was found. Mean value was less than the world surface rock average and more than mean shale concentration as geochemical background level (Table 5). In comparison with sedi- ment quality guidelines, the mean value did not exceed the WHO and CCME guidelines and exceeded the USEPA guidelines. According to USEPA, Euphrates River sediments have little pollution by Cu. Cu corre- lated significantly with Ni and Fe at 0.05 level. It has also good positive correlations. Due to correlations, these metals have common source. Cu concentration mean was near to that reported by [14] for the same studied area and less than that esti- mated by [15] for downstream region of the study area. Al-Bassam and Al-Mukhtar [29] reported Cu concentra- tion for number of sites in the study area, greater than recorded in this study. Cu mean value was also less than that of the world rivers average [23]. Higher concentration of Cu was found during spring than winter (Figure 3(d)). S14 showed higher concentra- tion of Cu (30.52 mg/kg) and lowest concentration was 10.35 mg/kg at S9, Figure 4(d). We found high concen- trations for Cu at sites located in and near the population centers. The enrichment factor (EF) values for Cu in Euphrates River sediments vary from 5.61 at S11 to 12.50 at S9 (Table 8). All sampling sites has EF values more than 5 and less than 20, suggesting that Euphrates River sedi- ments are classified as significant enrichment for Cu. Rabee et al. [15] reported values for EF less than that estimated in this study for two sites in the downstream region of the study area. The contamination factor (CF) for Cu in Euphrates River sediments ranged from 0.32 at S9 to 0.95 at S14 with a mean value of 0.58. The CF values for Cu were less than 1 (<1) at all sampling sites. According to [31], all sampling sites face low contamination by Cu. The Igeo values for Cu at the sampling sites were nega- tive. According to Muller’s classification, Euphrates River sediments at all sampling sites were unpolluted. This result was in good agreement with results of [15]. The concentration of Ni value was between 39.98 and 103.98 mg/kg. Mean concentration was 67.08 mg/kg. Mean value greater than world surface rock average and less than mean shale concentration as background level. According to WHO and USEPA guidelines, Ni concen- Copyright © 2012 SciRes. JWARP 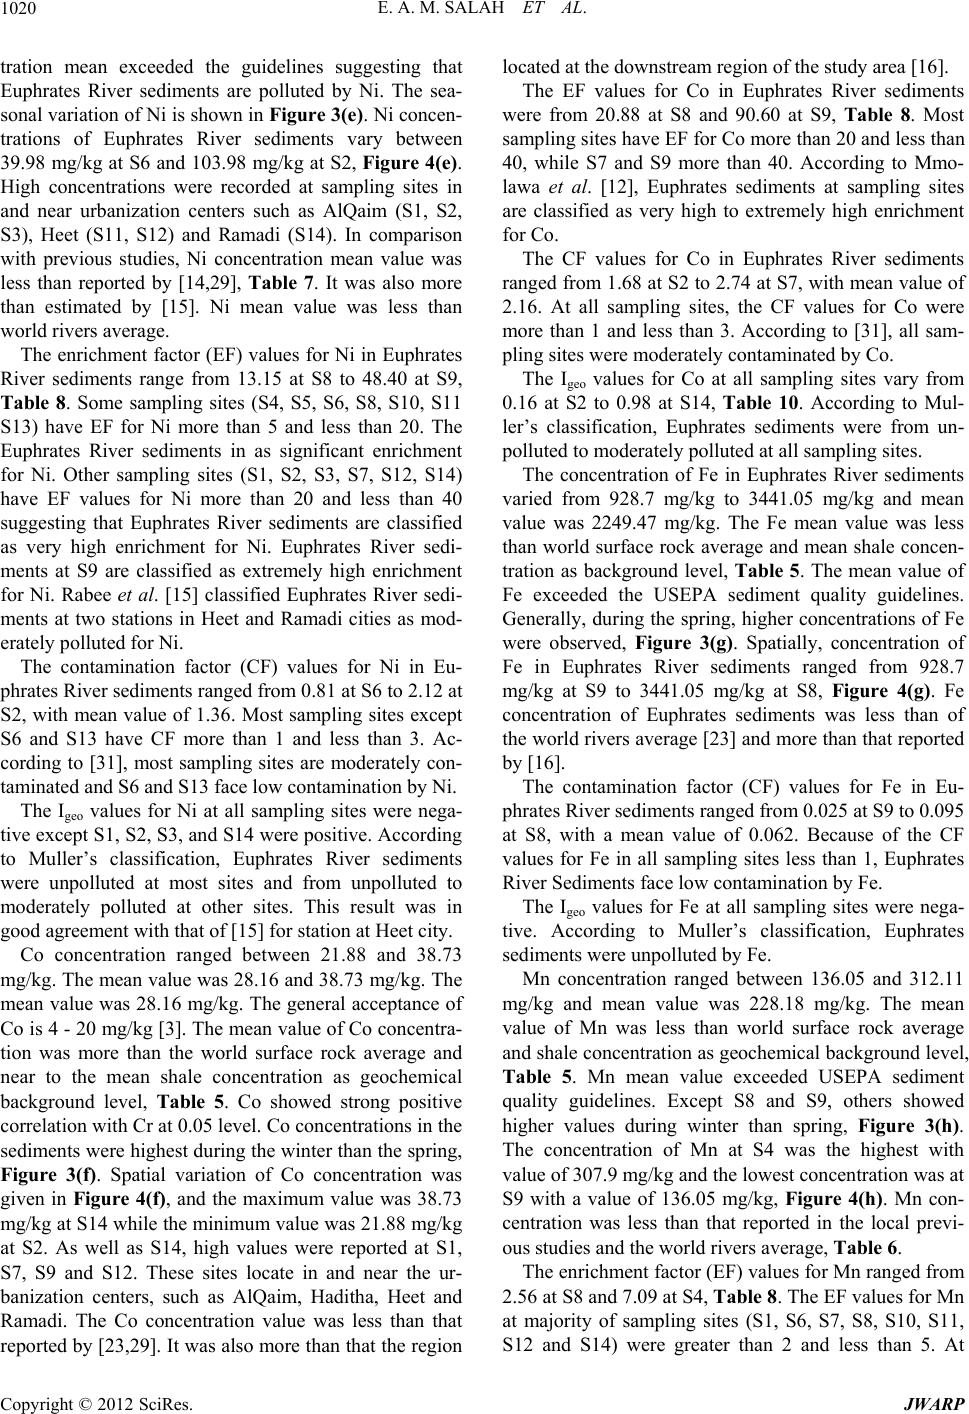 E. A. M. SALAH ET AL. 1020 tration mean exceeded the guidelines suggesting that Euphrates River sediments are polluted by Ni. The sea- sonal variation of Ni is shown in Figure 3(e). Ni concen- trations of Euphrates River sediments vary between 39.98 mg/kg at S6 and 103.98 mg/kg at S2, Figure 4(e). High concentrations were recorded at sampling sites in and near urbanization centers such as AlQaim (S1, S2, S3), Heet (S11, S12) and Ramadi (S14). In comparison with previous studies, Ni concentration mean value was less than reported by [14,29], Table 7. It was also more than estimated by [15]. Ni mean value was less than world rivers average. The enrichment factor (EF) values for Ni in Euphrates River sediments range from 13.15 at S8 to 48.40 at S9, Table 8. Some sampling sites (S4, S5, S6, S8, S10, S11 S13) have EF for Ni more than 5 and less than 20. The Euphrates River sediments in as significant enrichment for Ni. Other sampling sites (S1, S2, S3, S7, S12, S14) have EF values for Ni more than 20 and less than 40 suggesting that Euphrates River sediments are classified as very high enrichment for Ni. Euphrates River sedi- ments at S9 are classified as extremely high enrichment for Ni. Rabee et al. [15] classified Euphrates River sedi- ments at two stations in Heet and Ramadi cities as mod- erately polluted for Ni. The contamination factor (CF) values for Ni in Eu- phrates River sediments ranged from 0.81 at S6 to 2.12 at S2, with mean value of 1.36. Most sampling sites except S6 and S13 have CF more than 1 and less than 3. Ac- cording to [31], most sampling sites are moderately con- taminated and S6 and S13 face low contamination by Ni. The Igeo values for Ni at all sampling sites were nega- tive except S1, S2, S3, and S14 were positive. According to Muller’s classification, Euphrates River sediments were unpolluted at most sites and from unpolluted to moderately polluted at other sites. This result was in good agreement with that of [15] for station at Heet city. Co concentration ranged between 21.88 and 38.73 mg/kg. The mean value was 28.16 and 38.73 mg/kg. The mean value was 28.16 mg/kg. The general acceptance of Co is 4 - 20 mg/kg [3]. The mean value of Co concentra- tion was more than the world surface rock average and near to the mean shale concentration as geochemical background level, Table 5. Co showed strong positive correlation with Cr at 0.05 level. Co concentrations in the sediments were highest during the winter than the spring, Figure 3(f). Spatial variation of Co concentration was given in Figure 4(f), and the maximum value was 38.73 mg/kg at S14 while the minimum value was 21.88 mg/kg at S2. As well as S14, high values were reported at S1, S7, S9 and S12. These sites locate in and near the ur- banization centers, such as AlQaim, Haditha, Heet and Ramadi. The Co concentration value was less than that reported by [23,29]. It was also more than that the region located at the downstream region of the study area [16]. The EF values for Co in Euphrates River sediments were from 20.88 at S8 and 90.60 at S9, Table 8. Most sampling sites have EF for Co more than 20 and less than 40, while S7 and S9 more than 40. According to Mmo- lawa et al. [12], Euphrates sediments at sampling sites are classified as very high to extremely high enrichment for Co. The CF values for Co in Euphrates River sediments ranged from 1.68 at S2 to 2.74 at S7, with mean value of 2.16. At all sampling sites, the CF values for Co were more than 1 and less than 3. According to [31], all sam- pling sites were moderately contaminated by Co. The Igeo values for Co at all sampling sites vary from 0.16 at S2 to 0.98 at S14, Table 10. According to Mul- ler’s classification, Euphrates sediments were from un- polluted to moderately polluted at all sampling sites. The concentration of Fe in Euphrates River sediments varied from 928.7 mg/kg to 3441.05 mg/kg and mean value was 2249.47 mg/kg. The Fe mean value was less than world surface rock average and mean shale concen- tration as background level, Table 5. The mean value of Fe exceeded the USEPA sediment quality guidelines. Generally, during the spring, higher concentrations of Fe were observed, Figure 3(g). Spatially, concentration of Fe in Euphrates River sediments ranged from 928.7 mg/kg at S9 to 3441.05 mg/kg at S8, Figure 4(g). Fe concentration of Euphrates sediments was less than of the world rivers average [23] and more than that reported by [16]. The contamination factor (CF) values for Fe in Eu- phrates River sediments ranged from 0.025 at S9 to 0.095 at S8, with a mean value of 0.062. Because of the CF values for Fe in all sampling sites less than 1, Euphrates River Sediments face low contamination by Fe. The Igeo values for Fe at all sampling sites were nega- tive. According to Muller’s classification, Euphrates sediments were unpolluted by Fe. Mn concentration ranged between 136.05 and 312.11 mg/kg and mean value was 228.18 mg/kg. The mean value of Mn was less than world surface rock average and shale concentration as geochemical background level, Table 5. Mn mean value exceeded USEPA sediment quality guidelines. Except S8 and S9, others showed higher values during winter than spring, Figure 3(h). The concentration of Mn at S4 was the highest with value of 307.9 mg/kg and the lowest concentration was at S9 with a value of 136.05 mg/kg, Figure 4(h). Mn con- centration was less than that reported in the local previ- ous studies and the world rivers average, Table 6. The enrichment factor (EF) values for Mn ranged from 2.56 at S8 and 7.09 at S4, Table 8. The EF values for Mn at majority of sampling sites (S1, S6, S7, S8, S10, S11, S12 and S14) were greater than 2 and less than 5. At Copyright © 2012 SciRes. JWARP 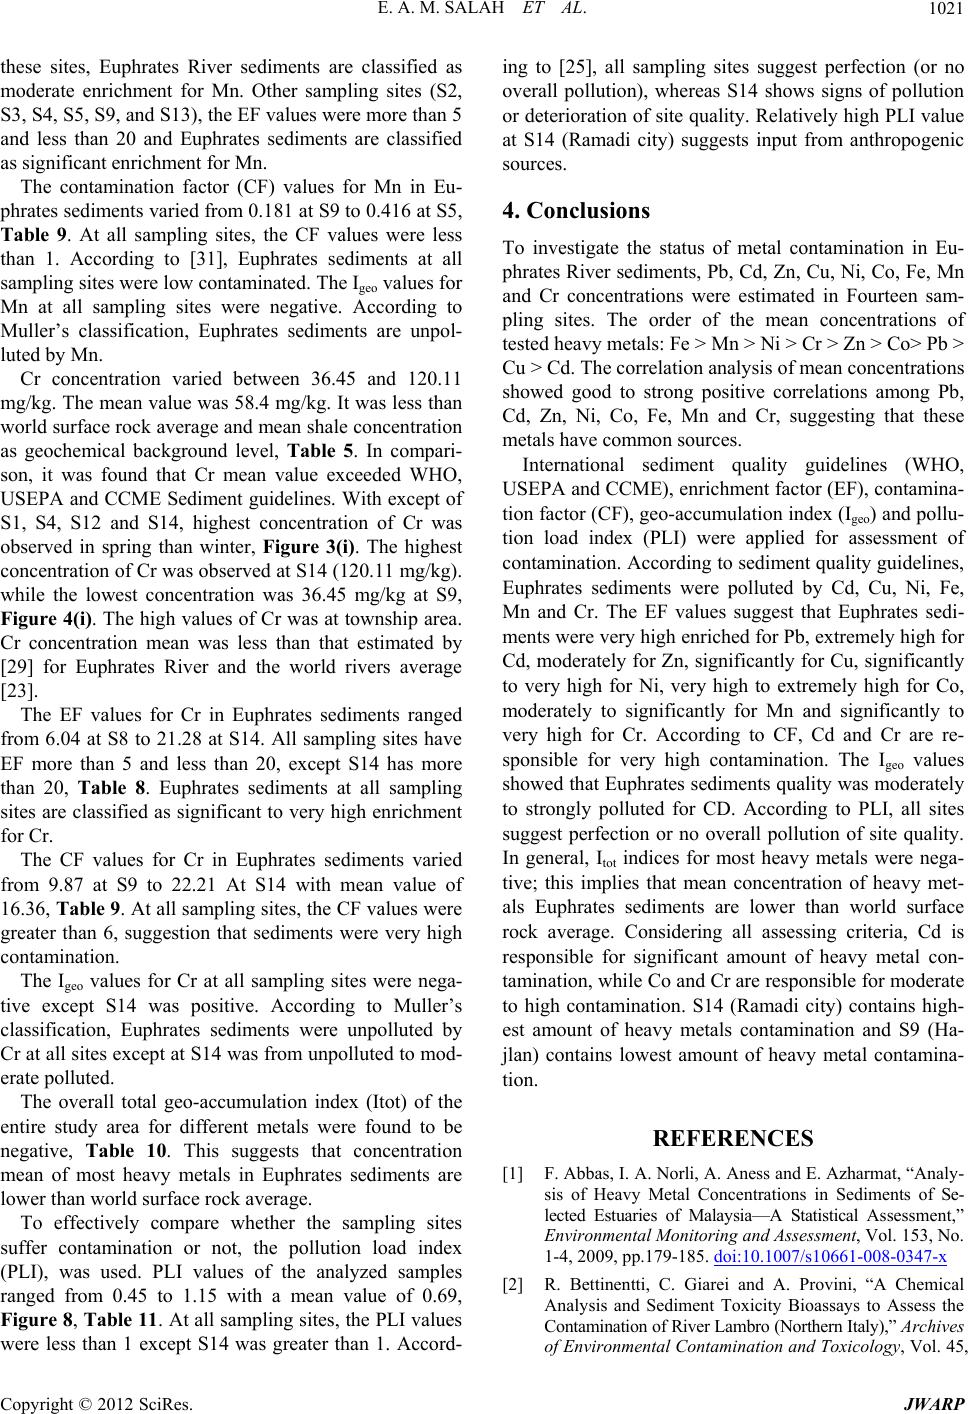 E. A. M. SALAH ET AL. 1021 these sites, Euphrates River sediments are classified as moderate enrichment for Mn. Other sampling sites (S2, S3, S4, S5, S9, and S13), the EF values were more than 5 and less than 20 and Euphrates sediments are classified as significant enrichment for Mn. The contamination factor (CF) values for Mn in Eu- phrates sediments varied from 0.181 at S9 to 0.416 at S5, Table 9. At all sampling sites, the CF values were less than 1. According to [31], Euphrates sediments at all sampling sites were low contaminated. The Igeo values for Mn at all sampling sites were negative. According to Muller’s classification, Euphrates sediments are unpol- luted by Mn. Cr concentration varied between 36.45 and 120.11 mg/kg. The mean value was 58.4 mg/kg. It was less than world surface rock average and mean shale concentration as geochemical background level, Table 5. In compari- son, it was found that Cr mean value exceeded WHO, USEPA and CCME Sediment guidelines. With except of S1, S4, S12 and S14, highest concentration of Cr was observed in spring than winter, Figure 3(i). The highest concentration of Cr was observed at S14 (120.11 mg/kg). while the lowest concentration was 36.45 mg/kg at S9, Figure 4(i). The high values of Cr was at township area. Cr concentration mean was less than that estimated by [29] for Euphrates River and the world rivers average [23]. The EF values for Cr in Euphrates sediments ranged from 6.04 at S8 to 21.28 at S14. All sampling sites have EF more than 5 and less than 20, except S14 has more than 20, Table 8. Euphrates sediments at all sampling sites are classified as significant to very high enrichment for Cr. The CF values for Cr in Euphrates sediments varied from 9.87 at S9 to 22.21 At S14 with mean value of 16.36, Table 9 . At all sampling sites, the CF values were greater than 6, suggestion that sediments were very high contamination. The Igeo values for Cr at all sampling sites were nega- tive except S14 was positive. According to Muller’s classification, Euphrates sediments were unpolluted by Cr at all sites except at S14 was from unpolluted to mod- erate polluted. The overall total geo-accumulation index (Itot) of the entire study area for different metals were found to be negative, Table 10. This suggests that concentration mean of most heavy metals in Euphrates sediments are lower than world surface rock average. To effectively compare whether the sampling sites suffer contamination or not, the pollution load index (PLI), was used. PLI values of the analyzed samples ranged from 0.45 to 1.15 with a mean value of 0.69, Figure 8, Table 11. At all sampling sites, the PLI values were less than 1 except S14 was greater than 1. Accord- ing to [25], all sampling sites suggest perfection (or no overall pollution), whereas S14 shows signs of pollution or deterioration of site quality. Relatively high PLI value at S14 (Ramadi city) suggests input from anthropogenic sources. 4. Conclusions To investigate the status of metal contamination in Eu- phrates River sediments, Pb, Cd, Zn, Cu, Ni, Co, Fe, Mn and Cr concentrations were estimated in Fourteen sam- pling sites. The order of the mean concentrations of tested heavy metals: Fe > Mn > Ni > Cr > Zn > Co> Pb > Cu > Cd. The correlation analysis of mean concentrations showed good to strong positive correlations among Pb, Cd, Zn, Ni, Co, Fe, Mn and Cr, suggesting that these metals have common sources. International sediment quality guidelines (WHO, USEPA and CCME), enrichment factor (EF), contamina- tion factor (CF), geo-accumulation index (Igeo) and pollu- tion load index (PLI) were applied for assessment of contamination. According to sediment quality guidelines, Euphrates sediments were polluted by Cd, Cu, Ni, Fe, Mn and Cr. The EF values suggest that Euphrates sedi- ments were very high enriched for Pb, extremely high for Cd, moderately for Zn, significantly for Cu, significantly to very high for Ni, very high to extremely high for Co, moderately to significantly for Mn and significantly to very high for Cr. According to CF, Cd and Cr are re- sponsible for very high contamination. The Igeo values showed that Euphrates sediments quality was moderately to strongly polluted for CD. According to PLI, all sites suggest perfection or no overall pollution of site quality. In general, Itot indices for most heavy metals were nega- tive; this implies that mean concentration of heavy met- als Euphrates sediments are lower than world surface rock average. Considering all assessing criteria, Cd is responsible for significant amount of heavy metal con- tamination, while Co and Cr are responsible for moderate to high contamination. S14 (Ramadi city) contains high- est amount of heavy metals contamination and S9 (Ha- jlan) contains lowest amount of heavy metal contamina- tion. REFERENCES [1] F. Abbas, I. A. Norli, A. Aness and E. Azharmat, “Analy- sis of Heavy Metal Concentrations in Sediments of Se- lected Estuaries of Malaysia—A Statistical Assessment,” Environmental Monitoring and Assessment, Vol. 153, No. 1-4, 2009, pp.179-185. doi:10.1007/s10661-008-0347-x [2] R. Bettinentti, C. Giarei and A. Provini, “A Chemical Analysis and Sediment Toxicity Bioassays to Assess the Contamination of River Lambro (Northern Italy),” Archives of Environmental Contamination and Toxicology, Vol. 45, Copyright © 2012 SciRes. JWARP  E. A. M. SALAH ET AL. 1022 No. 1, 2003, pp. 72-78. doi:10.1007/s00244-002-0126-6 [3] K. V. Raju, R. Somashekar and K. Prakash, “Heavy Metal Status of Sediment in River Cauvery, Karnataka,” Environmental Monitoring and Assessment, Vol. 184, No. 1, 2012, pp. 361-373. doi:10.1007/s10661-011-1973-2 [4] M. Chakravarty and A. Patgiri, “Metal Pollution Assess- ment in Sediments of the Dikrong River, N. E. India,” Journal of Human Ecology, Vol. 27, No. 1, 2009, pp. 63-67. [5] S. Olivares-Rieumont, D. de la Rosa, L. Lima, D. Graham, K. Alessandro, J. Borroto, et al., “Assessment of Heavy Metal Levels in Almendares River Sediments—Havana City, Cuba,” Water Research, Vol. 39, No. 16, 2005, pp. 3945-3953. doi:10.1016/j.watres.2005.07.011 [6] I. Brunner, J. Luster, M. Günthardt-Goerg and B. Frey, “Heavy Metal Accumulation and Phytostabilisation Po- tential of Tree Fine Roots in a Ccontamination Soil,” En- vironmental Pollution, Vol. 152, No. 3, 2008, pp. 559- 568. doi:10.1016/j.envpol.2007.07.006 [7] A. Idris, M. A. H. Eltayeb, S. Potgieter-Vermaak, R. Van Grieken and J. Potgieter, “Assessment of Heavy Metals Pollution in Sudanese Harbors along the Red Sea Coast,” Microchemical Journal, Vol. 87, No. 2, 2007, pp.104-112. doi:10.1016/j.microc.2007.06.004 [8] S. Morin, T. Duong, A. Danbrin, A. Coynel, O. Herlory, M. Baudrimont, et al., “Long-Term Survey of Heavy- Metal Pollution, Biofilm Contamination and Diatom Community Structure in the Rio Mort Watershed, South- West France,” Environmental Pollution, Vol. 151, 2008, pp. 532-542. doi:10.1016/j.envpol.2007.04.023 [9] A.-P. Zhong, S.-H. Guo, F.-M. Li, G. Li and K.-X. Jiang, “Impact of Anions on the Heavy Metals Release from Ma- rine Sediments,” Journal of Environmental Sciences, Vol. 18, No. 6, 2006, pp. 1216-1220. doi:10.1016/S1001-0742(06)60065-X [10] C. Atkinson, D. Jolley and S. Simpson, “Effect of Over- lying Water pH, Dissolved Oxygen, Salinity and Sedi- ment Disturbances on Metal Release and Sequestration from Metal Contaminated Marine Sediments,” Chemos- phere, Vol. 69, No. 9, 2007 , pp. 1428-1437. doi:10.1016/j.chemosphere.2007.04.068 [11] P. Harikumar and T. Jisha, “Distribution Pattern of Trace Metal Pollutants in the Sediments of an Urban Wetland in the Southwest Coast of India,” International Journal of Engineering Science and Technology, Vol. 2, No. 5, 2010, pp. 840-850. [12] K. Mmolawa, A. Likuku and G. Gaboutloeloe, “Assess- ment of Heavy Metal Pollution in Soils along Roadside Areas in Botswana,” African Journal of Environmental Science and Technology, Vol. 5, No. 3, 2011, pp. 186- 196. [13] Y. Wang, Z. Yang, Z. Shen, Z. Tang, J. Niu and F. Gao, “Assessment of Heavy Metals in Sediments from a Typi- cal Catchment of the Yangtze River, China,” Environ- mental Monitoring and Assessment, Vol. 172, No. 1-4, 2011, pp. 407-417. [14] T. Kassim, H. Al-Saadi, A. Al-Lami and H. Al-Jaberi, “Heavy Metals in Water, Suspended Particles, Sediments and Aquatic Plants of the Upper Region of Euphrates River, Iraq,” Journal of Environmental Science and Health, Vol. 32, No. 9-10, 1997, pp. 2497-2506. doi:10.1080/10934529709376698 [15] A. Rabee, Y. Al-Fatlawy and A. Abd Own, “Seasonal Variation and Assessment of Heavy Metal Pollution in Sediments from Selected Stations in Tigris and Euphrates Rivers, Central Iraq,” Iraqi Journal of Science, Vol. 50, No. 4, 2009, pp. 466-475. [16] F. Hassan, M. Saleh and J. Salman, “A Study of Phys- icochemical Parameters and Nine Heavy Metals in the Euphrates River, Iraq,” E-Journal of Chemistry, Vol. 7, No. 3, 2010, pp. 685-692. doi:10.1155/2010/906837 [17] CCME, “Canadian Water Quality Guidelines for Protec- tion of Aquatic Life,” Technical Report, Canadian Envi- ronmental Quality Guidelines, Canadian Water Quality Index 1.0, 1999. [18] S. Valeria, C. Smith and A. Donovan, “Microwave Diges- tion for Sediment, Soil and Urban Particulate Matter for Trace Metal Analysis,” Talanta, Vol. 60, No. 4, 2003, pp. 715-723. doi:10.1016/S0039-9140(03)00131-0 [19] H. Feng, X. Han, W. G. Zhang and L. Z. Yu, “A Prelimi- nary Study of Heavy Metal Contamination in Yangtze River Intertidal Zone Due to Urbanization,” Marine Pollu- tion Bulletin, Vol. 49, No. 11-12, 2004, pp. 910-915. doi:10.1016/j.marpolbul.2004.06.014 [20] I. Cato, “Recent Sedimentological and Geochemical Con- ditions and Pollution Problems in Two Marine Areas in Southwestern Sweden,” Striae, Vol. 6, 1977, pp. 1-150. [21] K. Choi, S. Kim, G. Hong and H. Chon, “Distribution of Heavy Metals in the Sediments of South Korean Har- bors,” Environmental Geochemical Health, Vol. 34, No. 1, 2012, pp. 71-82. doi:10.1007/s10653-011-9413-3 [22] S. Sinex and G. Helz, “Regional Geochemistry of Trace Elements in Chesapeak Bay Sediments,” Environmental Geology, Vol. 3, No. 6, 1981, pp. 315-323. doi:10.1007/BF02473521 [23] J. Martin and M. Meybeck, “Elemental Mass-Balance of Material Carried by Major World Rivers,” Marine Chem- istry, Vol. 7, No. 3, 1979, pp. 178-206. doi:10.1016/0304-4203(79)90039-2 [24] V. Tippie, “An Environmental Characterization of Chesa- peak Bay and a Framework for Action,” In: V. Kennedy, Ed., The Estuary as a Filter, Academic Press, New York, 1984, pp. 467-487. [25] D. Tomlinson, J. Wilson, C. Harris and D. Jeffrey, “Pro- blems in the Assessment of Heavy-Metal Levels in Estu- aries and the Formation of a Pollution Index,” Helgoland Marine Research, Vol. 33, No. 1-4, 1980, pp. 566-575. [26] G. Muller, “Index of Geoaccumulation in Sediments of the Rhine River,” GeoJournal, Vol. 2, No. 3, 1969, pp. 108-118. [27] G. Muller, “The Heavy Metal Pollution of the Sediments of Neckars and Its Tributary,” A Stocktaking Chemische Zeit, Vol. 150, 1981, pp. 157-164. [28] Z. G. Ya, L. F. Zhou, Z. Y. Bao, P. Gao and X. W. Sun, “High Efficiency of Heavy Metal Removal in Mine Water by Limestone,” Chinese Journal of Geochemistry, Vol. Copyright © 2012 SciRes. JWARP  E. A. M. SALAH ET AL. Copyright © 2012 SciRes. JWARP 1023 28, No. 3, 2007, pp. 293-298. doi:10.1007/s11631-009-0293-5 [29] K. Al-Bassam and L. Al-Mukhtar, “Heavy Minerals in the Sediments of the Euphrates River, in Iraq,” Iraqi Journal of Geology and Mining, Vol. 4, 2008, pp. 29-41. [30] K. Al-Bassam, “Environmental Factors Influencing Spa- tial Distribution of Cadmium in the Euphrates River Sediments in Iraq,” Iraqi Journal of Geology and Mining, Vol. 7, 2011, pp. 29-41. [31] L. Hakanson, “An Ecological Risk Index for Aquatic Pollution Control a Sedimentological Approaches,” Wa- ter Research, Vol. 14, No. 8, 1980, pp. 975-1001. doi:10.1016/0043-1354(80)90143-8 [32] WHO, “Guidelines for Drinking Water Quality,” 3rd Edition, World Health Organization, 2004, p. 515. [33] USEPA, “US Environmental Protection Agency: Screen- ing Level Ecological Risk Assessment Protocol for Haz- ardous Waste Combustion facilities,” Appendix E: Toxicity Reference Values, Vol. 3, 1999. [34] A. Al-Juboury, “Natural Pollution by Some Heavy Metals in the Tigris River, Northern Iraq,” International Journal of Environmental Researc h, Vol. 31, No. 2, 2009, pp. 189- 198. [35] A. Al-Lami and H. Al-Jaberi, “Heavy Metals in Water, Suspended Particles and Sediment of the Upper-Mid Re- gion of Tigris River, Iraq,” Proceedings of International Symposium on Environmental Pollution Control and Waste Management, Tunis, 7-10 January 2002, pp. 97- 102. [36] M. Nameer, A. Rabee, A. Abd Own and Y. Al-Fatlawy, “Using Pollution Load Index (PLI) and Geoaccumulation Index (Igeo) for Assessment of Heavy Metals Pollution in Tigris River Sediments in Baghdad Region,” Journal of Al-Nahrain University-Science, Vol. 14, No. 4, 2011, pp. 108-114. [37] R. Marathe, Y. Marathe, C. Sawant and V. Shrivastava, “Detection of Trace Metals in Surface Sediment of Tapti River: A Case Study,” Archives of Applied Science Re- search, Vol. 3, No. 2, 2011, pp.472-476. [38] P. Saha and M. Hossain, “Assessment of Heavy Metal Concentration and Sediment Quality in the Buriganga River, Bangladesh,” Internationa Proceedings of Chemi- cal, Biological and Environmental Engineering, Singa- pore City, 26-28 February 2010, pp. VI-384 -VI-387.
|