Journal of Minerals and Materials Characterization and Engineering, 2012, 11, 1081-1084
Published Online November 2012 (http://www.SciRP.org/journal/jmmce)
TL Glow Curve Study, Kinetics, PL and XRD Analysis of
Mn2+ Doped CaAl2O4 Phosphors
Jagjeet Kaur, Nemana Subramanyam Suryanarayana, Beena Jaykumar*, Vikas Dubey,
Ravi Shrivastava, Huma Nazli Baig
Department of Physics, Vishwanath Yadav Tamaskar Post Graduate Autonomous College, Durg, India
Email: *beenajaykumar@gmail.com
Received July 16, 2012; revised August 20, 2012; accepted August 29, 2012
ABSTRACT
The present paper reports Thermoluminescence (TL) Glow curve of Mn2+ doped CaAl2O4 phosphor with different UV
exposure time. The Glow peak shows general order kinetics and evaluation of kinetic parameters was done by peak
shape method. Calculations of Trap Depth were done with Chen’s different methods and order of kinetics, activation
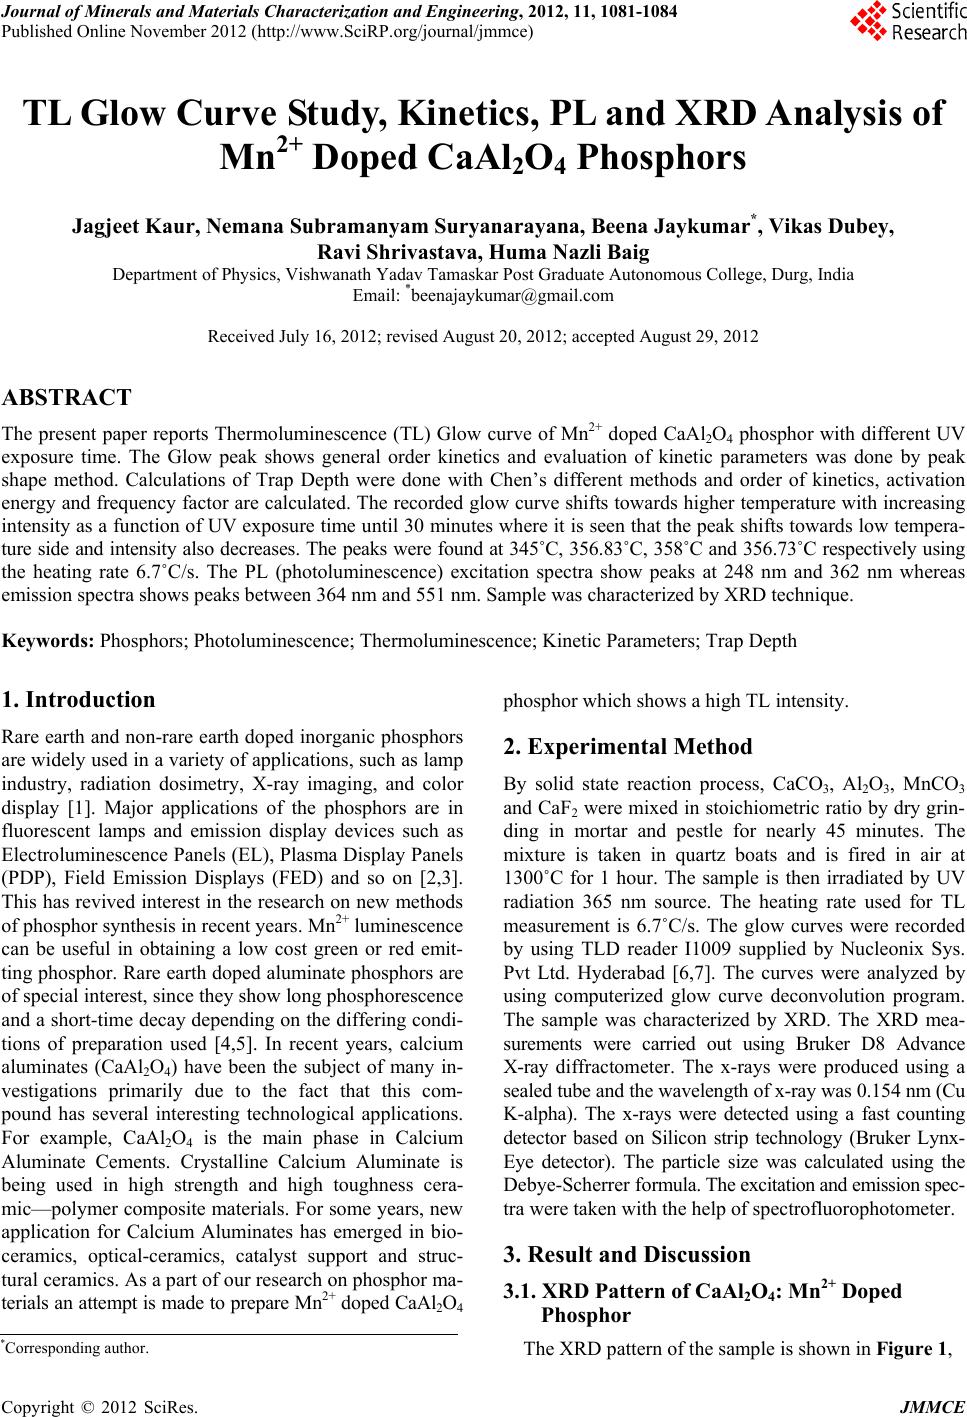
energy and frequency factor are calculated. The recorded glow curve shifts towards higher temperature with increasing
intensity as a function of UV exposure time until 30 minutes where it is seen that the peak shifts towards low tempera-
ture side and intensity also decreases. The peaks were found at 345˚C, 356.83˚C, 358˚C and 356.73˚C respectively using
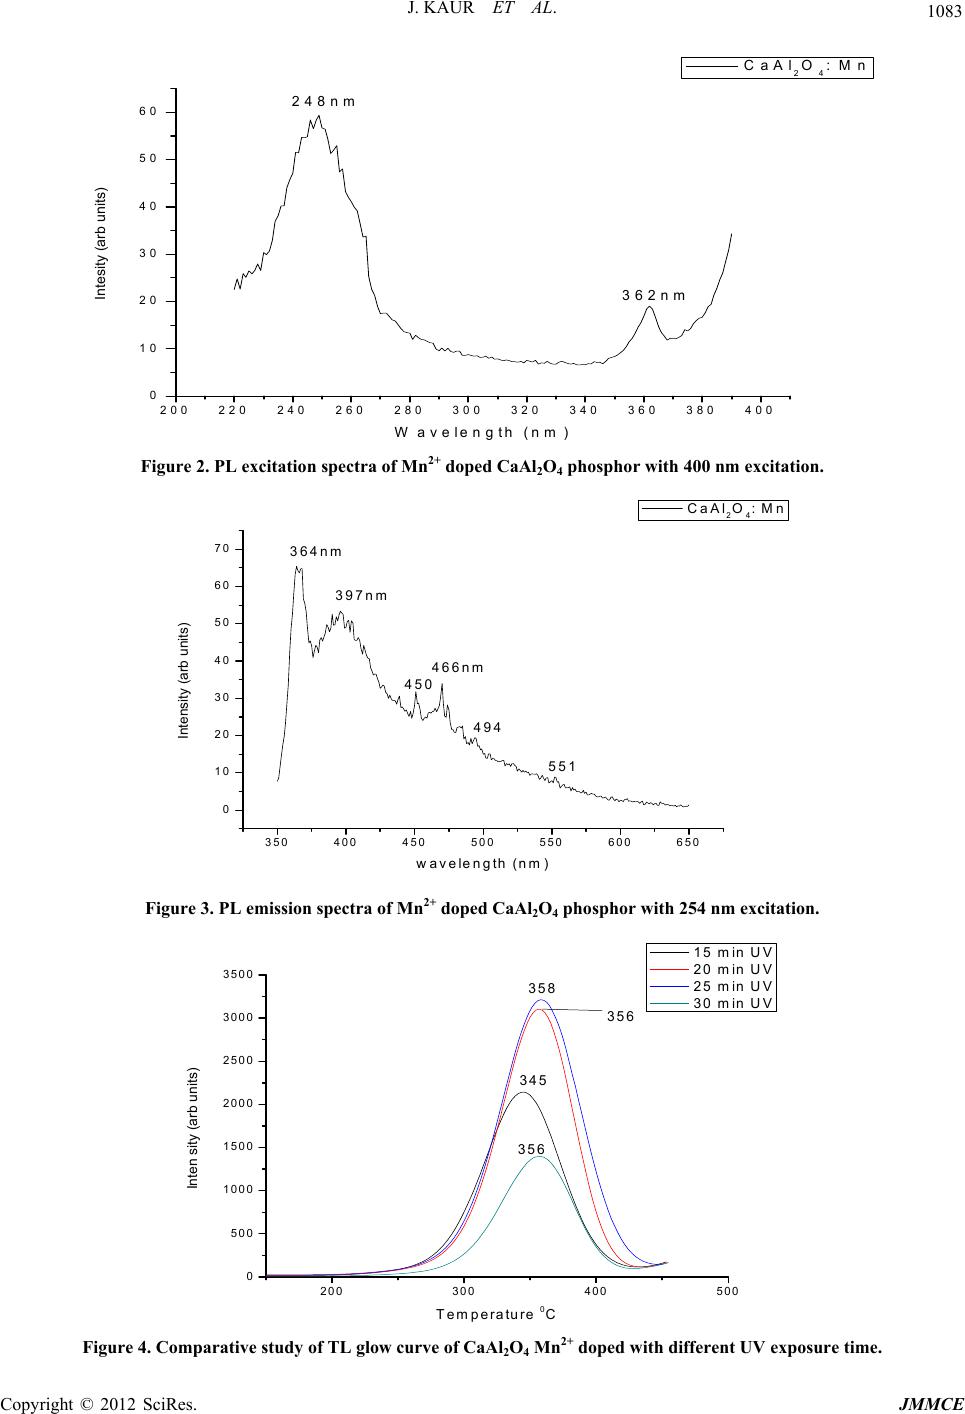
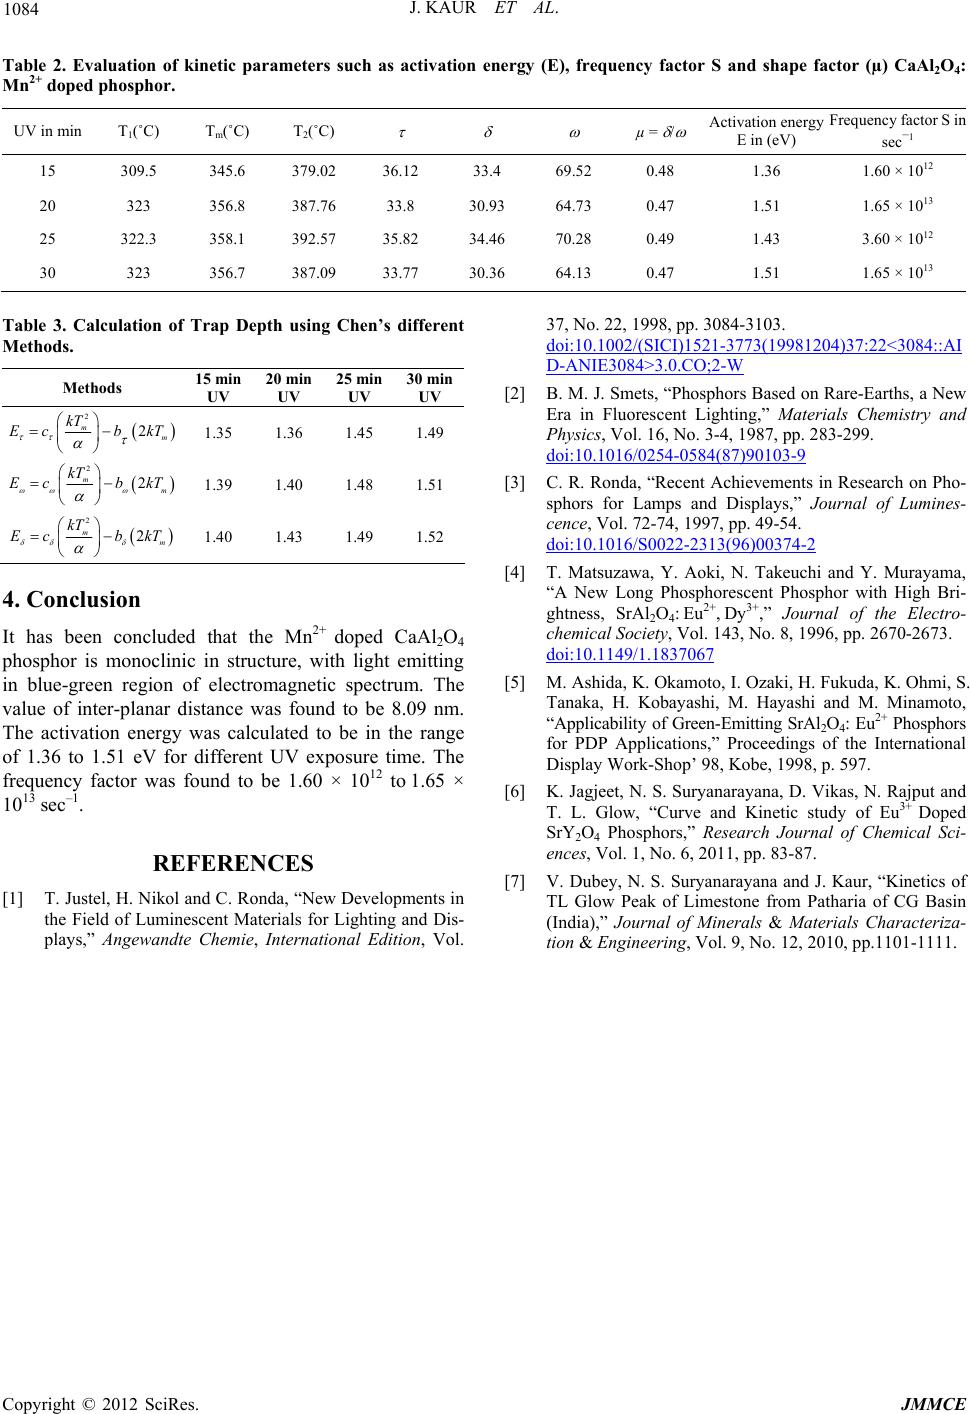
the heating rate 6.7˚C/s. The PL (photoluminescence) excitation spectra show peaks at 248 nm and 362 nm whereas
emission spectra shows peaks between 364 nm and 551 nm. Sample was characterized by XRD technique.
Keywords: Phosphors; Photoluminescence; Thermoluminescence; Kinetic Parameters; Trap Depth
1. Introduction
Rare earth and non-rare earth doped inorganic phosphors
are widely used in a variety of applications, such as lamp
industry, radiation dosimetry, X-ray imaging, and color
display [1]. Major applications of the phosphors are in
fluorescent lamps and emission display devices such as
Electroluminescence Panels (EL), Plasma Display Panels
(PDP), Field Emission Displays (FED) and so on [2,3].
This has revived interest in the research on new methods
of phosphor synthesis in recent years. Mn2+ luminescence
can be useful in obtaining a low cost green or red emit-
ting phosphor. Rare earth doped aluminate phosphors are
of special interest, since they show long phosphorescence
and a short-time decay depending on the differing condi-
tions of preparation used [4,5]. In recent years, calcium
aluminates (CaAl2O4) have been the subject of many in-
vestigations primarily due to the fact that this com-
pound has several interesting technological applications.
For example, CaAl2O4 is the main phase in Calcium
Aluminate Cements. Crystalline Calcium Aluminate is
being used in high strength and high toughness cera-
mic—polymer composite materials. For some years, new
application for Calcium Aluminates has emerged in bio-
ceramics, optical-ceramics, catalyst support and struc-
tural ceramics. As a part of our research on phosphor ma-
terials an attempt is made to prepare Mn2+ doped CaAl2O4
phosphor which shows a high TL intensity.
2. Experimental Method
By solid state reaction process, CaCO3, Al2O3, MnCO3
and CaF2 were mixed in stoichiometric ratio by dry grin-
ding in mortar and pestle for nearly 45 minutes. The
mixture is taken in quartz boats and is fired in air at
1300˚C for 1 hour. The sample is then irradiated by UV
radiation 365 nm source. The heating rate used for TL
measurement is 6.7˚C/s. The glow curves were recorded
by using TLD reader I1009 supplied by Nucleonix Sys.
Pvt Ltd. Hyderabad [6,7]. The curves were analyzed by
using computerized glow curve deconvolution program.
The sample was characterized by XRD. The XRD mea-
surements were carried out using Bruker D8 Advance
X-ray diffractometer. The x-rays were produced using a
sealed tube and the wavelength of x-ray was 0.154 nm (Cu
K-alpha). The x-rays were detected using a fast counting
detector based on Silicon strip technology (Bruker Lynx-
Eye detector). The particle size was calculated using the
Debye-Scherrer formula. The excitation and emission spec-
tra were taken with the help of spectrofluorophotometer.
3. Result and Discussion
3.1. XRD Pattern of CaAl2O4: Mn2+ Doped
Phosphor
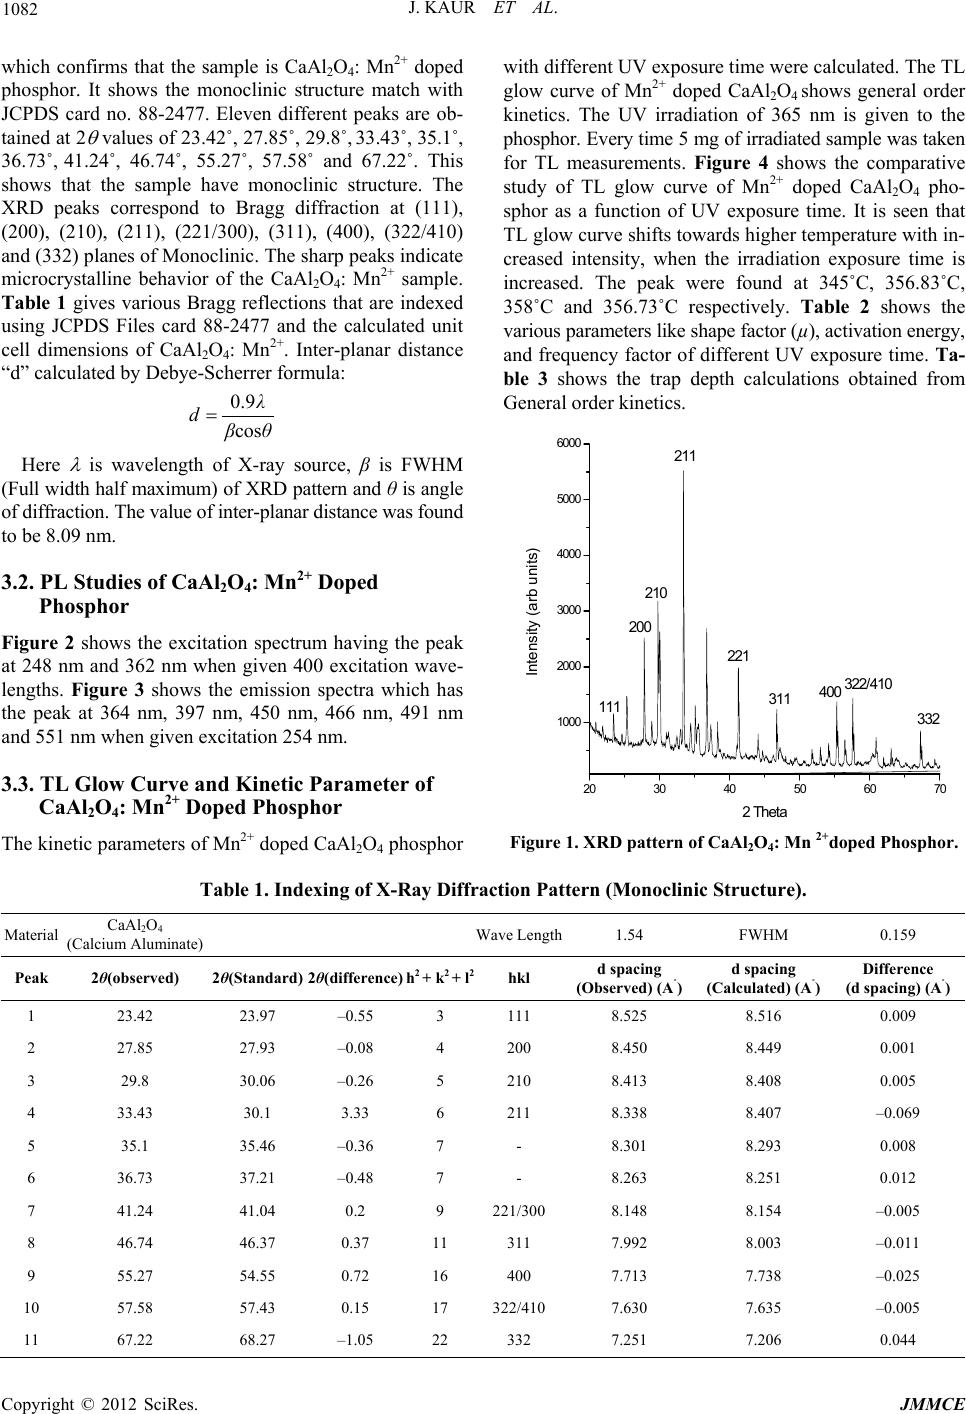
*Corresponding author. The XRD pattern of the sample is shown in Fi gure 1,
Copyright © 2012 SciRes. JMMCE
J. KAUR ET AL.
1082
which confirms that the sample is CaAl2O4: Mn2+ doped
phosphor. It shows the monoclinic structure match with
JCPDS card no. 88-2477. Eleven different peaks are ob-
tained at 2
values of 23.42˚, 27.85˚, 29.8˚, 33.43˚, 35.1˚,
36.73˚, 41.24˚, 46.74˚, 55.27˚, 57.58˚ and 67.22˚. This
shows that the sample have monoclinic structure. The
XRD peaks correspond to Bragg diffraction at (111),
(200), (210), (211), (221/300), (311), (400), (322/410)
and (332) planes of Monoclinic. The sharp peaks indicate
microcrystalline behavior of the CaAl2O4: Mn2+ sample.
Table 1 gives various Bragg reflections that are indexed
using JCPDS Files card 88-2477 and the calculated unit
cell dimensions of CaAl2O4: Mn2+. Inter-planar distance
“d” calculated by Debye-Scherrer formula:
0.9
cos
λ
dβθ
Here
is wavelength of X-ray source, β is FWHM
(Full width half maximum) of XRD pattern and θ is angle
of diffraction. The value of inter-planar distance was found
to be 8.09 nm.
3.2. PL Studies of CaAl2O4: Mn2+ Doped
Phosphor
Figure 2 shows the excitation spectrum having the peak
at 248 nm and 362 nm when given 400 excitation wave-
lengths. Figure 3 shows the emission spectra which has
the peak at 364 nm, 397 nm, 450 nm, 466 nm, 491 nm
and 551 nm when given excitation 254 nm.
3.3. TL Glow Curve and Kinetic Parameter of
CaAl2O4: Mn2+ Doped Phosphor
The kinetic parameters of Mn2+ doped CaAl2O4 phosphor
with different UV exposure time were calculated. The TL
glow curve of Mn2+ doped CaAl2O4 shows general order
kinetics. The UV irradiation of 365 nm is given to the
phosphor. Every time 5 mg of irradiated sample was taken
for TL measurements. Figure 4 shows the comparative
study of TL glow curve of Mn2+ doped CaAl2O4 pho-
sphor as a function of UV exposure time. It is seen that
TL glow curve shifts towards higher temperature with in-
creased intensity, when the irradiation exposure time is
increased. The peak were found at 345˚C, 356.83˚C,
358˚C and 356.73˚C respectively. Table 2 shows the
various parameters like shape factor (µ), activation energy,
and frequency factor of different UV exposure time. Ta-
ble 3 shows the trap depth calculations obtained from
General order kinetics.
20 30 40 50 60 70
1000
2000
3000
4000
5000
6000
Intensity (arb units)
2 Theta
111
200
210
211
221
311 400 322/410
332
Figure 1. XRD pattern of CaAl2O4: Mn 2+doped Phosphor.
Table 1. Indexing of X-Ray Diffraction Pattern (Monoclinic Structure).
Material CaAl2O4
(Calcium Aluminate) Wave Length1.54 FWHM 0.159
Peak 2θ(observed) 2θ(Standard) 2θ(difference) h2 + k2 + l2hkl d spacing
(Observed) (A˚)d spacing
(Calculated) (A˚) Difference
(d spacing) (A ˚)
1 23.42 23.97 –0.55 3 111 8.525 8.516 0.009
2 27.85 27.93 –0.08 4 200 8.450 8.449 0.001
3 29.8 30.06 –0.26 5 210 8.413 8.408 0.005
4 33.43 30.1 3.33 6 211 8.338 8.407 –0.069
5 35.1 35.46 –0.36 7 - 8.301 8.293 0.008
6 36.73 37.21 –0.48 7 - 8.263 8.251 0.012
7 41.24 41.04 0.2 9 221/300 8.148 8.154 –0.005
8 46.74 46.37 0.37 11 311 7.992 8.003 –0.011
9 55.27 54.55 0.72 16 400 7.713 7.738 –0.025
10 57.58 57.43 0.15 17 322/410 7.630 7.635 –0.005
11 67.22 68.27 –1.05 22 332 7.251 7.206 0.044
Copyright © 2012 SciRes. JMMCE
J. KAUR ET AL. 1083
200 220 240 260 280 300 320 340 360 380400
0
10
20
30
40
50
60
Intesity (arb units)
Wavelength (nm)
CaAl
2O4: Mn
248nm
362nm
Figure 2. PL excitation spectra of Mn2+ doped CaAl2O4 phosphor with 400 nm excitation.
350 400 450 500 550 600 650
0
10
20
30
40
50
60
70
Intensit y (a rb unit s )
wa v e le n g th (n m)
CaAl2O4: Mn
364nm
397nm
466nm
450
551
494
Figure 3. PL emission spectra of Mn2+ doped CaAl2O4 phosphor with 254 nm excitation.
200 300 400 500
0
500
1000
1500
2000
2500
3000
3500
Inten sity (arb units)
Tem perature 0C
15 m in UV
20 m in UV
25 m in UV
30 m in UV
358
356
345
356
Figure 4. Comparative study of TL glow curve of CaAl2O4 Mn2+ doped with different UV exposure time.
Copyright © 2012 SciRes. JMMCE
J. KAUR ET AL.
Copyright © 2012 SciRes. JMMCE
1084
Table 2. Evaluation of kinetic parameters such as activation energy (E), frequency factor S and shape factor (µ) CaAl2O4:
Mn2+ doped phosphor.
UV in min T1(˚C) Tm(˚C) T2(˚C)
µ =
/
Activation energy
E in (eV)
Frequency factor S in
sec1
15 309.5 345.6 379.02 36.12 33.4 69.52 0.48 1.36 1.60 × 10¹²
20 323 356.8 387.76 33.8 30.93 64.73 0.47 1.51 1.65 × 10¹³
25 322.3 358.1 392.57 35.82 34.46 70.28 0.49 1.43 3.60 × 10¹²
30 323 356.7 387.09 33.77 30.36 64.13 0.47 1.51 1.65 × 10¹³
Table 3. Calculation of Trap Depth using Chen’s different
Methods.
Methods 15 min
UV 20 min
UV 25 min
UV 30 min
UV
2
2
m
m
kT
Ecb kT





1.35 1.36 1.45 1.49
2
2
m
m
kT
Ec bkT
 




1.39 1.40 1.48 1.51

2
2
m
m
kT
Ec bkT
 



 1.40 1.43 1.49 1.52
4. Conclusion
It has been concluded that the Mn2+ doped CaAl2O4
phosphor is monoclinic in structure, with light emitting
in blue-green region of electromagnetic spectrum. The
value of inter-planar distance was found to be 8.09 nm.
The activation energy was calculated to be in the range
of 1.36 to 1.51 eV for different UV exposure time. The
frequency factor was found to be 1.60 × 10¹² to 1.65 ×
1013 sec–1.
REFERENCES
[1] T. Justel, H. Nikol and C. Ronda, “New Developments in
the Field of Luminescent Materials for Lighting and Dis-
plays,” Angewandte Chemie, International Edition, Vol.
37, No. 22, 1998, pp. 3084-3103.
doi:10.1002/(SICI)1521-3773(19981204)37:22<3084::AI
D-ANIE3084>3.0.CO;2-W
[2] B. M. J. Smets, “Phosphors Based on Rare-Earths, a New
Era in Fluorescent Lighting,” Materials Chemistry and
Physics, Vol. 16, No. 3-4, 1987, pp. 283-299.
doi:10.1016/0254-0584(87)90103-9
[3] C. R. Ronda, “Recent Achievements in Research on Pho-
sphors for Lamps and Displays,” Journal of Lumines-
cence, Vol. 72-74, 1997, pp. 49-54.
doi:10.1016/S0022-2313(96)00374-2
[4] T. Matsuzawa, Y. Aoki, N. Takeuchi and Y. Murayama,
“A New Long Phosphorescent Phosphor with High Bri-
ghtness, SrAl2O4:Eu2+,Dy3+,” Journal of the Electro-
chemical Society, Vol. 143, No. 8, 1996, pp. 2670-2673.
doi:10.1149/1.1837067
[5] M. Ashida, K. Okamoto, I. Ozaki, H. Fukuda, K. Ohmi, S.
Tanaka, H. Kobayashi, M. Hayashi and M. Minamoto,
“Applicability of Green-Emitting SrAl2O4: Eu2+ Phosphors
for PDP Applications,” Proceedings of the International
Display Work-Shop’ 98, Kobe, 1998, p. 597.
[6] K. Jagjeet, N. S. Suryanarayana, D. Vikas, N. Rajput and
T. L. Glow, “Curve and Kinetic study of Eu3+ Doped
SrY2O4 Phosphors,” Research Journal of Chemical Sci-
ences, Vol. 1, No. 6, 2011, pp. 83-87.
[7] V. Dubey, N. S. Suryanarayana and J. Kaur, “Kinetics of
TL Glow Peak of Limestone from Patharia of CG Basin
(India),” Journal of Minerals & Materials Characteriza-
tion & Engineering, Vol. 9, No. 12, 2010, pp.1101-1111.