Paper Menu >>
Journal Menu >>
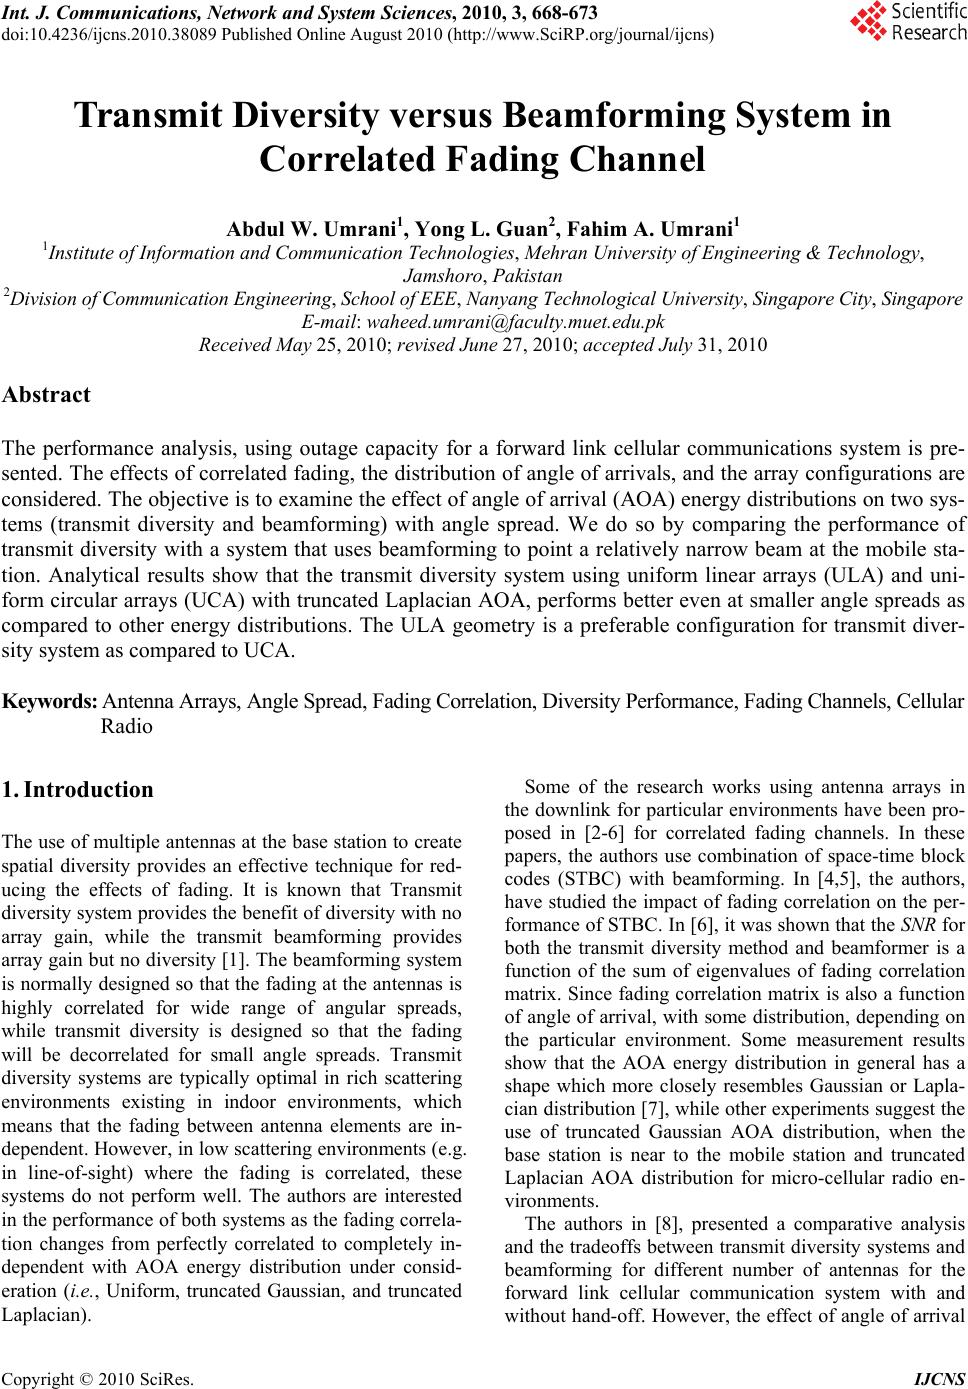 Int. J. Communications, Network and System Sciences, 2010, 3, 668-673 doi:10.4236/ijcns.2010.38089 Published Online August 2010 (http://www.SciRP.org/journal/ijcns) Copyright © 2010 SciRes. IJCNS Transmit Diversity versus Beamforming System in Correlated Fading Channel Abdul W. Umrani1, Yong L. Guan2, Fahim A. Umrani1 1Institute of Information and Communication Technologies, Mehran University of Engineering & Technology, Jamshoro, Pakistan 2Division of Communication Engineering, School of EEE, Nanyang Technological University, Singapore City, Singapore E-mail: waheed.umrani@faculty.muet.edu.pk Received May 25, 2010; revised June 27, 2010; accepted July 31, 2010 Abstract The performance analysis, using outage capacity for a forward link cellular communications system is pre- sented. The effects of correlated fading, the distribution of angle of arrivals, and the array configurations are considered. The objective is to examine the effect of angle of arrival (AOA) energy distributions on two sys- tems (transmit diversity and beamforming) with angle spread. We do so by comparing the performance of transmit diversity with a system that uses beamforming to point a relatively narrow beam at the mobile sta- tion. Analytical results show that the transmit diversity system using uniform linear arrays (ULA) and uni- form circular arrays (UCA) with truncated Laplacian AOA, performs better even at smaller angle spreads as compared to other energy distributions. The ULA geometry is a preferable configuration for transmit diver- sity system as compared to UCA. Keywords: Antenna Arrays, Angle Spread, Fading Correlation, Diversity Performance, Fading Channels, Cellular Radio 1. Introduction The use of multiple antennas at the base station to create spatial diversity provides an effective technique for red- ucing the effects of fading. It is known that Transmit diversity system provides the benefit of diversity with no array gain, while the transmit beamforming provides array gain but no diversity [1]. The beamforming system is normally designed so that the fading at the antennas is highly correlated for wide range of angular spreads, while transmit diversity is designed so that the fading will be decorrelated for small angle spreads. Transmit diversity systems are typically optimal in rich scattering environments existing in indoor environments, which means that the fading between antenna elements are in- dependent. However, in low scattering environments (e.g. in line-of-sight) where the fading is correlated, these systems do not perform well. The authors are interested in the performance of both systems as the fading correla- tion changes from perfectly correlated to completely in- dependent with AOA energy distribution under consid- eration (i.e., Uniform, truncated Gaussian, and truncated Laplacian). Some of the research works using antenna arrays in the downlink for particular environments have been pro- posed in [2-6] for correlated fading channels. In these papers, the authors use combination of space-time block codes (STBC) with beamforming. In [4,5], the authors, have studied the impact of fading correlation on the per- formance of STBC. In [6], it was shown that the SNR for both the transmit diversity method and beamformer is a function of the sum of eigenvalues of fading correlation matrix. Since fading correlation matrix is also a function of angle of arrival, with some distribution, depending on the particular environment. Some measurement results show that the AOA energy distribution in general has a shape which more closely resembles Gaussian or Lapla- cian distribution [7], while other experiments suggest the use of truncated Gaussian AOA distribution, when the base station is near to the mobile station and truncated Laplacian AOA distribution for micro-cellular radio en- vironments. The authors in [8], presented a comparative analysis and the tradeoffs between transmit diversity systems and beamforming for different number of antennas for the forward link cellular communication system with and without hand-off. However, the effect of angle of arrival 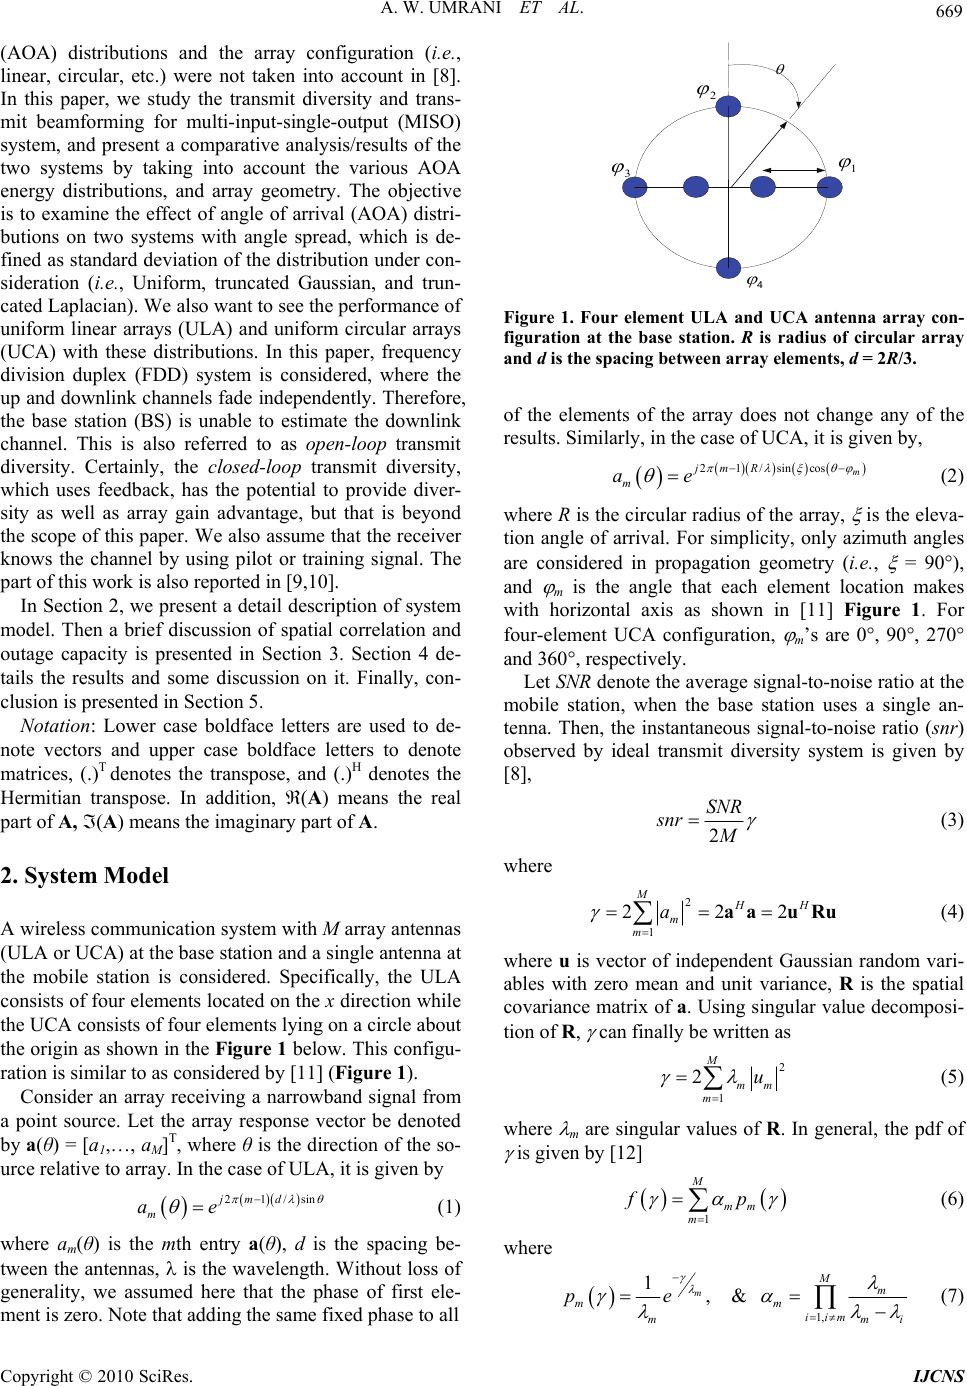 A. W. UMRANI ET AL. 669 (AOA) distributions and the array configuration (i.e., linear, circular, etc.) were not taken into account in [8]. In this paper, we study the transmit diversity and trans- mit beamforming for multi-input-single-output (MISO) system, and present a comparative analysis/results of the two systems by taking into account the various AOA energy distributions, and array geometry. The objective is to examine the effect of angle of arrival (AOA) distri- butions on two systems with angle spread, which is de- fined as standard deviation of the distribution under con- sideration (i.e., Uniform, truncated Gaussian, and trun- cated Laplacian). We also want to see the performance of uniform linear arrays (ULA) and uniform circular arrays (UCA) with these distributions. In this paper, frequency division duplex (FDD) system is considered, where the up and downlink channels fade independently. Therefore, the base station (BS) is unable to estimate the downlink channel. This is also referred to as open-loop transmit diversity. Certainly, the closed-loop transmit diversity, which uses feedback, has the potential to provide diver- sity as well as array gain advantage, but that is beyond the scope of this paper. We also assume that the receiver knows the channel by using pilot or training signal. The part of this work is also reported in [9,10]. In Section 2, we present a detail description of system model. Then a brief discussion of spatial correlation and outage capacity is presented in Section 3. Section 4 de- tails the results and some discussion on it. Finally, con- clusion is presented in Section 5. Notation: Lower case boldface letters are used to de- note vectors and upper case boldface letters to denote matrices, (.)T denotes the transpose, and (.)H denotes the Hermitian transpose. In addition, (A) means the real part of A, (A) means the imaginary part of A. 2. System Model A wireless communication system with M array antennas (ULA or UCA) at the base station and a single antenna at the mobile station is considered. Specifically, the ULA consists of four elements located on the x direction while the UCA consists of four elements lying on a circle about the origin as shown in the Figure 1 below. This configu- ration is similar to as considered by [11] (Figure 1). Consider an array receiving a narrowband signal from a point source. Let the array response vector be denoted by a(θ) = [a1,…, aM]T, where θ is the direction of the so- urce relative to array. In the case of ULA, it is given by 21/sinjmd m ae (1) where am(θ) is the mth entry a(θ), d is the spacing be- tween the antennas, is the wavelength. Without loss of generality, we assumed here that the phase of first ele- ment is zero. Note that adding the same fixed phase to all 1 2 3 4 Figure 1. Four element ULA and UCA antenna array con- figuration at the base station. R is radius of circular array and d is the spacing between array elements, d = 2R/3. of the elements of the array does not change any of the results. Similarly, in the case of UCA, it is given by, 21/sincos m jmR m ae (2) where R is the circular radius of the array, is the eleva- tion angle of arrival. For simplicity, only azimuth angles are considered in propagation geometry (i.e., = 90), and m is the angle that each element location makes with horizontal axis as shown in [11] Figure 1. For four-element UCA configuration, m’s are 0, 90, 270 and 360, respectively. Let SNR denote the average signal-to-noise ratio at the mobile station, when the base station uses a single an- tenna. Then, the instantaneous signal-to-noise ratio (snr) observed by ideal transmit diversity system is given by [8], 2 SNR snr M (3) where 2 1 222 MHH m m a aa uRu (4) where u is vector of independent Gaussian random vari- ables with zero mean and unit variance, R is the spatial covariance matrix of a. Using singular value decomposi- tion of R, can finally be written as 2 1 2 M mm m u (5) where m are singular values of R. In general, the pdf of is given by [12] 1 M mm m fp (6) where 1, 1,& m M m mm iim mm pe i (7) Copyright © 2010 SciRes. IJCNS 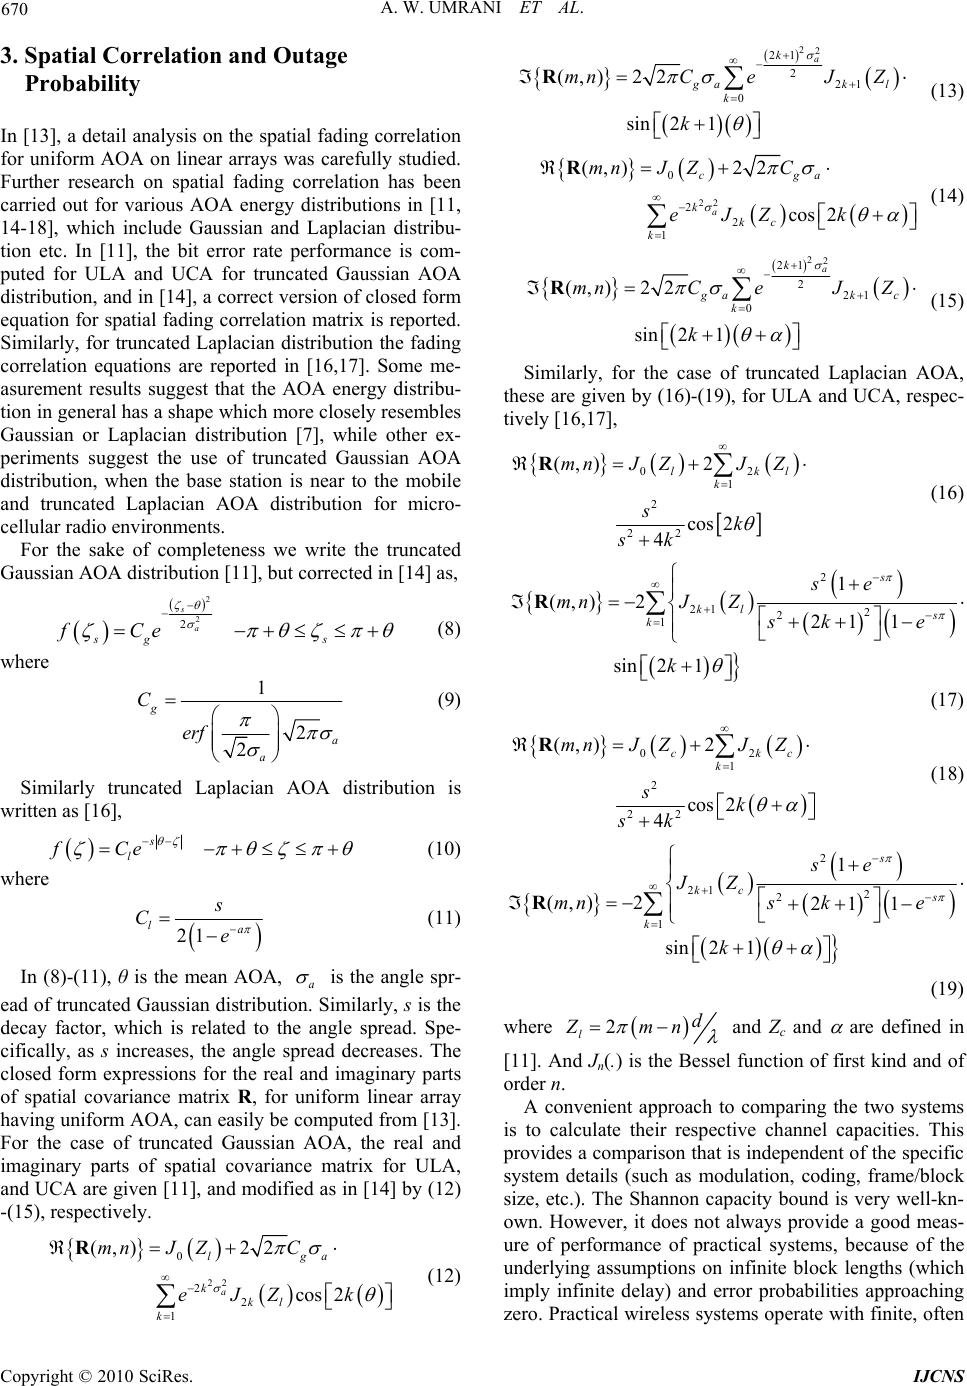 670 A. W. UMRANI ET AL. 3. Spatial Correlation and Outage Probability In [13], a detail analysis on the spatial fading correlation for uniform AOA on linear arrays was carefully studied. Further research on spatial fading correlation has been carried out for various AOA energy distributions in [11, 14-18], which include Gaussian and Laplacian distribu- tion etc. In [11], the bit error rate performance is com- puted for ULA and UCA for truncated Gaussian AOA distribution, and in [14], a correct version of closed form equation for spatial fading correlation matrix is reported. Similarly, for truncated Laplacian distribution the fading correlation equations are reported in [16,17]. Some me- asurement results suggest that the AOA energy distribu- tion in general has a shape which more closely resembles Gaussian or Laplacian distribution [7], while other ex- periments suggest the use of truncated Gaussian AOA distribution, when the base station is near to the mobile and truncated Laplacian AOA distribution for micro- cellular radio environments. For the sake of completeness we write the truncated Gaussian AOA distribution [11], but corrected in [14] as, 2 2 2 s a sg s fCe (8) where 1 2 2 g a a C erf (9) Similarly truncated Laplacian AOA distribution is written as [16], s l fCe (10) where 21 la s Ce (11) In (8)-(11), θ is the mean AOA, a is the angle spr- ead of truncated Gaussian distribution. Similarly, s is the decay factor, which is related to the angle spread. Spe- cifically, as s increases, the angle spread decreases. The closed form expressions for the real and imaginary parts of spatial covariance matrix R, for uniform linear array having uniform AOA, can easily be computed from [13]. For the case of truncated Gaussian AOA, the real and imaginary parts of spatial covariance matrix for ULA, and UCA are given [11], and modified as in [14] by (12) -(15), respectively. 22 0 2 2 1 (,) 22 cos2 a lga k kl k mnJ ZC eJZk R (12) 22 21 2 21 0 (,) 22 sin21 a k gak l k mnCeJ Z k R (13) 22 0 2 2 1 (,) 22 cos2 a cga k kc k mnJ ZC eJZk R (14) 22 21 2 21 0 (,) 22 sin21 a k gak c k mnCeJ Z k R (15) Similarly, for the case of truncated Laplacian AOA, these are given by (16)-(19), for ULA and UCA, respec- tively [16,17], 02 1 2 22 (,) 2 cos2 4 lk k mnJ ZJZ sk sk l R (16) 2 21 2 2 1 1 (,) 2 21 1 sin21 s kl s k se mnJ Z sk e k R (17) 02 1 2 22 (,) 2 cos2 4 ck k mnJ ZJZ sk sk c R (18) 2 21 2 2 1 1 (,) 221 1 sin 21 s kc s k se JZ mn sk e k R (19) where 2 ld Zmn and Zc and are defined in [11]. And Jn(.) is the Bessel function of first kind and of order n. A convenient approach to comparing the two systems is to calculate their respective channel capacities. This provides a comparison that is independent of the specific system details (such as modulation, coding, frame/block size, etc.). The Shannon capacity bound is very well-kn- own. However, it does not always provide a good meas- ure of performance of practical systems, because of the underlying assumptions on infinite block lengths (which imply infinite delay) and error probabilities approaching zero. Practical wireless systems operate with finite, often Copyright © 2010 SciRes. IJCNS  A. W. UMRANI ET AL. 671 quite short, block lengths and are designed for small but non-vanishing error probabilities. Their performance, especially in the presence of correlated fading, is often worse than predicted by the Shannon bound. Outage capacity has been used by number of authors, for example in [8] and the references therein, in an atte- mpt to provide a more realistic characterization of per- formance of wireless communication systems than is provided by Shannon capacity. In these works, the cap- acity is treated as a random variable, being a function of randomly varying signal-to-noise ratio. They define the outage capacity Cout(p) with probability p. This capacity has the intuitive interpretation as the highest transmission rate that can be sustained with probability (1 – p). The random capacity of a transmit diversity system is given by, 2 log 12 SNR CM (20) The pdf f(C) of the capacity can be computed from the pdf of using standard random variable transformation and can be given by [8], 1 2log2 2 21 C C M M fC f SNR SNR (21) The outage capacity Cout(p) for probability p is given by out Cp p fCdC (22) For the case of a beamformer with weight vector W = [w1,…, w M], assumed to have unit-norm. The snr at the beamformer output is 2 2 1 M mm m s nrSNRxSNRwa (23) where x is a zero-mean complex Gaussian-random vari- able with variance g = WHRW, with R being covariance matrix of the channel response vector a. In the fully cor- related case, we can write (23), as 2 ;where, 2 2 SNR s nr Ma (24) where a is a complex Gaussian variable with zero-mean and unit variance. Therefore, the pdf of the capacity of the beamforming system is given by [8], 1 2log2 2 21 C C M fC f M SNR MSNR (25) 4. Simulation Results The notation in the following figures are given as, TD-U, TD-G, and TD-L which stands for transmit diversity sys- tem with uniform AOA, transmit diversity with truncated Gaussian AOA, and transmit diversity with truncated Laplacian AOA, respectively. In Figure 2, a comparison is shown at angle spread (σ = 3°). At 2% outage probability the performance of TD- U and BF (fully correlated case) is same as concluded by [8] (see Figure 8), but that is not the case with TD-G and TD-L as can be seen from Figure 2 [9,10]. A similar co- mparison is also plotted when the base station uses UCA. In this case, the performance of TD-U and BF (fully corr- elated case) is almost same, but inferior to the case when ULA used at the base station. It is clear from the Figure 2 and Figure 3 that the transmit diversity systems do not perform well at smaller angle spread, especially for trun- cated Gaussian AOA. 05 10 15 20 2530 10 -3 10 -2 10 -1 10 0 SNR (dB) Outage Probability =3 o BF-cor TD-uncor TD -G TD -U TD -L Figure 2. Outage probability for Transmit diversity and beamforming systems for ULA; mean AOA θ = 0°, σ = 3°, Cout(p) = 3, M = 4. 05 1015 20 25 30 10 -3 10 -2 10 -1 10 0 SNR (dB) Outage Probability = 3 o Bf-cor TD, Unco TD -G TD -U TD -L Figure 3. Outage probability for Transmit diversity and beamforming systems for UCA; mean AOA θ = 0°, σ = 3°, Cout(p) = 3, M = 4. Copyright © 2010 SciRes. IJCNS  672 A. W. UMRANI ET AL. To see the effect for wider range of angle spreads, the plot of probability distribution function (pdf) for several values of angle spread using (6), and (12)-(13) are shown in Figures 4 and 5 of [10], where it can be observed that, for a small angle spread of (σ = 1°), the TD-G curve tends to reach the χ2 2 distribution curve, while for mod- erate angle spread (σ = 7°), it tends to approach χ2 2M. This is due to reason that, in the case of uncorrelated fading R = I, λm = 1, in which case γ has a χ2 2M distribu- tion, while in the fully correlated case, R has rank one and λ1 = M, while λm = 0 for m > 1, in that case, γ/M has χ2 2 distribution as can be observed from Figure 5 of [10]. Figures 4 and 5, show the outage capacity curve as a function of SNR of transmit diversity system at p = 2%, for several values of angle spread. In Figure 4, a comp- arison for TD-U is given for ULA and UCA for two val- ues of angle spread. We can see that, base station with ULA configuration provides higher capacity than that of UCA. Specifically, at σ = 7° and C = 3 bits/s/Hz, UCA is 2 dB inferior to ULA. Similarly for TD-L and TD-G a co- mparison is also plotted in Figure 5, for ULA and UCA for σ = 7°. It can be noted that, TD-L provides higher capacity than the other two energy distributions. Figure 6, depicts a plot of spatial correlation as func- tion of antenna separation for ULA for two values of an- gle spread that is for σ = 3° and σ = 7°. Figure 6 also gives sufficient justification that the truncated Laplacian AOA energy distribution gives lower correlation as com- pared to other energy distributions. Figure 7, shows the outage capacity curve as a func- tion of SNR for TD-U for several values of central AOA at p = 2%, and σ = 3°. It can be seen from the Figure 7 that the central AOA can have significant impact on the performance. Specifically, at θ = 0° and 90° TD-U provi- des lower capacity values than other central AOA. Only UCA and uniform AOA energy distribution is considered. Similar conclusion can be made for other two energy dis- 05 10 1520 25 30 0 1 2 3 4 5 6 7 8 9 10 SNR (dB) Capac ity TD-U UCA, = 3 o UCA, = 7 o ULA, = 3 o ULA, = 7 o Figure 4. Outage capacity for Transmit diversity for ULA/ UCA with uniform AOA; θ = 0°, M = 4, p = 2%. tributions. Based on the above results, we can conclude that the transmit diversity system having ULA or UCA at the ba- se station with truncated Laplacian AOA, perform better than uniform and truncated Gaussian AOA, even at sma- ller angle spreads. We also show that ULA provide hi- gher capacity than UCA for transmit diversity systems. This conclusion is in consistent with the results reported in [19] for the indoor clustered channels for MIMO com- munications. 5. Conclusions In this paper, we presented a comparative analysis of tra- nsmit diversity system and transmit beamforming for the downlink of wireless communication system, using out- age capacity as performance measure. We examined the 0510 15 20 25 30 0 1 2 3 4 5 6 7 8 9 10 SNR (dB) Capaci t y = 3 o UCA, TD-G UCA, TD-L ULA, TD-G ULA, TD-L Figure 5. Outage capacity for Transmit diversity for ULA/ UCA; mean AOA θ = 0°, σ = 3°, M = 4, p = 2%. 00.5 11.5 22.5 33.5 44.5 5 0 0. 2 0. 4 0. 6 0. 8 1 Antenna seperation, D/ |R(1,2)| U- = 3 o G- = 3 o L- = 3 o U- = 7 o G- = 7 o L- = 7 o Figure 6. Spatial envelop correlation between antenna 1 and 2 for ULA; mean AOA θ = 0°, M = 4. Copyright © 2010 SciRes. IJCNS  A. W. UMRANI ET AL. Copyright © 2010 SciRes. IJCNS 673 [6] C. Rensburg and B. Friedlander, ‘Transmit Diversity for Arrays in Correlated Rayleigh Fading,” IEEE Transac- tions on Vehicular Technology, Vol. 53, No. 6, 2004, pp. 1726-1734. 05 10 15 20 2530 0 1 2 3 4 5 6 7 8 9 10 SNR (dB) Capaci ty TD- U, = 3 o = 0 o =22.5 o = 45 o = 67.5 o =90 o θ θ θ θ θ [7] K. I. Pedersen, P. E. Mogensen and B. H. Fleury, “Power Azimuth Spectrum in Outdoor Environments,” IEE Elec- tronics Letters, Vol. 33, No. 18, 1997, pp. 1583-1584. [8] B. Friedlander and S. Scherzer, “Beamforming versus Transmit Diversity in the Downlink of Cellular Commu- nication System,” IEEE Transactions on Vehicular Tech- nology, Vol. 53, No. 4, 2004, pp. 1023-1034. [9] A. W. Umrani and V. K. Dubey, “Effect of Angle of Ar- rival on Transmit Diversity and Beamforming Systems under Correlated Fading,” IEE Electronics Letters, Vol. 41, No. 6, 2005, pp. 293-294. [10] A. W. Umrani and V. K. Dubey, “Effect of Angle of Ar- rival on Transmit Diversity and Beamforming Systems under Correlated Fading,” IEEE Sarnoff Symposium on Advances in Wired and Wireless Communication, Prince- ton, 18-19 April 2005, pp. 109-112. Figure 7. Outage capacity for Transmit diversity for UCA with uniform AOA; σ = 3°, M = 4, p = 2%. [11] J.-A. Tsai, M. Buehrer and B. D. Woerner, “BER Perfor- mance of a Uniform Circular Array versus a Uniform Li- near Array in a Mobile Radio Environment,” IEEE Trans- actions on Wireless Communications, Vol. 3, No. 3, 2004, pp. 695-700. effect of angle of arrival (AOA) distributions, (i.e., uni- form, truncated Gaussian, and truncated Laplacian), on the two systems under correlated fading for several val- ues of angle spreads. We also examine the array config- uration, such as uniform linear array and uniform circular array for these systems. Numerical results show that the transmit diversity system using linear arrays or circular arrays do not perform well at small angle spreads. In the extreme case, where fading is completely correlated, the transmit diversity performs no better than a single ante- nna. Results also show that the transmit diversity system using arrays (ULA or UCA) with truncated Laplacian AOA, performs better even at smaller angle spreads as compared to other energy distributions. Further, ULA se- ems to be a preferable configuration to UCA for transmit diversity systems. [12] N. L. Johnson, S. Kotz and N. Balakrishnan, “Continuous Univariate Distributions,” Wiley Series, Hoboken, Vol. 1, 1994. [13] J. Salz and J. H. Winters, “Effect of Fading Correlation on Adaptive Arrays in a Digital Mobile Radio,” IEEE Transactions on Vehicular Technology, Vol. 43, No. 4, 1994, pp. 1049-1057. [14] A. W. Umrani and V. K. Dubey, “Correction to BER Per- formance of a Uniform Circular Array versus a Uniform Linear Array in a Mobile Radio Environment,” IEEE Transactions on Wireless Communications, Vol. 5, No. 4, 2006, p. 732. [15] J.-A. Tsai, M. Buehrer and B. D. Woerner, “The Impact of AOA Energy Distribution on Spatial Fading Correla- tion of Linear Antenna Arrays,” Proceedings of IEEE 55th Vehicular Technology Conference, Birmingham, Vol. 2, 6-9 May 2002, pp. 933-937. 6. References [1] J. H. Winters, “The Diversity Gain of Transmit Diversity Technique in Wireless Systems with Rayleigh Fading,” IEEE Transactions on Vehicular Technology, Vol. 47, No. 4, 1998, pp. 119-132. [16] J.-A. Tsai, M. Buehrer and B. D. Woerner, “Spatial Fad- ing Correlation Function of Circular Antenna Arrays with Laplacian Energy Distribution,” IEEE Communications Letters, Vol. 6, No. 5, 2002, pp. 178-180. [2] S. Zhou and G. B. Giannakis, “Optimal Transmitter Ei- gen-Beamforming and Space Time Block Coding Based on Channel Correlations,” IEEE Transactions on Infor- mation Theory, Vol. 49, No. 7, 2003, pp. 1673-1690. [17] X. Li and Z. P. Nei, “Comments on Spatial Fading Cor- relation of Circular Antenna Arrays Laplacian Energy Distribution,” IEEE Communications Letters, Vol. 8, No. 5, 2004, p. 295. [3] C. Chauah, D. Tse, J. Kahn and R. Valenzuala, “Capacity Scaling in MIMO Wireless Systems under Correlated Fading,” IEEE Transactions on Information Theory, Vol. 48, No. 3, 2002, pp. 637-650. [18] Y. Wang, Z. Zhou and J. Wang, “Analysis of Spatial Fading Correlation for Different Antenna Arrays,” Pro- ceedings of 2004 IEEE Wireless Communications and Net- working Conference, Atlanta, 21-25 March 2004, pp. 700- 705. [4] S. Siwamogsatham and M. P. Fitz, “Robust Space-Time Codes for Correlated Rayleigh Fading Channels,” IEEE Transactions on Signal Processing, Vol. 50, No. 10, 2002, pp. 2408-2416. [19] A. Forenza and R. W. Heath, Jr., “Impact of Antenna Geometry on MIMO Communication in Indoor Clustered Channels,” Proceedings of Antennas and Propagation Society International Symposium, Monterey, 20-26 June 2004, pp. 1700-1703. [5] E. A. Jorswieck and A. Sezgin, “Impact of Spatial Corre- lation on the Performance of Orthogonal Space-Time Block Codes,” IEEE Communications Letters, Vol. 8, No. 1, 2004, pp. 21-23. |