Paper Menu >>
Journal Menu >>
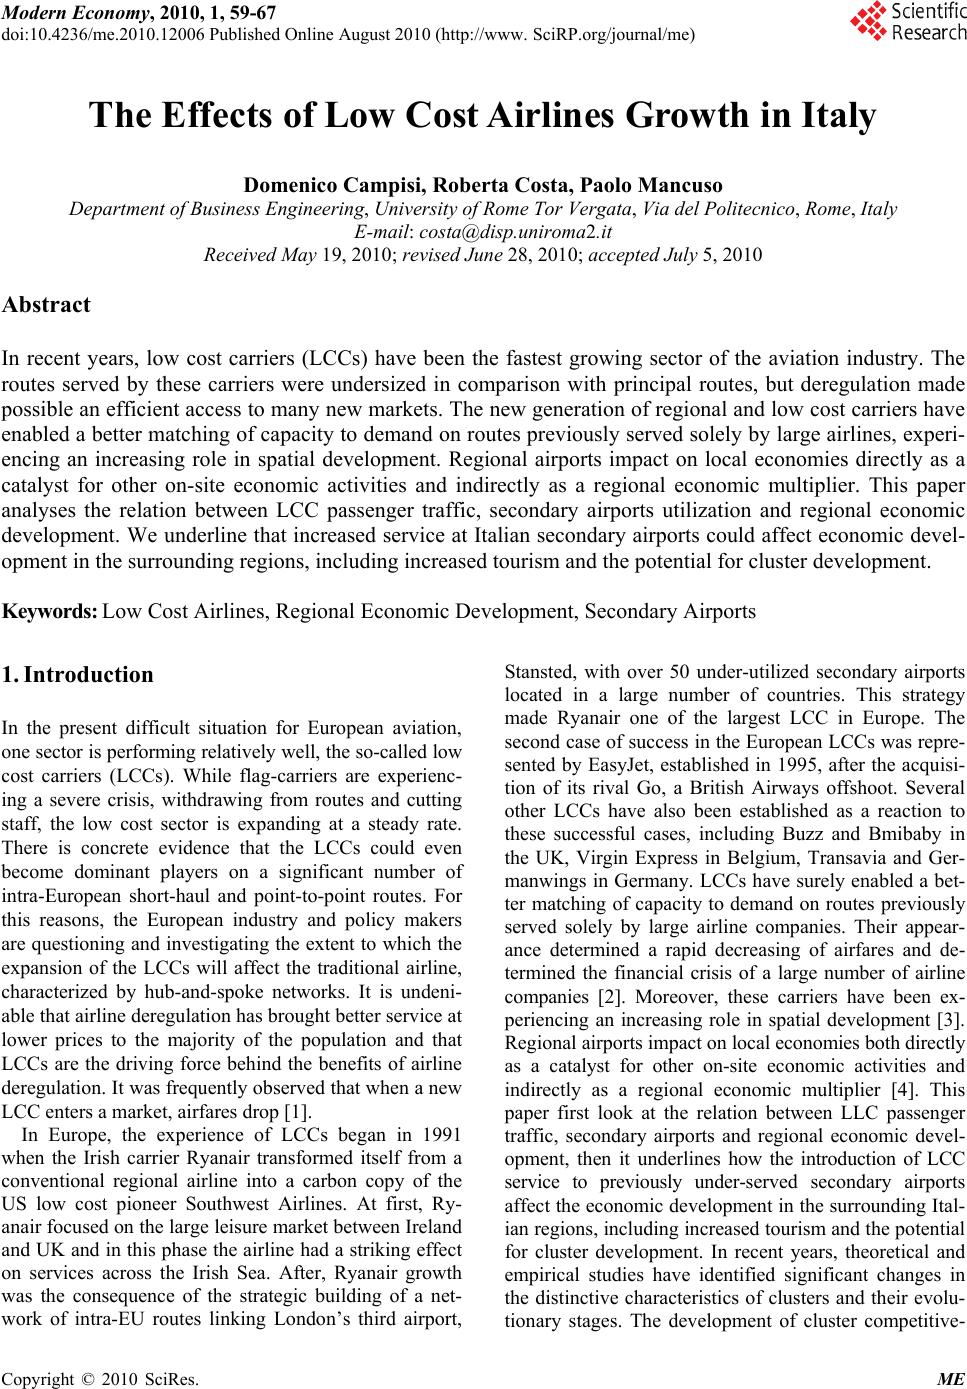 Modern Economy, 2010, 1, 59-67 doi:10.4236/me.2010.12006 Published Online August 2010 (http://www. SciRP.org/journal/me) Copyright © 2010 SciRes. ME The Effects of Low Cost Airlines Growth in Italy Domenico Campisi, Roberta Costa, Paolo Mancuso Department of Business Engineering, University of Rome Tor Vergata, Via del Politecnico, Rome, Italy E-mail: costa@disp.uniroma2.it Received May 19, 2010; revised June 28, 2010; accepted July 5, 2010 Abstract In recent years, low cost carriers (LCCs) have been the fastest growing sector of the aviation industry. The routes served by these carriers were undersized in comparison with principal routes, but deregulation made possible an efficient access to many new markets. The new generation of regional and low cost carriers have enabled a better matching of capacity to demand on routes previously served solely by large airlines, experi- encing an increasing role in spatial development. Regional airports impact on local economies directly as a catalyst for other on-site economic activities and indirectly as a regional economic multiplier. This paper analyses the relation between LCC passenger traffic, secondary airports utilization and regional economic development. We underline that increased service at Italian secondary airports could affect economic devel- opment in the surrounding regions, including increased tourism and the potential for cluster development. Keywords: Low Cost Airlines, Regional Economic Development, Secondary Airports 1. Introduction In the present difficult situation for European aviation, one sector is performing relatively well, the so-called low cost carriers (LCCs). While flag-carriers are experienc- ing a severe crisis, withdrawing from routes and cutting staff, the low cost sector is expanding at a steady rate. There is concrete evidence that the LCCs could even become dominant players on a significant number of intra-European short-haul and point-to-point routes. For this reasons, the European industry and policy makers are questioning and investigating the extent to which the expansion of the LCCs will affect the traditional airline, characterized by hub-and-spoke networks. It is undeni- able that airline deregulation has brought better service at lower prices to the majority of the population and that LCCs are the driving force behind the benefits of airline deregulation. It was frequently observed that when a new LCC enters a market, airfares drop [1]. In Europe, the experience of LCCs began in 1991 when the Irish carrier Ryanair transformed itself from a conventional regional airline into a carbon copy of the US low cost pioneer Southwest Airlines. At first, Ry- anair focused on the large leisure market between Ireland and UK and in this phase the airline had a striking effect on services across the Irish Sea. After, Ryanair growth was the consequence of the strategic building of a net- work of intra-EU routes linking London’s third airport, Stansted, with over 50 under-utilized secondary airports located in a large number of countries. This strategy made Ryanair one of the largest LCC in Europe. The second case of success in the European LCCs was repre- sented by EasyJet, established in 1995, after the acquisi- tion of its rival Go, a British Airways offshoot. Several other LCCs have also been established as a reaction to these successful cases, including Buzz and Bmibaby in the UK, Virgin Express in Belgium, Transavia and Ger- manwings in Germany. LCCs have surely enabled a bet- ter matching of capacity to demand on routes previously served solely by large airline companies. Their appear- ance determined a rapid decreasing of airfares and de- termined the financial crisis of a large number of airline companies [2]. Moreover, these carriers have been ex- periencing an increasing role in spatial development [3]. Regional airports impact on local economies both directly as a catalyst for other on-site economic activities and indirectly as a regional economic multiplier [4]. This paper first look at the relation between LLC passenger traffic, secondary airports and regional economic devel- opment, then it underlines how the introduction of LCC service to previously under-served secondary airports affect the economic development in the surrounding Ital- ian regions, including increased tourism and the potential for cluster development. In recent years, theoretical and empirical studies have identified significant changes in the distinctive characteristics of clusters and their evolu- tionary stages. The development of cluster competitive-  D. CAMPISI ET AL. Copyright © 2010 SciRes. ME 60 ness is a function of different traits that from time to time have characterized their evolution [5]. We will try to identify in which cases the increased service at Italian secondary airports, that affected economic development in the surrounding regions, could possibly favourite a cluster development. 2. The Market of Low Cost Carriers In order to analyze the LCC structure and strategy and to investigate the real profitability and sustainability of the LCC business model, we adopted the Structure-Conduct- Performance (SCP) paradigm [6]. The SCP approach links elements of market structure to business conduct and performance in industrial economics. In this model, the market structure (Structure) is defined mainly by market concentration, number of firms and vertical inte- gration. The behaviour of firms (Conduct), that could be collusive or competitive, depends strictly on pricing, cost structure of the firms, choice of technology, R & D, ad- vertising, entry barriers, etc. Performance is mainly de- fined by the extent of the firm’s market power and it is measured by profitability, price level and efficiency. The sample analyzed is formed by 15 LCCs (Table 1) and is representative of LCCs that serve routes to and from Italy. In our sample the competition is played be- tween carriers in the European market, since they serve only intra-European routes on short and medium dis- tances. The LCCs were chosen according to the STAT- FOR documents of Eurocontrol (European Organization for the Safety of Air Navigation) [7] and they repre- sented in 2005 about the 70% of the European LCCs, corresponding to the 80% of the passenger traffic gener- ated by LCCs in Italy. Table 1. LCC passenger traffic in 2005 (to and from Italy). Low cost airlines # passengers market share si Itali Airlines 113 075 0.18% SkyEurope 171 000 0.28% Lauda Air 386 177 0.63% Blue Air 443 500 0.72% Bmibaby 821 000 1.34% Eurofly 1 108 291 1.81% Volare Web 1 873 429 3.05% Hapag Lloyd 1 950 000 3.18% Germanwings 2 395 000 3.90% Sterling Airlines 2 455 000 4.00% Virgin Express 2 533 000 4.13% Flybe 3 386 000 5.52% Transavia 4 210 000 6.86% EasyJet 18 153 000 29.58% Ryanair 21 372 000 34.82% Total 61 370 472 100% Source: Eurocontrol, IATA, ICAO, LCC websites, 2006 As stated before, the Structure of a market is described by market concentration that is a function of the number of firms in a market and their respective market shares. We apply the Herfindahl-Hirschman Index (HHI) (1) to the LCC market shares (Table 1) in order to determine market concentration in the LCC market. 211 0.22 0.07 15 i i HHI sN (1) All the data analysed are from Eurocontrol, IATA (In- ternational Air Transport Association) and ICAO (Inter- national Civil Aviation Organization) and they refer to the year 2005 [7-9]. From the analysis of the sample, we observe an evi- dent disparity in the dimension of the LCCs and the pres- ence of a great concentration in the LCC market. In fact, the market is constituted by a small number of large companies (Ryanair, Easyget) with a combined market share exceeding 50% and a large number of small and medium companies characterized by a market share from 7% to less than 1%. Conduct represents the behaviour of firms in the mar- ket and it is highly influenced by the market demand. It is well-known that the market demand determines, in periods of economic uncertainty, the change of structure and intensity of competition in the airline sector. This is one of the many factors that caused the LCC success in the last decades. Under this aspect, we have to consider that the segmentation of the air travel demand, into busi- ness and leisure travellers, influences greatly airline pricing. Business travellers are less price sensitive, require more flexibility to change travel arrangements and are willing to pay much higher prices than leisure travellers. On the contrary, leisure travellers are usually considered to be price sensitive and, in their market segment, airlines can increase revenues by lowering prices [10]. As a con- sequence, many carriers have adopted a differential pric- ing: low-fares are targeted at leisure travellers to fill seats that would otherwise go empty. The pricing structure is preserved by applying constrains to low-fares making them unfeasible to business travellers (i.e. pre-booking periods) [11]. Concentrating their efforts on non-business travels LCCs have, in the last years, conquered a large part of the leisure market, especially on short routes. From 1995 to 2006, LCCs registered a 45% growth of the weekly seats (Figure 1) and more important is the constant increase of ASKs [12], that is the number of seats available for passengers multiplied by the number of kilometres those seats are flown. LCC share of the overall European ASKs has grown about 640% since 1997 and LCCs are capturing a steadily growing share of the European market. It is important to point out that the growth of the LLC demand continued to go on after September 11th, whereas full cost air companies faced severe crisis. Besides, many organization as IATA and ICAO consider a great part of LCC market to be a newly  D. CAMPISI ET AL. Copyright © 2010 SciRes. ME 61 generated market. As Conduct we intend also all the management pecu- liarity that are proper of LCCs. The business model of LCCs has a direct impact on their cost structure and consequently on the pricing strategies and revenues. In Table 2 are described the main aspects that distinguish low cost and full cost carriers, explaining the respective strategies of the two in their respect [13]. To achieve the low operating costs per passenger required, LCCs need to have as many seats on board of their aircraft as possi- ble, to fill them as much as possible, and to fly the air- crafts as often as possible. The cost structure is classified in: not operating and operating costs. The first ones are not strictly connected with the LCC activity, while the second ones depend directly on it. In order to analyze the cost structure is obviously necessary to focus on the ope- rating costs that reflect the more efficient management of LCC operations. Operating costs are divided in direct and indirect operating costs. Direct operating costs are: maintenance, passenger service costs, fuel and oil, navig- ation and airport fees, handling etc. Indirect operating co- sts are: marketing costs, staff costs, depreciation and int- erests, etc. Great influence on the direct operating costs has fuel and oil costs, but these are mostly independent from the efficiency of the carrier. The main cost differe- nce between full cost and low cost carriers is represented by labour cost (about 30%-35%) and depends on three drivers: a greater productivity of the working-force, a di- fference in salary between low and full cost carriers, and a no-service model that allows the reduction of fly atten- dant and check-in staff. The second cost difference in order of importance is on “sales and reservations” (about 13%-18%) and it is ob- tained by selling directly to customers via Internet and call centres and by using electronic ticketing. In this way, LCCs avoid travel agency commissions and computer reservation system fees. In the USA, Southwest registered in these cost areas an advantage of 50% over the main traditional carriers in 2003. It is interesting to notice that in the revolution of the distribution channels, the traditional carriers acted as followers instead than as incumbents, whilst LCCs, the new entrants, behaved as leaders. The third aspect that distinguishes LCCs is maintenance costs (a difference of about 12%-17% with full cost carriers): the competitive advantage, in this case, is caused by the homogeneity of the LCC fleet (a single aircraft model), an aggressive negotiation in maintenance contracts agreements and outsourcing. Other important differences in the cost structure of low cost and full cost carriers are ground landing and landing fees, for a total of 20%-25%, both deriving from the strategic chose of LCCs of secon- dary airport, where better condition are negotiable. The remaining 10%-20% of cost divergence is due to other cost savings such as the no-service policy of LCCs, that is perhaps the area of cost savings most apparent to passen- gers [14]. A greater aircraft productivity is undoubtedly the primary source of LCC competitive advantage: it is obtained using non-congested secondary airports and not offering anything other than point-to-point services (i.e. like interlining). In fact, secondary airports charge air- lines less than primary airports for using their services. Moreover, secondary airports are less busy, allowing less delays due to congestion. As said before, personnel pro- ductivity is another key area where LCCs gain competi- tive advantage: LCCs use a single aircraft model and, as a consequence, pilots and cabin crew can operate on any aircraft in the fleet. Another interesting factor to examine is the cost difference between low cost and full cost carriers Figure 1. LCC ASK share (with respect to all the market). Table 2. The business model of low cost and full cost carrier. Low Cost Carriers Full Cost Carriers Brand One (low-fare) brand Extensions: fare+service Fares Simplified fare structure Complex fare structure Distribution Online and call centres Online, direct, travel agent Airports Secondary (mostly) Primary Connections Point-to-point Interlining, hub and spokes Class segmentation One class (high density) Two class Aircraft utilisation Very high Medium to high Turnaround time 25 min turnarounds Low turnaround Product One product: low fare Multiple integrated products Aircraft Single type: commonality Multiple types: Scheduling complexities Seating Small pitch, no assignment Generous pitch, offers seat assignment Customer service Generally under performs Full service, reliability Operational activities Focus on core (flying) Extensions: e.g., maintenance, cargo Source: O’Connell and Williams, 2005  D. CAMPISI ET AL. Copyright © 2010 SciRes. ME 62 with respect to the cost per ASK. In Figure 2 is clearly depicted as this difference decreases with the length of the flight (sector length). The reducing cost advantage, occurring with the increasing sector length, is due mainly to a decreasing acceptance of lack of service by passen- gers and an increasing revenue need in LCCs. Focusing on a sector length of 1,500 Km, the ICAO estimated the LCC cost advantage as: 30% on total crew costs, 5% on landing and handling charges, 50% on passenger related costs, 70% on sales costs and 60% for other costs [14]. To measure Performance is to measure the results of a firm in terms of productivity and profitability. Since the LCC model derives competitive advantage from a greater aircraft productivity and a more efficient cost structure, the performance of LCCs in 2005 is analysed by means of profitability and efficiency indexes. We choose three profitability indexes: ROI (Return on Investment), ROS (Return on Sales), ROE (Return on Equity). While we consider the Load Factor of LCCs as the efficiency index. The analysis evidences the existence of a small number of large LCCs that gained a high profitability, while a great number of medium and small carriers faced eco- nomic and financial difficulties (Table 3). The bad per- formance of smaller LCCs is motivated by an inefficient management of their operating costs, that is a dangerous deficiency while adopting the LCC business model. Volare Web performed the worst ROS, because the op- erative costs are one and half greater than the revenues of this LCC. This result reflects the financial problem faced by Volare Web that conducted the company to a controlled administration in order to avoid bankrupt, followed by its acquisition by the Alitalia Group. Figure 3 depicts the average value of each profitability index for: 1) large airline companies (more than 3 millions passenger traffic), and 2) small and medium airline companies (less than 3 millions passenger traffic). Volare Web was not considered because of the severe financial crisis. There is an evident gap between the two groups in all the profitability indexes, more so for the ROS index: that confirms the difficulty of smaller and medium LCCs to manage operating costs in accord to the LCC business model. The last performance index is a very important one in the LCC philosophy. The Load Factor is the percentage of seats filled with passengers: it indicates that an airplane is more efficiently utilized, lowering the operating costs and, as a result, the airfares. A good Load Factor assures the necessary utilization and productivity of critical LCC resources: personnel and aircrafts. Figure 4 represents the Load Factors of the sample in 2005: the average value of this index is 75%. An half of the sample has a Load Factor better than the average value and from Figure 5 it is evident that there is a corre- lation between a good financial performance (ROS) and a high Load Factor: only those carriers that are operatively efficient have financial success in the long run. 0% 20% 40% 60% 80% 100% 0 50 100 150 200 250 300 3005007009001100 13001500 17001900 € / 1000 ASK Stage length (Km) Full Cost CarriersLow Cost Carriers Percentage Difference Figure 2. Cost per ASK in 2005. Table 3. Low cost airlines: ROI, ROS, ROE (2005). Low cost carriers ROI ROE ROS Blue Air 3.47% 0.00% 1.48% Bmibaby –1.64% –10.00% –1.05% EasyJet 3.74% 4.43% 4.37% Eurofly –4.65% –10.27% –6.59% Flybe 1.04% 3.14% –5.28% Germanwings 5.72% 18.51% 2.38% Hapag Lloyd 9.09% 0.00% 3.61% Itali Airlines –0.47% 0.59% –0.94% Lauda Air 3.75% 5.16% 4.57% Ryanair 10.68% 19.28% 31.28% SkyEurope –0.52% –7.46% –1.03% Sterling Airlines –7.27% –3.45% –10.99% Transavia 3.20% 7.38% 4.10% Virgin Express –8.98% n.d. –7.73% Volare Web –4.50% –37.02% –66.81% ROI ROEROS Larg e Small and Medium Sample Average 10% 5% 0% -5% Figure 3. Average ROI, ROS, ROE for large, medium and small LCCs (2005). 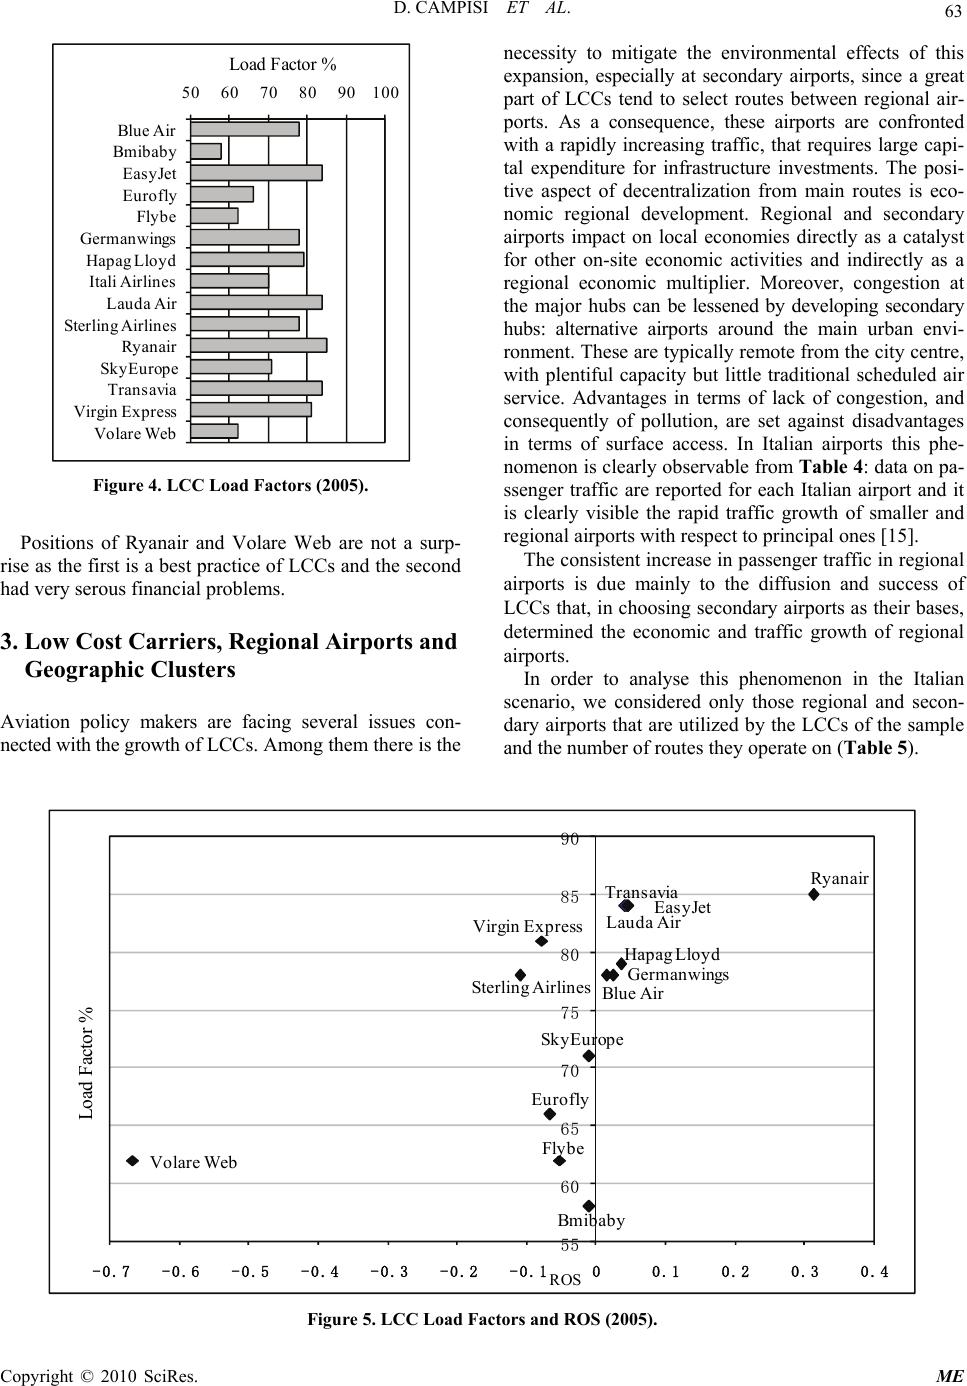 D. CAMPISI ET AL. Copyright © 2010 SciRes. ME 63 50 60 70 80 90100 Blue Air Bmibaby Easy Jet Eurofly Flybe Germanwings Hapag Lloyd Itali Airlines Lauda Air Sterling Airlines Ryanair SkyEurop e Trans avia Virgin Express Volare Web Load Factor % Figure 4. LCC Load Factors (2005). Positions of Ryanair and Volare Web are not a surp- rise as the first is a best practice of LCCs and the second had very serous financial problems. 3. Low Cost Carriers, Regional Airports and Geographic Clusters Aviation policy makers are facing several issues con- nected with the growth of LCCs. Among them there is the necessity to mitigate the environmental effects of this expansion, especially at secondary airports, since a great part of LCCs tend to select routes between regional air- ports. As a consequence, these airports are confronted with a rapidly increasing traffic, that requires large capi- tal expenditure for infrastructure investments. The posi- tive aspect of decentralization from main routes is eco- nomic regional development. Regional and secondary airports impact on local economies directly as a catalyst for other on-site economic activities and indirectly as a regional economic multiplier. Moreover, congestion at the major hubs can be lessened by developing secondary hubs: alternative airports around the main urban envi- ronment. These are typically remote from the city centre, with plentiful capacity but little traditional scheduled air service. Advantages in terms of lack of congestion, and consequently of pollution, are set against disadvantages in terms of surface access. In Italian airports this phe- nomenon is clearly observable from Table 4: data on pa- ssenger traffic are reported for each Italian airport and it is clearly visible the rapid traffic growth of smaller and regional airports with respect to principal ones [15]. The consistent increase in passenger traffic in regional airports is due mainly to the diffusion and success of LCCs that, in choosing secondary airports as their bases, determined the economic and traffic growth of regional airports. In order to analyse this phenomenon in the Italian scenario, we considered only those regional and secon- dary airports that are utilized by the LCCs of the sample and the number of routes they operate on (Table 5). Transavia Blue Air Bmibaby EasyJet Eurofly Flybe Germanwings Hapag Lloyd Lauda Air Sterling Airlines Ryanair SkyEurope Virgin Express Volare Web 55 60 65 70 75 80 85 90 -0.7 -0.6 -0.5 -0.4 -0.3 -0.2 -0.100.10.20.30.4 Load Factor % ROS Figure 5. LCC Load Factors and ROS (2005). 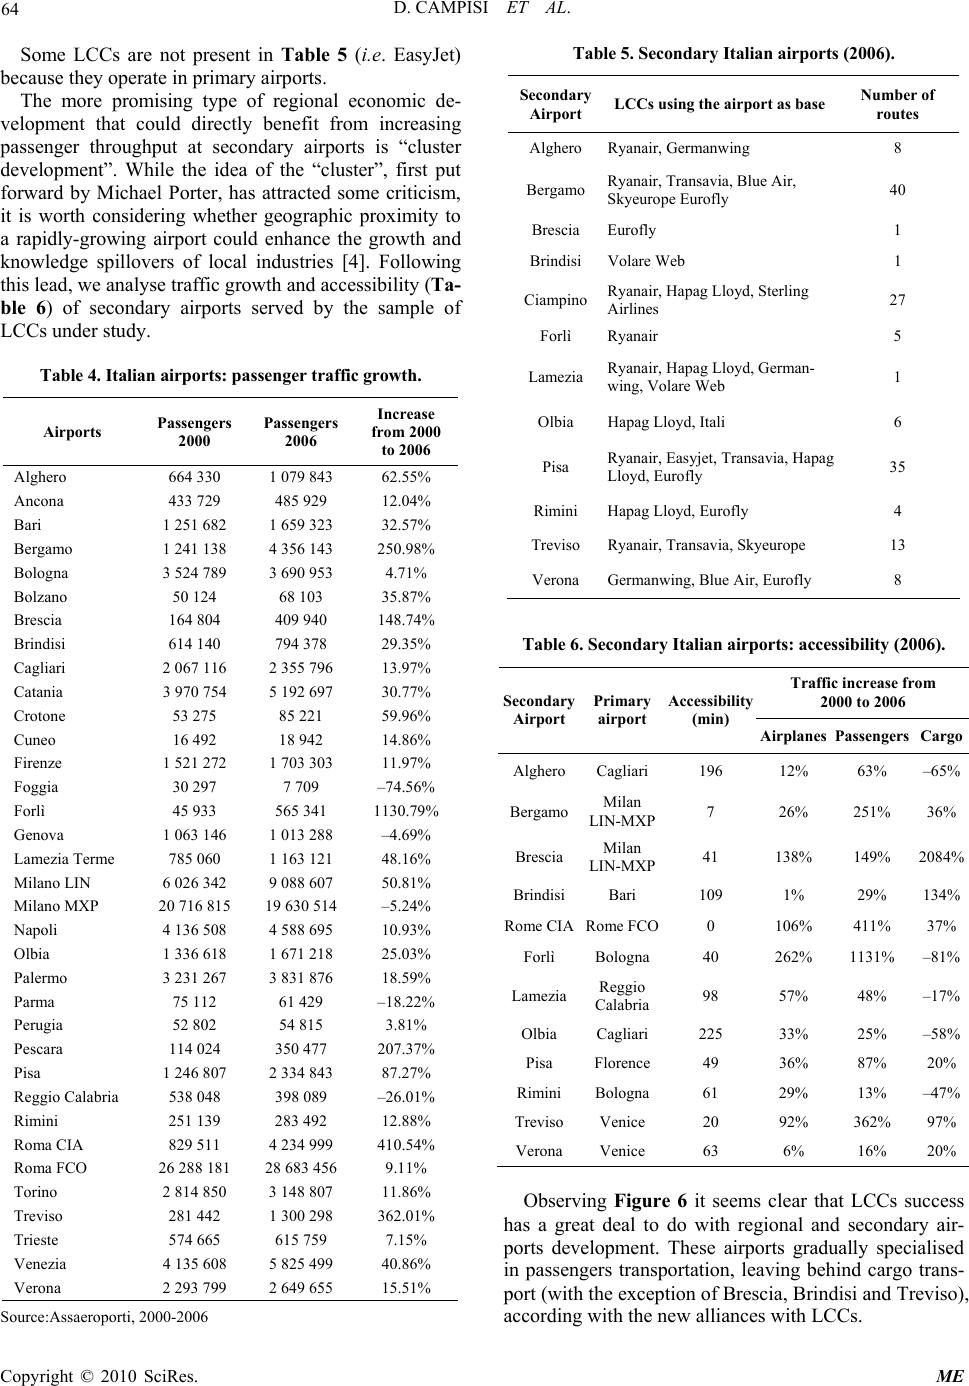 D. CAMPISI ET AL. Copyright © 2010 SciRes. ME 64 Some LCCs are not present in Table 5 (i.e. EasyJet) because they operate in primary airports. The more promising type of regional economic de- velopment that could directly benefit from increasing passenger throughput at secondary airports is “cluster development”. While the idea of the “cluster”, first put forward by Michael Porter, has attracted some criticism, it is worth considering whether geographic proximity to a rapidly-growing airport could enhance the growth and knowledge spillovers of local industries [4]. Following this lead, we analyse traffic growth and accessibility (Ta- ble 6) of secondary airports served by the sample of LCCs under study. Table 4. Italian airports: passenger traffic growth. Airports Passengers 2000 Passengers 2006 Increase from 2000 to 2006 Alghero 664 330 1 079 843 62.55% Ancona 433 729 485 929 12.04% Bari 1 251 682 1 659 323 32.57% Bergamo 1 241 138 4 356 143 250.98% Bologna 3 524 789 3 690 953 4.71% Bolzano 50 124 68 103 35.87% Brescia 164 804 409 940 148.74% Brindisi 614 140 794 378 29.35% Cagliari 2 067 116 2 355 796 13.97% Catania 3 970 754 5 192 697 30.77% Crotone 53 275 85 221 59.96% Cuneo 16 492 18 942 14.86% Firenze 1 521 272 1 703 303 11.97% Foggia 30 297 7 709 –74.56% Forlì 45 933 565 341 1130.79% Genova 1 063 146 1 013 288 –4.69% Lamezia Terme 785 060 1 163 121 48.16% Milano LIN 6 026 342 9 088 607 50.81% Milano MXP 20 716 815 19 630 514 –5.24% Napoli 4 136 508 4 588 695 10.93% Olbia 1 336 618 1 671 218 25.03% Palermo 3 231 267 3 831 876 18.59% Parma 75 112 61 429 –18.22% Perugia 52 802 54 815 3.81% Pescara 114 024 350 477 207.37% Pisa 1 246 807 2 334 843 87.27% Reggio Calabria 538 048 398 089 –26.01% Rimini 251 139 283 492 12.88% Roma CIA 829 511 4 234 999 410.54% Roma FCO 26 288 181 28 683 456 9.11% Torino 2 814 850 3 148 807 11.86% Treviso 281 442 1 300 298 362.01% Trieste 574 665 615 759 7.15% Venezia 4 135 608 5 825 499 40.86% Verona 2 293 799 2 649 655 15.51% Source:Assaeroporti, 2000-2006 Table 5. Secondary Italian airports (2006). Secondary Airport LCCs using the airport as base Number of routes Alghero Ryanair, Germanwing 8 Bergamo Ryanair, Transavia, Blue Air, Skyeurope Eurofly 40 Brescia Eurofly 1 Brindisi Volare Web 1 Ciampino Ryanair, Hapag Lloyd, Sterling Airlines 27 Forlì Ryanair 5 Lamezia Ryanair, Hapag Lloyd, German- wing, Volare Web 1 Olbia Hapag Lloyd, Itali 6 Pisa Ryanair, Easyjet, Transavia, Hapag Lloyd, Eurofly 35 Rimini Hapag Lloyd, Eurofly 4 Treviso Ryanair, Transavia, Skyeurope 13 Verona Germanwing, Blue Air, Eurofly 8 Table 6. Secondary Italian airports: accessibility (2006). Traffic increase from 2000 to 2006 Secondary Airport Primary airport Accessibility (min) Airplanes PassengersCargo AlgheroCagliari 196 12% 63% –65% Bergamo Milan LIN-MXP 7 26% 251% 36% Brescia Milan LIN-MXP 41 138% 149% 2084% BrindisiBari 109 1% 29% 134% Rome CIARome FCO0 106% 411% 37% Forlì Bologna40 262% 1131% –81% Lamezia Reggio Calabria 98 57% 48% –17% Olbia Cagliari 225 33% 25% –58% Pisa Florence49 36% 87% 20% Rimini Bologna61 29% 13% –47% Treviso Venice 20 92% 362% 97% Verona Venice 63 6% 16% 20% Observing Figure 6 it seems clear that LCCs success has a great deal to do with regional and secondary air- ports development. These airports gradually specialised in passengers transportation, leaving behind cargo trans- port (with the exception of Brescia, Brindisi and Treviso), according with the new alliances with LCCs. 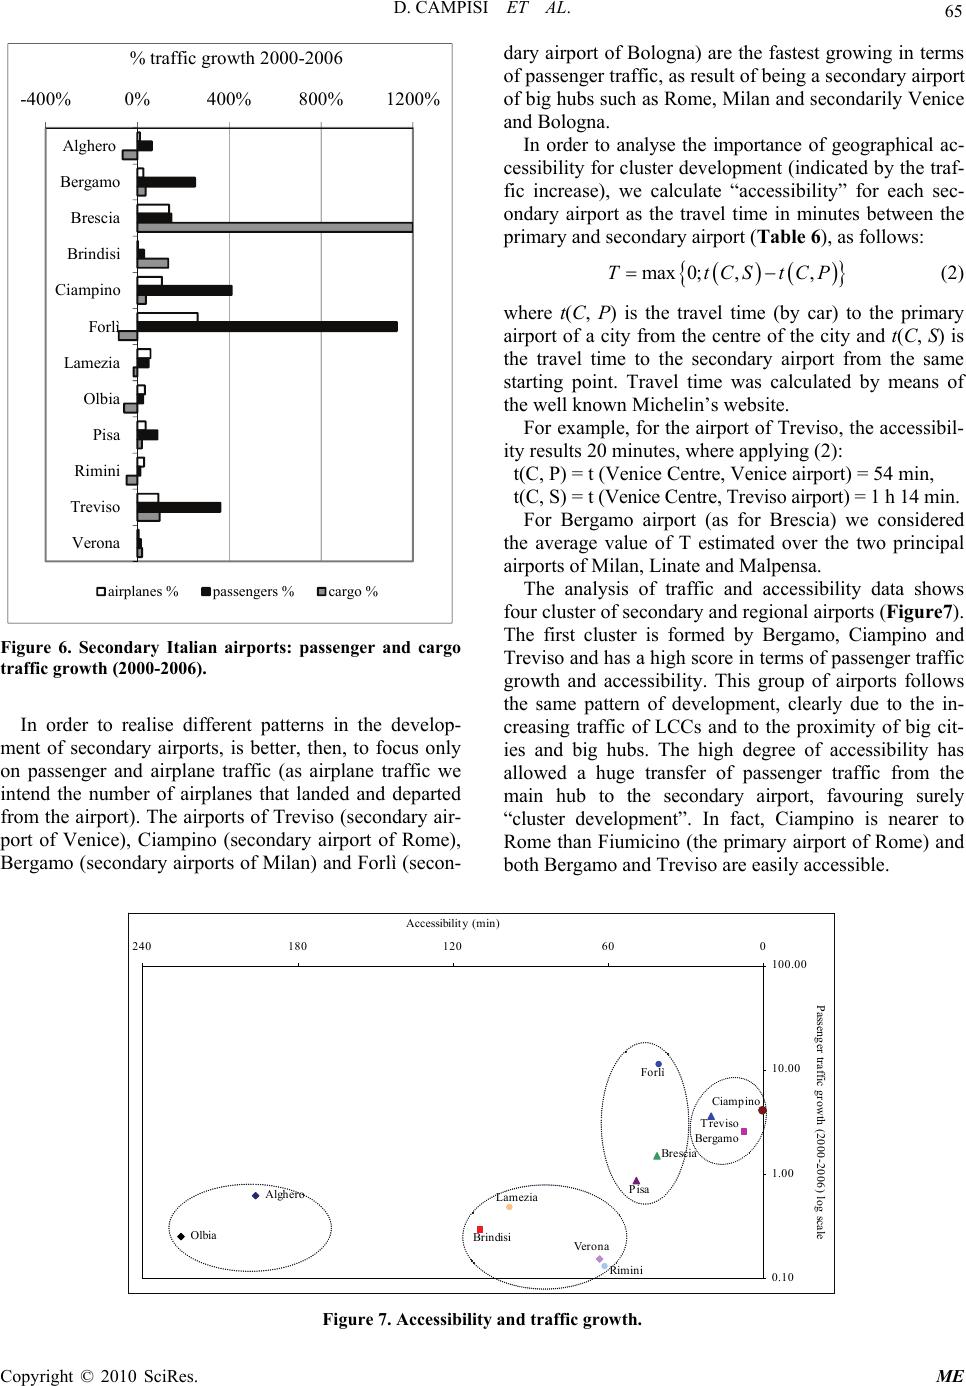 D. CAMPISI ET AL. Copyright © 2010 SciRes. ME 65 -400%0%400%800% 1200% Alghero Bergamo Brescia Brindisi Ciampino Forlì Lamez ia Olbia Pisa Rimini Treviso Verona % traffic growth 2000-2006 airplanes %passengers %cargo % Figure 6. Secondary Italian airports: passenger and cargo traffic growth (2000-2006). In order to realise different patterns in the develop- ment of secondary airports, is better, then, to focus only on passenger and airplane traffic (as airplane traffic we intend the number of airplanes that landed and departed from the airport). The airports of Treviso (secondary air- port of Venice), Ciampino (secondary airport of Rome), Bergamo (secondary airports of Milan) and Forlì (secon- dary airport of Bologna) are the fastest growing in terms of passenger traffic, as result of being a secondary airport of big hubs such as Rome, Milan and secondarily Venice and Bologna. In order to analyse the importance of geographical ac- cessibility for cluster development (indicated by the traf- fic increase), we calculate “accessibility” for each sec- ondary airport as the travel time in minutes between the primary and secondary airport (Table 6), as follows: max 0;,,TtCStCP (2) where t(C, P) is the travel time (by car) to the primary airport of a city from the centre of the city and t(C, S) is the travel time to the secondary airport from the same starting point. Travel time was calculated by means of the well known Michelin’s website. For example, for the airport of Treviso, the accessibil- ity results 20 minutes, where applying (2): t(C, P) = t (Venice Centre, Venice airport) = 54 min, t(C, S) = t (Venice Centre, Treviso airport) = 1 h 14 min. For Bergamo airport (as for Brescia) we considered the average value of T estimated over the two principal airports of Milan, Linate and Malpensa. The analysis of traffic and accessibility data shows four cluster of secondary and regional airports (Figure7). The first cluster is formed by Bergamo, Ciampino and Treviso and has a high score in terms of passenger traffic growth and accessibility. This group of airports follows the same pattern of development, clearly due to the in- creasing traffic of LCCs and to the proximity of big cit- ies and big hubs. The high degree of accessibility has allowed a huge transfer of passenger traffic from the main hub to the secondary airport, favouring surely “cluster development”. In fact, Ciampino is nearer to Rome than Fiumicino (the primary airport of Rome) and both Bergamo and Treviso are easily accessible. Alghero Olbia Bergamo Brescia Brindisi Ciampino Fo rlì Lamezia Pisa Rimini Treviso Verona 0.10 1.00 10.00 100.00 060120180240 Accessibility (min) Passenger traffic growth (2000-2006) log scale Figure 7. Accessibility and traffic growth. 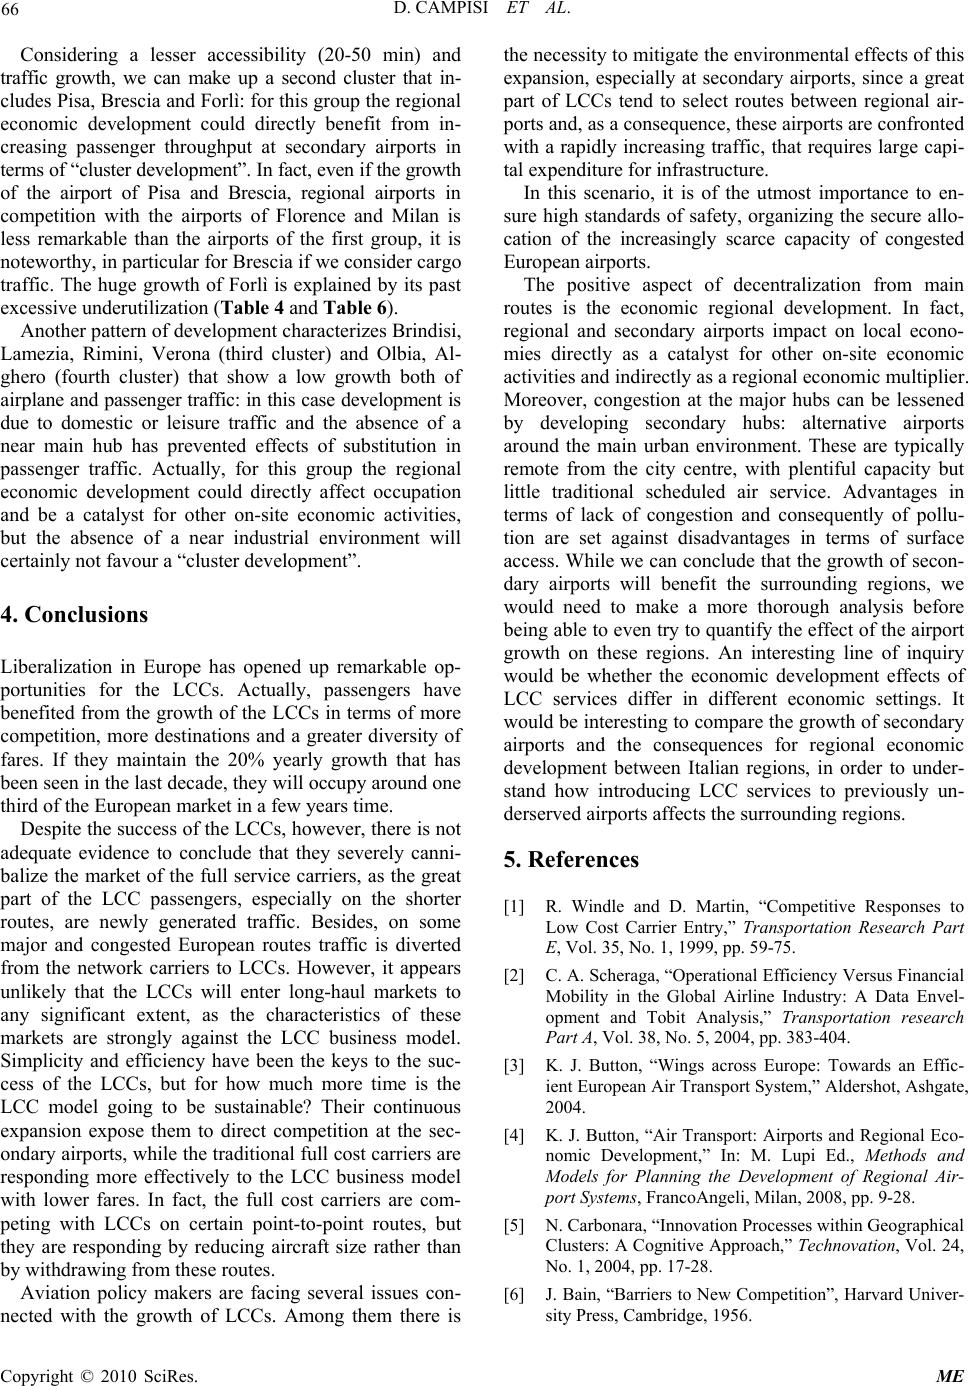 D. CAMPISI ET AL. Copyright © 2010 SciRes. ME 66 Considering a lesser accessibility (20-50 min) and traffic growth, we can make up a second cluster that in- cludes Pisa, Brescia and Forlì: for this group the regional economic development could directly benefit from in- creasing passenger throughput at secondary airports in terms of “cluster development”. In fact, even if the growth of the airport of Pisa and Brescia, regional airports in competition with the airports of Florence and Milan is less remarkable than the airports of the first group, it is noteworthy, in particular for Brescia if we consider cargo traffic. The huge growth of Forlì is explained by its past excessive underutilization (Table 4 and Table 6). Another pattern of development characterizes Brindisi, Lamezia, Rimini, Verona (third cluster) and Olbia, Al- ghero (fourth cluster) that show a low growth both of airplane and passenger traffic: in this case development is due to domestic or leisure traffic and the absence of a near main hub has prevented effects of substitution in passenger traffic. Actually, for this group the regional economic development could directly affect occupation and be a catalyst for other on-site economic activities, but the absence of a near industrial environment will certainly not favour a “cluster development”. 4. Conclusions Liberalization in Europe has opened up remarkable op- portunities for the LCCs. Actually, passengers have benefited from the growth of the LCCs in terms of more competition, more destinations and a greater diversity of fares. If they maintain the 20% yearly growth that has been seen in the last decade, they will occupy around one third of the European market in a few years time. Despite the success of the LCCs, however, there is not adequate evidence to conclude that they severely canni- balize the market of the full service carriers, as the great part of the LCC passengers, especially on the shorter routes, are newly generated traffic. Besides, on some major and congested European routes traffic is diverted from the network carriers to LCCs. However, it appears unlikely that the LCCs will enter long-haul markets to any significant extent, as the characteristics of these markets are strongly against the LCC business model. Simplicity and efficiency have been the keys to the suc- cess of the LCCs, but for how much more time is the LCC model going to be sustainable? Their continuous expansion expose them to direct competition at the sec- ondary airports, while the traditional full cost carriers are responding more effectively to the LCC business model with lower fares. In fact, the full cost carriers are com- peting with LCCs on certain point-to-point routes, but they are responding by reducing aircraft size rather than by withdrawing from these routes. Aviation policy makers are facing several issues con- nected with the growth of LCCs. Among them there is the necessity to mitigate the environmental effects of this expansion, especially at secondary airports, since a great part of LCCs tend to select routes between regional air- ports and, as a consequence, these airports are confronted with a rapidly increasing traffic, that requires large capi- tal expenditure for infrastructure. In this scenario, it is of the utmost importance to en- sure high standards of safety, organizing the secure allo- cation of the increasingly scarce capacity of congested European airports. The positive aspect of decentralization from main routes is the economic regional development. In fact, regional and secondary airports impact on local econo- mies directly as a catalyst for other on-site economic activities and indirectly as a regional economic multiplier. Moreover, congestion at the major hubs can be lessened by developing secondary hubs: alternative airports around the main urban environment. These are typically remote from the city centre, with plentiful capacity but little traditional scheduled air service. Advantages in terms of lack of congestion and consequently of pollu- tion are set against disadvantages in terms of surface access. While we can conclude that the growth of secon- dary airports will benefit the surrounding regions, we would need to make a more thorough analysis before being able to even try to quantify the effect of the airport growth on these regions. An interesting line of inquiry would be whether the economic development effects of LCC services differ in different economic settings. It would be interesting to compare the growth of secondary airports and the consequences for regional economic development between Italian regions, in order to under- stand how introducing LCC services to previously un- derserved airports affects the surrounding regions. 5. References [1] R. Windle and D. Martin, “Competitive Responses to Low Cost Carrier Entry,” Transportation Research Part E, Vol. 35, No. 1, 1999, pp. 59-75. [2] C. A. Scheraga, “Operational Efficiency Versus Financial Mobility in the Global Airline Industry: A Data Envel- opment and Tobit Analysis,” Transportation research Part A, Vol. 38, No. 5, 2004, pp. 383-404. [3] K. J. Button, “Wings across Europe: Towards an Effic- ient European Air Transport System,” Aldershot, Ashgate, 2004. [4] K. J. Button, “Air Transport: Airports and Regional Eco- nomic Development,” In: M. Lupi Ed., Methods and Models for Planning the Development of Regional Air- port Systems, FrancoAngeli, Milan, 2008, pp. 9-28. [5] N. Carbonara, “Innovation Processes within Geographical Clusters: A Cognitive Approach,” Technovation, Vol. 24, No. 1, 2004, pp. 17-28. [6] J. Bain, “Barriers to New Competition”, Harvard Univer- sity Press, Cambridge, 1956.  D. CAMPISI ET AL. Copyright © 2010 SciRes. ME 67 [7] Eurocontroll, “STATFOR Documents,” 2006. http://www. eurocontrol.int/ [8] International Air Transport Association (IATA), “Analy- sis and Reports from IATA Economics,” 2006. http:// www. iata.org/ [9] International Civil Aviation Organization (ICAO), “IC- AO Journal,” 2006. http://www.icao.int/ [10] P. Morrell, “Airlines within Airlines: An Analysis of US Network Airline Responses to Low Cost Carriers,” Jour- nal of Air Transport Management, Vol. 11, No. 5, 2005, pp. 303-312. [11] K. J. Mason, “The Propensity of Business Travellers to Use Low Cost Airlines,” Journal of Transport Geogra- phy, Vol. 8, No. 2, 2000, pp. 107-119. [12] Association of European Airlines (AEA), “AEA Traffic Report,” 2002-2006. http://www.aea.be/ [13] J. F. O’Connell and G. Williams, “Passengers’ Percep- tions of Low Cost Airlines and Full Service Carriers: A Case Study Involving Ryanair, Aer Lingus, Air Asia and Malaysia Airlines,” Journal of Air Transport Manage- ment, Vol. 11, No. 4, 2005. pp. 259-272. [14] P. Horder, “Airline Operating Costs,” Presented at Man- aging Aircraft Maintenance Costs Conference, Brussels, 2003. [15] Assaeroporti, “Airports Database,” 2000-2006. http:// www.assaeroporti.it/ |