Health
Vol.6 No.10(2014), Article ID:44931,10 pages DOI:10.4236/health.2014.610132
Life Satisfaction among Elderly Households in Public Rental Housing in Singapore
Kwame Addae-Dapaah1*, Quah Shu Juan2
1Department of Real estate, National University of Singapore, Singapore City, Singapore
2Knight Frank Pte Ltd, Singapore City, Singapore
Email: *rstka@nus.edu.sg
Copyright © 2014 by authors and Scientific Research Publishing Inc.
This work is licensed under the Creative Commons Attribution International License (CC BY).
http://creativecommons.org/licenses/by/4.0/


Received 4 March 2014; revised 6 April 2014; accepted 14 April 2014
ABSTRACT
We set out to investigate how satisfied the poor elderly Singaporean households in social housing are with their lives, especially in relation to their housing, in an attempt to find measures to improve, where possible, the life satisfaction of this group of elderly Singaporeans. We use archival and empirical research for our investigation. The results from 403 respondents to our survey are analyzed through logistic regression and factor analysis. We find that the life satisfaction of the elderly residents of social housing is very low. Furthermore we find that home modification that meets the requirements of the respondents will substantially improve their life satisfaction. Given that these elderly households neither have the right nor financial means to modify their housing units and precincts, it is incumbent upon the government, through the relevant authorities such as HDB, Town Councils and BCA to effect the necessary home modifications to create a more elderlyfriendly physical environment to improve the life satisfaction of the elderly households in social housing in Singapore. This arguably is a social imperative which should not be subjugated to economic niceties as social housing is not a luxurious housing choice but the last safety net for basic shelter.
Keywords:Public Rental Housing, Home Medications, Life Satisfaction, Factor Analysis, Binary Logit Model

1. Introduction
Social definitions of elderly differ from one society to another. According to World Health Organization [1] , most of the developed nations have accepted the age of 65 as the threshold for the group of people termed elderly. This definition synchronizes with the statutory age specified by Housing Development Board (HDB) as well as the 2010 official retirement age in Singapore. Therefore, an elderly person in this paper refers to one who is aged 65 years and above.
Singapore’s ageing population is growing at a fast rate of 3.8% per annum [2] . Ranked as the world’s third fastest ageing nation [3] , the proportion of Singapore’s population aged 65 and above is expected to reach 20% by 2020 from the current 9.0% as shown in Figure 1 [4] . This is the result of both longevity of life and declining fertility rate, which synergistically have led to declining old age support ratio from 17 in 1970 to 8.2 in 2010 (see Figure 2 [5] ).
Scholarly articles and government publications have examined the implications of an ageing society to a rather large extent. Various statutory boards, together with the Committee on Ageing Issues (CAI) that was set up in December 2004, have explored the financial options and various home equity schemes available for these elderly people, and how they can best age comfortably.
One of the challenges of the demographic transformation of Singapore that requires utmost attention is the issue of housing for the aged. Housing is crucial to these elderly persons for two reasons. First, they need a secure and comfortable home; and second, an ideal housing option provides a social surrounding for these seniors to interact with others in the community [6] . In view of the importance of senior housing, Singapore provides various forms of dwellings such as studio apartments (SA), condo-style granny units and congregate sheltered housing for the elderly. While these living units have undeniably become popular over the years with those who can afford it, the number of public rental housing occupied by the relatively poor elderly people is also rising fast in number. Public rental blocks, i.e. social housing in other parts of the world, are let directly by HDB at subsidized rates for needy Singaporeans. As traditional value of filial piety may be lost in an increasingly
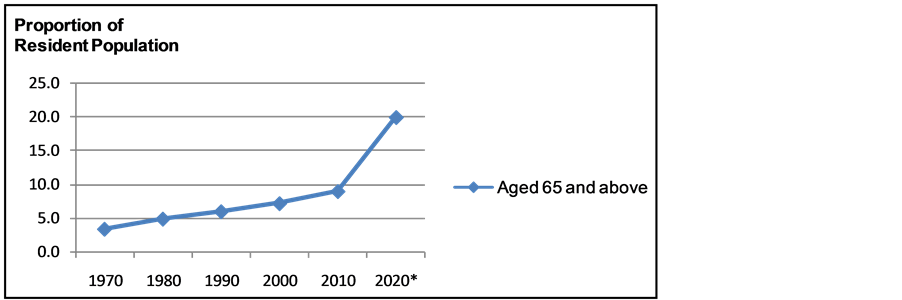
Figure 1. Proportion of elderly population from 1970 to 2020. Source: Singapore department of statistics [4] .
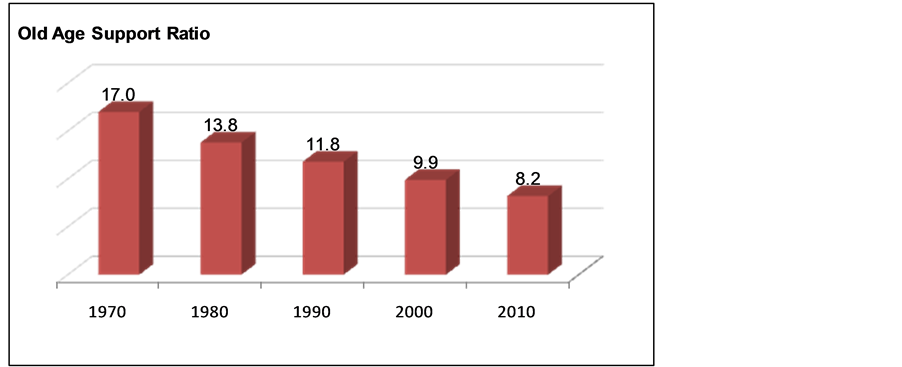
Figure 2. Old age support ratio. Source: Singapore department of statistics [5] .
globalised society like Singapore [7] , the trend of living apart from children is gradually gaining “enforced” acceptance—a Hobson’s choice—among the elderly people. Although this form of social housing was intended for the needy in general, those aged 55 and above occupied almost 75% of the total units by 2008. This group of elderly persons residing in Singapore’s public rental housing is the focus of this paper.
Improving the quality of life of Singaporeans has increasingly become a key political agenda as the country aspires to be an even more inclusive and vibrant city. Thus, the satisfaction with life among the elderly persons residing in public rental housing deserves consideration as social housing is not a luxurious choice of accommodation, but the last safety net for basic shelter for the relatively poor and needy that form the bottom 5% of the social hierarchy. Given that the plight of this group of elderly has been understudied, we set out to investigate how satisfied these poor elderly households in social housing are with their lives especially in relation to their housing in an attempt to finding measures to improve, where possible, the life satisfaction of this group of elderly Singaporeans.
2. Literature Review
The National Coalition for the Homeless [8] reports that homeless elders in the US are increasing in numbers as a result of poverty and declining availability of affordable housing. These homeless elders frequently fall back on governmental safety nets such as temporary or emergency shelters. In Massachusetts, the number of people over 55 years old using shelters increased by 60% from 1999 to 2002. However, many of these shelters do not meet the needs of the elderly group. For instance, some shelters are located on upper floors, making it inaccessible to those elderly who cannot climb stairs. Eventually, the severe living conditions and huge crowds of homeless people in these shelters force the elderly people to sleep on the streets. Therefore, The National Coalition for the Homeless urges the government to help these poor elderly people to remain securely housed in affordable housing with proper health care services in order to support their independent living.
According to Ireland’s National Council for the Aged [9] , the number of elderly persons in Ireland living independently increased from 19.7% in 1961 to 36.7% in 1981. This figure is expected to rise due to longevity, especially among elderly women. Given the urgency about the homelessness of the elderly Irish people, the Council recommends that the allocation of public housing to the elderly should take account of the medical conditions of the elderly applicants. In addition, priority should be given to elderly applicants who have been evicted from private rental accommodation because of their inability to pay market rent. The report concludes that general community awareness of the needs of the elderly people should be raised in order to enhance the quality of their lives.
Whitehead and Scanlon [10] conclude that the social sector in Europe generally houses a disproportionate number of elderly people and the poor. For instance, in Germany, public rented housing is dominated by older people with low income. In Sweden, single elderly people with lower than average income occupy the majority of these social housing. The paper concludes with a need to improve the quality of life of, and discusses affordable housing for, the most vulnerable groups like the elderly and the poor.
2.1. Life Satisfaction and Quality of Life of the Elderly People
World Health Organization [11] defines life satisfaction as individuals’ perception of their position in life in the context of the culture and value systems in which they live, and in relation to their expectations and standards. Life satisfaction can be affected by the person’s physical health, level of independence, social relationships and relationships to salient features of his environment.
According to Xavier et al. [12] , satisfaction among the elderly group is closely associated with active social life and good interpersonal relationships, while negative quality of life is equivalent to loss of health. One limitation of the study by Xavier et al. [12] is that the 67 survey respondents are older persons aged 80 and above. Since octogenarians are associated with lower mobility and greater loss of health, the responses may produce biased results. The outcome of the study could be different if the sample group had a wider age-range of elderly persons.
Brown et al. [13] conduct a systematic review of the literature to investigate the components of quality of life from the viewpoint of older people. Only articles detailing the use of individualized quality of life measures relevant to Europe, USA, Canada, Australia and New Zealand were included in the study. The results reveal that independence, mobility and autonomy are the foremost determinants of quality of life. The concept of independence in this context implies the ability of the housebound elderly person both to travel outside the home and to avail himself of easy access to community nursing. Other components of quality of life include social activities, safety and security. The elderly respondents confirmed the importance of their home, neighborhood and local community, access to transport and safety to their quality of life.
Loh [14] investigates the quality of life of the elderly living in Studio Apartments in Singapore on the bases of various aspects of life. These aspects include personal well-being, interpersonal relationships, housing quality and living environment. The survey results and analysis reveal that the respondents are not satisfied with their personal well-being as a whole. She concludes that policy makers should review their existing policies to provide more effective housing options for the rapidly ageing Singapore population in order to improve the quality of life of the elderly Singaporean. Moreover, rather than building new elderly housing for the elderly Singaporeans, Addae-Dapaah and Wong [15] conclude that home modification will be a more pragmatic solution to the elderly Singaporeans’ housing problems that could also improve their quality of life.
2.2. Home Modification for the Elderly
A publication by The National Resource Centre on Supportive Housing and Home Modifications [16] defines home modifications as converting or adapting the living environment to make tasks easier, reduce accidents and support independent living. The paper states that an accessible and supportive environment is vital to the quality of life of older adults as home modification can enhance their physical, social and service needs. Without changes to their existing home environment, some of the older persons may have to move to other places such as nursing homes, even though they would prefer to age in place.
According to Berg and Allen [17] 1.6 million Americans relied on wheelchair for mobility as of 1994. However, only 10% were living in homes suited to their functional limitations. Given the mismatch between the housing services and housing needs of the above group of people, Berg and Allen [17] carried out a survey on 525 wheelchair users to investigate the incidence of injurious falls in their home environment. The results of the survey show that 41.7% of the elderly respondents had had injurious falls. Berg and Allen [17] conclude that if the needed home modifications became a reimbursable expense under US’ health insurance, safety and access for the wheelchair users, especially the elderly, would be greatly improved.
In a survey by US Department of Health and Services [18] , 1512 older respondents aged 52 and above were asked about the existence of ten assistive home features in their homes: ramps and handrails at the entrance, emergency call system, grab bars and seat in the shower or tub area, grab bars around the toilet, a raised or modified toilet seat, a stair glide or chair lift, handrails in the stairways as well as hallways. The results show that two-thirds of the 1512 respondents had one or more of the assistive home features. The most common assistive home features included railings at the home entrance, followed by grab bars in the shower or tub area.
Addae-Dapaah and Wong [15] examine the types of home modifications that could be carried out to the existing stock of public housing in Singapore so as to create a suitable living environment for the elderly. The study reveals that the top three most preferred features among the 500 elderly respondents in studio apartments are non-slip floor tiles, gas sensors and lift-up level non-mixer taps. The paper concludes, among other things, that home modifications could improve the overall quality of life of the elderly more than newly built elderly housing. Since the respondents are only willing to pay for items that are below $1000, Addae-Dapaah and Wong suggest that public funds should be redirected from building specialized housing to home modifications for the older owners.
Abu-Bader et al. [19] employ Regression Modeling to examine the relationship between life satisfaction and various aspects of life among 99 low income elderly. They identify four significant predictors of life satisfaction: perceived physical health, social support, emotional balance and locus of control. Social support and physical health emerged as the most significant predictor of life satisfaction among the elderly.
We provide below a brief survey of public rental housing in Singapore before proceeding any further to give readers a better appreciation of the context of the study.
3. Public Rental Housing in Singapore
HDB [20] provides public rental housing to eligible Singaporeans. According to statistics given by the rental department of HDB, HDB had a total of 44,717 rental units with 100% occupancy as of September 2010. As the demand for these public rental flats keeps rising continuously, applicants are placed on a waiting list. The estimated waiting time on the list is shown in Table 1.
The average waiting time varies across flat type and location. Generally, potential rental flat residents have to remain in the queue for a minimum of 1.5 years before they are allocated a unit. The government’s response to the surge in demand for such social housing was a promise by the then Minister for National Development, Mah Bow Tan [21] to add 7500 rental units to existing stock to ensure that there are sufficient rental flats for those who need, and are eligible for them. The eligibility criteria are [22] :
1) The applicant must be a Singapore citizen and at least 21 years of age.
2) The total household gross income must not exceed $1500 per month.
3) The applicant must have a proper family nucleus as defined by HDB and any applicant who cannot form a family nucleus may apply under the Joint Singles Scheme (JSS). Under JSS, two single persons who are at least 35 years of age may jointly apply to rent a flat from HDB.
4) The applicant and the listed occupiers must not own or have an interest in a HDB flat, Design, Build & Sell Scheme (DBSS) flat, or have disposed of such property within 30 months prior to the date of application.
5) The applicant and all persons listed in the application must not have owned or sold two direct-purchase HDB flats in the open market. They must not own, have an estate or interest in a private property, an Executive Condominium (EC) or have disposed of such property at the point of application.
6) Applicants with children who are able to provide accommodation for them in their own homes or whose children have the financial ability to provide alternative accommodation for them would not be eligible to rent HDB flats.
3.1. Elderly in Poverty
According to Jrank [23] , it is generally accepted that poverty is the state of being poor or deficient in money or means of subsistence. Given that 86% of elderly Singaporeans have below secondary education, it may not be surprising that the majority of them are low-skilled workers engaged in menial jobs [24] .
A Household Expenditure Survey by Department of Statistics [25] shows that the average monthly household expenditure by the elderly group is S$1601. However, almost 60% of them earn below $1000 per month. This implies that many of the elderly Singaporeans have insufficient income to meet their expenses. Given that the virtue of filial piety needs reinforcement [26] , many elderly Singaporeans are physically independent but financially deprived. The grim plight of these elderly Singaporeans is exacerbated by the fact that housing-related expenses take up at least, 40% of a person’s disposable income [27] . Thus, the critical issue of providing quality and suitable housing for the poor and needy elderly Singaporeans needs to be addressed.
3.2. The Elderly Singaporeans in Public Rental Housing
According to data provided by HDB in 2004, 37,823 households could not afford to buy their own flats nor pay market rents. Although little is known about the age distribution, it is likely that the elderly group makes up a sizeable proportion of these poor households as they have comparatively lower education and higher unemployment rate [28] . The proportion of elderly households in public rental housing increased from 34.7% in 2003 to 40.1% in 2008 (Table 2). This translates into a 3494 increase in the number of older persons over a span of five years to 16,328. Future elderly households which are defined by HDB to be residents aged 55 to 64 increased by 7.4% over the period. The non-elderly households remain a minority in these rental blocks throughout the years. Therefore public rental housing in Singapore appears to be fast becoming a Naturally Occurring

Table 1. Average waiting time for 1 and 2-room public rental flats.
Source: HDB [20] .
Table 2. Distributions of households in public rental flats (2003 and 2008).
Source: Author (Based on data provided by HDB).
Retirement Community (NORC).
The senior citizens need elderly-friendly environments to age in, but these public rental units do not cater specifically to the elderly population. In order to improve the level of life satisfaction for these frail elderly people, home modifications to the living environment is perhaps the solution to improving their living conditions to enable them to age comfortably in these units.
4. Data Sourcing
Data for the study were primarily collected through a personal survey, with the aid of a structured questionnaire (see Appendix), conducted from December 2010 to January 2011. The questionnaire was divided into four main components: public rental unit information, quality of life, home modifications and personal information. Public rental unit questions are non-threatening questions placed at the beginning of the questionnaire to obtain responses regarding the respondents’ background, and history in public rental housing. The sections on life satisfaction level and Home modifications are the most important sections as they form the basis of analysis for the study. The questions are mostly presented in the form of a 5-point rating Likert scale with 1 being the “least satisfied” and 5 being “most satisfied”. The 5-point rating scale is used as it provides a sufficient range to measure different degrees of satisfaction.
The section on Personal information is placed last as it covers sensitive questions such as their income level and job type. Any potential resentment that might have been provoked by these questions would not influence responses to prior questions.
The sample population consists of elderly Singaporeans living in public rental housing at the time of the survey. A list of 124 public rental blocks in Singapore was obtained from an HDB branch office. A total of 12 blocks—three each from East, North, Central and West Regions of Singapore—were selected through random sampling. The random sampling was carried out with the use of Microsoft Excel to ensure that each block had an equal chance of being chosen by the system. The Random Sample Selection tool in Excel prevents biasness to provide results that are representative of the population. There were a total of 403 responses to the survey.
As some of the elderly had difficulties completing the survey independently, questions were posted to them in languages like Mandarin and other dialects. In addition, photos of relevant home features and modifications were shown to them during the survey to facilitate the process. The data were analyzed via binary logistic Regression and factor analysis.
5. Results
About 59% (238) and 41% (165) of the respondents respectively are females and males. The majority of the respondents (73.9%) are Chinese, 4.4% are Malays and 11.7% are Indians. Furthermore, 51.1% (206) are widowed, 24.07% (97) are married, 3.23% (13) are separated/divorced and 15.63% are singles (i.e. never married). Some married respondents stated that they have no children to take care of them while many others said that their children are unwilling to support them financially—a striking evidence of the breaking down of filial piety.
The median age for the respondents is 74.46, the youngest and the oldest being 65 and 93 respectively. Out of the 403 respondents, 307 (76.2%) are immobile or have some illnesses or disabilities. Only 96 (23.8%) claimed to be healthy. It was observed during the survey that some immobile elderly respondents were crawling around in their flats. Some of these immobile elderly people stated that they cannot afford wheelchairs. Thus, when there is a need for them to get out of their flats, they have to borrow wheelchairs from their neighbours.
5.1. Income
HDB has stipulated that the income ceiling for the application of a public rental unit is S$1500 per month. The results of the survey show that while the highest income earned by an elderly person in the survey group is S$1500, some of them do not have any earnings. The average monthly income of the respondents, according to the survey, is S$224.58, ranging from zero to S$1500. Those with earnings have multiple sources as shown in Table 3.
Although some of the respondents enjoy regular withdrawals from their Central Provident Fund (CPF) or pension funds, the amount cannot offset their expenditure. Others stated that as they were mostly engaged in low-skilled or odd jobs in the past, they failed to contribute to their CPF accounts. As a result, these elderly Singaporeans have no retirement benefits. Some of the respondents stated that although they receive government assistance (either one time-off or regularly), the cash amount can be as little as $20 per month.
Only 145 (35.98%) are employed while 258 (64.02%) are unemployed due to immobility and/or ill health. Those employed are engaged in odd-jobs, cleaning, etc. (see Table 4). Others are part-time social workers and taxi drivers. As observed by Seah [29] , Singapore is a tough place for elderly folk as they are not equipped with the skills for a modern economy.
On the whole, the survey results suggest that an elderly person living in these public rental housing is likely to be a widowed Chinese female, of an average age of about 75. Her main source of income is most probably government’s public assistance, and she is likely to be immobile or have some illnesses or disabilities and thus, unemployed. Faced with financial difficulties and immobility, the elderly people residing in public rental housing need assistance. Home modifications appear to be a pragmatic solution as it allows them to age-in-place [30] in a housing environment that suits their lifestyle.
Table 3. Sources of income for the elderly.
Table 4. Job type among the elderly.
5.2. Preferred Modification Items in Rental Units
Table 5 shows that the two most preferred unit modification items among the elderly respondents are non-slip flooring (85.4%) and stainless steel grab bars in the toilet (79.1%). These items are favored by the elderly respondents as they are prone to falls. As Straits Times [31] reports, the number of elderly who were injured due to falls increased by 20% from 2008 to 2010. In 1996, falls were also one of the three most common reasons why elderly persons were admitted to the Emergency Department of Alexandra Hospital [32] .
Modifications such as gas sensors and smoke detectors are the least favored fittings in the living unit. This is due to the elderly respondents’ perceived difficulty in using these technological equipments which, according to the respondents, are too complex for their liking.
5.3. Preferred Modification Items in Neighborhood
Table 6 shows that in terms of elderly-friendly features in the rental blocks and neighborhood, grab bars along the corridors and void decks, and lights along the walkways are the two most favored items among the elderly respondents. They garnered 91.6% and 75.0% votes respectively. Again, this outcome aligns with expectation that grab bars and well-lit corridors promote a safer and secure environment for the elderly.
The least desired modifications to the vicinity are bigger block number plates, additional tables and chairs at void decks and bigger, glow-in-the-dark directional signage. The main reason for not wanting more tables and chairs at the void deck is that these items can impede the elderly persons’ movements, especially those who are wheel-chair bound. Furthermore, the respondents said that items like bigger number plates and directional signage are of not much use to them since they often stay home at night.
Table 5. Top chosen home modifications items within the living unit.
Table 6. Preference for home modification items in the neighbourhood.
5.4. Results of Logistic Model
Binary logit modeling was employed to identify the aspects of life which are significant in determining the level of life satisfaction among the elderly people residing in public rental housing. The responses gathered from Likert scale were adjusted to make each response take one of two possible results to suit binary logit modeling. Thus the two possible results are defined as:
yi/xi = 0 if response is 1, 2 or 3 on the Likert scale and 1 if response is 4 or 5 on the Likert scale Prior to the estimation of binary dependent variable model, overall satisfaction was placed first in the Equation Specification field, followed by a list of the regressors. This is to ensure that Overall Satisfaction level becomes the binary dependent variable (Y) on which the 21 independent variables (X) are regressed. The factors are: Elderly facilities in the vicinity, elderly features in the living unit, relationships with family, neighbors and caregivers, social inclusion, workmanship, size and design of the house, financial, psychological, physical and functional status, security and safety, estate cleanliness, noise level, air quality, dwelling atmosphere, transportation, consumer goods and services as well as medical services.
In order to test if “Elderly Features in the Unit” and “Elderly Facilities in the Vicinity” are significant factors of the level of life satisfaction among the elderly residents of public rental housing, it was hypothesized (null) that “Elderly Features in the Unit” (β1) and “Elderly Facilities in the Vicinity” (β2) do not have significant effect on the elderly residents’ life satisfaction. The alternate hypothesis state that these features significantly affect the elderly residents’ life satisfaction—
H0: β1 = 0 H1: β1 ≠ 0 and H0: β2 = 0 H1: β2 ≠ 0 Binary logistic regression was performed with Eviews 7.0 and the terms used to describe the 21 variables in the regression are explained in detail in Table 7. The regression results are presented in Table 8.
Table 7. Definition of terms of variables in regression model.
Table 8. Binary logit results—significance of various aspects of life on overall life satisfaction.
R-squared 0.656799.
“Elderly features in the living unit” has p-value of 0.0000 (Table 8). Therefore, at 1% level of significance, we can reject the null hypothesis to conclude that this variable statistically and significantly affect the life satisfaction level of the elderly residents of public rental housing. Similarly the probability value for “Elderly facilities in the vicinity” (p-value = 0.000) implies that this variable is a statistically significant determinant of the elderly respondents’ life satisfaction. In addition, “Social Inclusion”, “Workmanship” of the housing unit and “Physical status” of the elderly significantly affect the life satisfaction level of these elderly people (Table 8). Conversely, “estate cleanliness” and “noise” are the most insignificant predictors of the level of life satisfaction of the elderly.
5.5. Results of Factor Analysis
Having identified the significant factors that affect the level of life satisfaction among the elderly living in social housing, it is important to ascertain if there is a gap between the importance of these factors to the elderly and how satisfied the elderly are with the factors. Two analyses are carried out:
1) Current level of life satisfaction among the elderly residents and;
2) Their perceived level of life satisfaction if home modifications were made to the public rental housing.
For both analyses, six common factors (Table 9 and Table 10) have been identified for further analysis: Dwelling atmosphere, air quality, estate cleanliness, security and noise level relate to the “living environment of estate”. Elderly features in the living unit and in the vicinity relate to the “elderly-friendly condition” of the rental estate. Psychological, financial, physical and functional status describe the “personal well-being” of the
Table 9. Clustered factors and the level of satisfaction (current situation).
Table 10. Clustered factors and the level of satisfaction after modification.
elderly. Relationships with caregivers, neighbors, family and social inclusion depict the overall “interpersonal relationship” of the elderly people. Medical and transportation services as well as consumer goods and services relate to the “service provision” in the estate. Lastly, workmanship, size and design and layout of the flat are facets of “housing quality” of the rental flats.
KMO value of 0.818 and the p-value of Barlett’s Test of Sphericity of 0.000 indicate that the data from the survey are appropriate for factor analysis. The latent root criterion suggests a six-factor solution which explains 47.673% of the total variance (Table 9).
Five of these factors (i.e. “living environment”, “personal well-being”, “interpersonal relationships”, “housing quality” and “provision of goods and services”) concur with other studies done by Addae-Dapaah and Wong [14] and Loh [13] on the elderly residents in Singapore.
Factor 1 relates to the living environment of the rental housing estates. This factor accounts for 19.48% of the total variances. Among the five significant variables, “dwelling atmosphere” has comparatively the highest factor loading of 0.618. This implies that the satisfaction level among the elderly residents towards a comfortable living environment is slightly above average. In contrast, very few elderly folks are satisfied with the security level (0.537) of their neighborhood. This may be attributed to occasions where some elderly would loiter around, smoke, drink and gamble at the void decks of the rental blocks [33] .
The second factor relates to the elderly-friendly state of the social housing estate and it explains 6.435% of the total variances. Results from the logistic regression have identified “elderly features within the living unit” and “elderly facilities in the vicinity” as significant predictors of life satisfaction of the elderly residents of public rental housing. Unfortunately, the results of the factor analysis imply that only a minority of the elderly respondents may be satisfied with the elderly living conditions of their estate. This may be due to the fact that public rental housing is a heavily subsidized dwelling and each flat is merely a basic unit with few, if any, elderly-friendly features. In addition, it is highly likely that the elderly respondents do not have the financial capability to build sophisticated elderly-friendly features for themselves.
Factor 3 relates to the personal well-being of the elderly residents. The variables include “psychological well-being”, “financial status”, “physical health” and “functional status”, with factor loadings of 0.612, 0.379, 0.356 and 0.328 respectively. This factor is able to explain 5.707% of the total variances of the elderly respondents’ life satisfaction. Among these four variables, the majority of the elderly residents are satisfied with their psychological well-being and this may be due to the fact that they are surrounded by counterparts of similar background and status. They are able to integrate better with one another, contributing to an overall mentally healthy population.
On the other hand, a few elderly are satisfied with their physical and functional status. While physical status has been identified as a significant factor by the regression model, the low satisfaction with this factor could be attributed to the deterioration of health as a person ages. Many of the respondents are wheelchair-bound and their functional mobility may be limited.
Factor 4 relates to the interpersonal relationship of the elderly. All four variables have low factor loadings, and “relationship with caregivers” has comparatively the highest loading of 0.545. Together with “relationships with neighbors” and “social inclusion” (with factor loadings 0.397 and 0.387 respectively), they explain 5.595% of the total variances. The contribution of this factor to life satisfaction, from the factor analysis, is at odds with the results of the logistic regression which finds this factor to be a significant predictor of life satisfaction among the elderly people. This can be explained by the fact that the limited mobility of the elderly people impedes their connecting with one another as well as integrating with the community. As a result, the elderly people may find themselves to be shut out from society.
Factor 5 accounts for 5.352% of the total variances and consists of variables relating to the provision of services in the estate. Provision of “consumer goods and services” has a loading of 0.415 while “medical services” have a loading of 0.390. On the whole, the elderly are generally not satisfied with this factor. These services are mostly found in shopping plazas located outside their neighborhood. Thus the elderly has to travel for long distances for such services. This poses inconveniences to the elderly, especially the wheelchair users.
The last and sixth factor relates to the quality of the rental units. The variables are “workmanship” and “size” of flat, which have respective factor loadings of 0.364 and 0.324 respectively. Again, this suggests that the old folks are not very pleased with the housing quality. The floor area of a 1-room unit is 35 m2 and that of a 2-room unit is 45 m2. Some of the elderly, especially those who are residing with a partner under the Joint Singles Scheme, may desire privacy but are constrained by the small-sized flats.
From the results of the factor analysis, there is much room for improvements with regard to the various aspects of life of the elderly resident of public housing in Singapore. This is especially so for five specific variables, “elderly features in the living unit”, “elderly facilities in the vicinity”, “social inclusion”, “physical mobility” and “workmanship” of the flat which have been identified by the Binary Logistic regression as significant predictors of the life satisfaction of the elderly.
5.6. Level of Satisfaction on Supposition That Home Modifications Were Made to Living Units and Vicinity
The same group of elderly was later asked for their predicted level of life satisfaction on the stated supposition that home modifications have been made to improve their living unit and estate. According to the results in Table 10, the latent root criterion suggests a six-factor solution which explains 50.037% of the total variance, an improvement from 47.67%. It is observed from the results that there is an increase in satisfaction level across most of the factors.
Factor 1 refers to the “living environment of the estate” and it explains 16.063% of the total variance. Comparing the findings from the two scenarios, the loadings for “estate cleanliness” decreases from 0.550 to 0.497, and this slight drop reflects the view that when elderly are able to travel more freely in the barrier-free estate, environmental hygiene may be compromised.
Factor 2 relates to the elderly-friendly condition of the estates and it explains 7.179% of the total variances. Home modifications (which are listed in the questionnaire) refer to elderly features and facilities aimed at improving the physical and social aspects of the elderly. The factor loadings of 0.787 and 0.754 for “elderly facilities in the vicinity” and “elderly features in the living unit” respectively indicate that the majority of the elderly residents will be very pleased with the elderly living condition of their estate after modifications.
Among the variables under factor 3 on “housing quality”, it is observed that “workmanship” has a higher factor loading of 0.511(compared to 0.364) while “size of the rental flat” has a lower loading of 0.306 (as compared to 0.324). The elderly respondents stated that although they will be satisfied with an improved living environment, they foresee that modifications will take up more space in their already small-sized units. Thus, while modifying their current housing to suit elderly lifestyle by the provision of elderly-friendly features could improve their life satisfaction, the reduction in the area of an already small unit size as a result of such modification could militate against any improvement in life satisfaction. A satisfactory trade-off may be difficult to achieve. Thus, modification of the rental units to suit elderly lifestyle may have to be accompanied by at least a proportionate enlargement of the units to achieve the desired result of improving the life satisfaction of the elderly residents. This will entail extra cost which the elderly tenants may not be able to afford. Government subsidy would appear to be the most practicable means of resolving the problem.
In relation to their personal wellbeing, which is represented by the fourth factor, achieving a barrier-free estate for the elderly can greatly increase their satisfaction level for the “functional” and “physical” aspects. The new factor loadings of 0.638 and 0.452 respectively imply that more elderly residents may be satisfied with these aspects of life. In terms of “functional” and “physical” aspects, the provision of elderly-friendly infrastructure should have an intended effect in allowing the elderly to maintain a higher level of independence.
Factor 5 relates to the “provision of services” which explains 5.369% of the variances. It is observed that variables “medical services” and “consumer goods and services” have higher factor loadings (of 0.545 and 0.430 respectively) as compared to the first finding. The elderly respondents to the survey commented that if their estates achieve barrier-free status, they will be able to travel further away from their immediate neighbourhood to enjoy a larger range of goods and services.
The last factor relates to the interpersonal relationships of the elderly with others which accounts for 4.843% of the variance. While “relationship with family” remains insignificant, “social inclusion”, with a loading of 0.404, is important. This may be due to the existence of more supportive elderly features that allow these senior folks to have more interaction with one another in the neighbourhood. Involvement and participation in activities enhance their relationships to give them a strong sense of social inclusion. Table 11 provides a comparative summary of the key observations.
5.7. Implications of Results of Factor Analyses
The results of factor analysis reveal that four variables namely, “noise level”, “relationship with family”, design and layout” and “transportation services” are somewhat inconsequential to the life satisfaction level among the elderly. This is true for both analyses on current and predicted levels of life satisfaction.
More importantly, the comparison between the two states in Table 11 suggests that the life satisfaction level among the elderly can be greatly improved if changes are made to their existing living environment to achieve a barrier-free status. Factors which have been identified as important to the elderly residents in the logit model will be provided if home modifications to their living environment became a reality to improve their life satisfaction level.
As Harrison [34] states, “older people often apologize because they are unable to use the built environment anymore—but it is the built environment (and more especially its creators) who should be apologizing to these older people for its inadequacy or hostility”. Therefore Singapore has room for improvement in creating a more elderly-friendly physical environment. This is especially so for the elderly living in social housing who have no financial means to help themselves in improving their immediate environments.
6. Overall Satisfaction
The measurement of overall life satisfaction is obtained by averaging the responses by the 403 elderly folks. Two questions were asked in relation to their overall life satisfaction given their current housing condition, and assuming that their housing were upgraded with the required modifications. As evidenced by the results in Table 12, the current living condition received a mean score of 2.692, which implies a rather low satisfaction level of life among the elderly folks residing in public rental housing. However, when the elderly were asked to predict their level of life satisfaction if improvements were made to improve their living environment, the mean score increased to 3.474. These results imply that home modifications can play a crucial role in improving the overall life of these needy elderly.
7. Conclusion
We set out to investigate how satisfied these poor elderly households in social housing are with their lives especially in relation to their housing in an attempt to finding measures to improve, where possible, the life satisfaction of this group of elderly Singaporeans. We used archival and empirical research for our investigation. The results from 403 respondents to our survey are analyzed through logistic regression and factor analysis. We find that the life satisfaction (mean score of 2.692 out of 5) of the elderly residents of social housing is very low.
Table 11. Comparison of key findings.
Table 12. Average score for overall life satisfaction.
There is more room for improvement. Factors that significantly affect their life satisfaction are elderly-friendly features and amenities in the housing unit and precinct, social inclusion, workmanship (i.e. quality of rental flat) and physical condition (i.e. ability to move about). Furthermore, we find that home modification that meets the requirements of the respondents will increase their life satisfaction mean score from the current 2.692 to perceived 3.474. Given that these elderly households neither have the right nor financial means to modify their housing units and precincts, it is incumbent upon the government, through the relevant authorities such as HDB, Town Councils and BCA to effect the necessary home modifications to create a more elderly-friendly physical environment to improve the life satisfaction of the elderly households in social housing in Singapore. This arguably is a social imperative which should not be subjugated to economic niceties as social housing is not a luxurious housing choice but the last safety net for basic shelter. An inclusive society must provide for the needs of those who cannot help themselves, especially the poor elderly people.
References
- World Health Organization (2011) Definition of an Older or Elderly Person. WHO. http://www.who.int/healthinfo/survey/ageingdefnolder/en/index.html
- Lee, B. (2008) Ageing Population May Hurt Singapore Most. Asiaone Business, Singapore City. http://forums.vr-zone.com/chit-chatting/294568-news-ageing-population-may-hurt-singapore-most.html
- (2008) UBS Report on Singapore Ageing Population. The Straits Times, 28 June 2008.
- Department of Statistics (2010) Key Indicators on the Elderly. Department of Statistics, Singapore City. http://www.singstat.gov.sg/publications/publications_and_papers/cop2010/census_2010_advance_census_release/key.pdf
- Department of Statistics (2010) Key Annual Indicators 2010. Department of Statistics, Singapore City. http://www.singstat.gov.sg/publications/publications_and_papers/cop2010/census_2010_advance_census_release/key.pdf
- Committee on Ageing Issues (2006) Report on the Ageing Population. MCYS, Singapore City. http://app.msf.gov.sg/Portals/0/Summary/research/CAI_report.pdf
- Zubaidah, N. and Vivien, H. (2010) National Family Council on Filial Piety TV Ad “Idea Was to Inspire Young”. Asiaone Business, Singapore City. http://www.asiaone.com/News/Education/Story/A1Story20100628-224204.html
- National Coalition for the Homeless (2009) Homelessness among Elderly Persons. National Coalition for the Homeless, Washington DC.
- The National Council for the Aged (1985) Housing of the Elderly in Ireland. The Glendale Press Ltd., Dublin.
- Whitehead, C. and Scanlon, K. (2007) Social Housing in Europe. London School of Economics and Political Science, London.
- World Health Organization (1997) Measuring Quality of Life. The World Health Organization Quality of Life Instruments, WHO.
- Xavier, M.F, Marcos, P.T., Norton, M., Norma, U.E. and Emilio, H.M. (2003) Elderly People’s Definition of Quality of Life. ANPEG of the Institute of Geriatrics and Gerontology of the Catholic University of the state of PUCRS, Porto Alegre.
- Brown, J., Brown, A. and Flynn, T. (2004) Models of Quality of Life. A Taxonomy, Overview and Systematic Review of the Literature. European Forum on Population Ageing Research, London. https://groups.google.com/forum/#!topic/abohabibas/Hoi0W-STeYI
- Loh, A.L. (2004) Impact of Age Segregation on the Quality of Life of Elderly in Studio Apartments. Department of Real Estate, National University of Singapore, Singapore City.
- Addae-Dapaah, K. and Wong, K.M. (2001) Housing and the Elderly in Singapore—Financial and Quality of Life Implications of Ageing in Place. Journal of Housing and the Built Environment, 16, 153-178. http://dx.doi.org/10.1023/A:1017960600667
- The National Resource Centre (2003) Supportive Housing and Home Modification. Home Modification Resource Guide. The National Resource Centre, Los Angeles.
- Berg, K., Hines, M. and Allen, S. (2002) Wheelchair Users at Home: Few Home Modifications and Many Injurious Falls. American Journal of Public Health, 92, 48. http://dx.doi.org/10.2105/AJPH.92.1.48
- USA Department of Health and Services (2008) Home Modifications: Use, Cost, and Interactions with Functioning among Near-Elderly and Other Adults. Assistant Secretary for Planning and Evaluation (ASPE) Office of Disability, Aging and Long-Term Care Policy, ASPE, Washington DC.
- Abu-Bader, S.H., Rogers, A. and Barusch A.S. (2002) Predictors of Life Satisfaction in Frail Elderly. Journal of Gerontological Social Work, 38, 4-17.
- Housing and Development Board (2011) Allocation of Rental Flat in Singapore. Housing and Development Board, Singapore City.
- People’s Action Party (2010) Straight Talk with Minister Mah Bow Tan, Minister for National Development. People’s Action Party, Singapore City. http://www.pap.org.sg/articleview.php?id=6163&cid=86
- Housing and Development Board (2011) Eligibility Conditions for Renting a Flat in Singapore. Housing and Development Board, Singapore City.
- Jrank Organization (2011) Definition of Poverty. Net Industries, Washington DC. http://family.jrank.org/pages/1314/poverty.html
- Ministry of Community Development, Youth and Sports (2009) State of the Elderly. MCYS, Singapore City.
- Department of Statistics (2009) Report on the Household Expenditure Survey 2007/2008. Department of Statistics, Singapore City.
- Ministry of Community Development, Youth and Sports (2010) Maintenance of Parents Act and Others—A “Kiasu” Approach. MCYS, Singapore City. http://app.msf.gov.sg/MSFNews/AmendmentstoMPAPassed.aspx
- Realtor (2009) The Importance of America’s Housing Sector to the Economy. National Association of Realtors, Washington DC. http://www.realtor.org/reports/state-by-state-economic-impact-of-real-estate-activity
- National Council of Social Service (2008) Social Trends, Scenario and Drivers for Change. Vision 2008—Towards 50 Years of Structured Social Services. NCSS, Singapore City.
- Seah, C.N. (2007) Elderly: Growing Old. The Star, 3 March 2007. http://www.littlespeck.com/content/people/CTrendsPeople-070304.htm
- Loh, F.R. (2001) Housing the Elderly in Singapore: A Pragmatic Approach. School of Building and Real Estate, National University of Singapore, Singapore City.
- Melissa, P. (2010) More Elderly Falling at Home. Digital Straits Times, Singapore City. http://www.straitstimes.com/BreakingNews/Singapore/Story/STIStory_582324.html
- Lim, H.J. and Yap K.B. (1999) The Presentation of Elderly People at an Emergency Department in Singapore. Singapore Medical Journal, 40, 12-14.
- (2010) Are Rental Flats That Bad? The Straits Times, 16 February 2010, B5.
- Harrison, J.D. (2001) The Physical Environment: Blessing or Curse for Senior Citizens? In: Into the Millennium of the Older Adult: Releasing Potentials and Erasing Prejudices, Gerontological Society of Singapore, Singapore City, 1 September 2001, 79-91.
Appendix: Questionnaire
A. Public Rental Unit Information
1) Region
2) Why are you residing in a public rental unit?
(You may select more than one reason)
(able but unwilling to rent a room from the open market)
(e.g, community centres for the old, fitness corner, etc.)
3) Who are you currently residing with?
4) Who were you residing with before shifting into your current unit?
B. Life Satisfaction
1) On a scale of 1 to 5, how satisfied are you with your current quality of life? 1 for very dissatisfied and 5 for very satisfied.
Very Dissatisfied Very Satisfied 1 2 3 4 5
2) Please rate the satisfaction level of the following factors to you and indicate your choice for each factor with 1 for least satisfied and 5 for most satisfied)
a) Relations with family 1 2 3 4 5 b) Relations with neighbours 1 2 3 4 5 c) Relations with caregivers 1 2 3 4 5
(e.g. volunteers)
d) Social Inclusion 1 2 3 4 5 e) Provision of elderly-friendly features 1 2 3 4 5
(e.g. grab bars in toilets, ramps)
f) Provision of elderly-friendly 1 2 3 4 5 recreational facilities
(e.g. senior citizens’ corner, fitness corner, pavilion)
g) Size of Living Unit 1 2 3 4 5 h) Workmanship of Living Unit 1 2 3 4 5 i) Design and Layout of Living Unit 1 2 3 4 5 j) Financial status 1 2 3 4 5 k) Functional Mobility 1 2 3 4 5
(e.g. independent living)
l) Physical Health 1 2 3 4 5
(e.g. loneliness, depression)
m) Psychological Health 1 2 3 4 5
(e.g. illnesses, mobility)
n) Dwelling Atmosphere 1 2 3 4 5 o) Security and Safety 1 2 3 4 5
(e.g. freedom of movement, anti-slip floorings)
p) Noise level 1 2 3 4 5 q) Air Quality 1 2 3 4 5 r) Estate Cleanliness 1 2 3 4 5 s) Transportation services 1 2 3 4 5
(e.g. accessibility to MRT, bus stops)
t) Consumers goods and services 1 2 3 4 5 u) Medical Services 1 2 3 4 5
C. Home Modifications
1) Please tick the following home modification/s which you require/prefer:
(You may tick more than one item)
In the Living Unit
In the Vicinity
2) Assume that the above home modification/s that you prefer/require has/have been installed.
Please rate the satisfaction level of the following factors you would perceive and indicate your choice for each factor with 1 for least satisfied and 5 for most satisfied)
a) Relations with family 1 2 3 4 5 b) Relations with neighbours 1 2 3 4 5 c) Relations with caregivers 1 2 3 4 5
(e.g. volunteers)
d) Social Inclusion 1 2 3 4 5 e) Provision of elderly-friendly features 1 2 3 4 5
(e.g. grab bars in toilets, ramps)
f) Provision of elderly-friendly 1 2 3 4 5 recreational facilities
(e.g. senior citizens’ corner, fitness corner, pavilion)
g) Size of Living Unit 1 2 3 4 5 h) Workmanship of Living Unit 1 2 3 4 5 i) Design and Layout of Living Unit 1 2 3 4 5 j) Financial status 1 2 3 4 5 k) Functional Mobility 1 2 3 4 5
(e.g. independent living)
l) Physical Health 1 2 3 4 5
(e.g. loneliness, depression)
m) Psychological Health 1 2 3 4 5
(e.g. illnesses, mobility)
n) Dwelling Atmosphere 1 2 3 4 5 o) Security and Safety 1 2 3 4 5
(e.g. freedom of movement, anti-slip floorings)
p) Noise level 1 2 3 4 5 q) Air Quality 1 2 3 4 5 r) Estate Cleanliness 1 2 3 4 5 s) Transportation services 1 2 3 4 5
(e.g. accessibility to MRT, bus stops)
t) Consumers goods and services 1 2 3 4 5 u) Medical Services 1 2 3 4 5
D. Personal Information
1) Gender 2) Age sub-cohort 3) Race 4) Marital Status 5) Employment Status 6) Monthly income 7) Sources of income (You may tick more than one source)
NOTES

*Corresponding author.