Journal of Modern Physics
Vol. 2 No. 9 (2011) , Article ID: 7155 , 5 pages DOI:10.4236/jmp.2011.29134
Curie Temperature of Non-Stoichiometric Ni-Doped Lithium Tantalate
1Laboratoire Rayonnement & Matière-Equipe de Recherche Physique de la Matière et Modélisation, Faculté des Sciences et Techniques, Université Hassan 1er, Settat, Morocco
2Ecole Nationale des Sciences Appliquées, Université Hassan 1er, Khouribga, Morocco
E-mail: maaiderr@gmail.com, abdkhalill@yahoo.fr
Received January 7, 2011; revised March 15, 2011; accepted April 26, 2011
Keywords: Lattice Defect Structure, Vacancy Model, Ni:LiTaO3, Curie Temperature
ABSTRACT
Ceramics of Li0.98−xTa1.004−x/5O3 solid solutions with 0 ≤ x ≤ 0.20 are studied by a new theoretical approach. From the experience, we have proposed the new vacancy models which are able to describe substitutional mechanism in Ni-doped lithium tantalate. Calculations of the Curie temperature in Ni-doped non stoichiometric lithium tantalate reveal good correspondence with experimental results. The substitution mechanism of the doped compositions Ni in LiTaO3 crystal is discussed. So, the mechanism of phase transition due to thermal expansion of crystal is described.
1. Introduction
Lithium tantalate (LT) has in recent years been the object of intensive study, because of its large optic non-linearities and corresponding device potential in fields of electrooptic modulation, parametric oscillator, harmonic generator, etc.
LT compound is ferroelectric at room temperature. It’s uniaxial at all temperature, with only a single structural phase transition Para ferroelectric at about 660˚C, the precise value depending on the Li/Ta ratio [1] and which is close to a second order. Although LT does not have the perovskyte structure, his ferroelectric structure belongs to the space group R3c and can be considered as a superstructure of the α-Al2O3 corundum structure with Li+ and Ta5+ cations along the c-axis [2]. According to Abrahams and Keve [3], ferroelectricity in this compound is due to the displacements of both the Ta and Li ions goowithin the octaedric sites. LT is well-known to be narrow range non stoechiometric compound; the solid solubility range extends from about 46% to 50.4% mole Li2O at room temperature [4]. The Curie temperature TC decreases linearly with decreasing Li2O concentration [1,5], and with varying the doped oxide concentration [6-8]. Different defect models were proposed to account for the nonstoechiometry. Masaif et al. [9] studied the vacancy model in LT and found that the Li-sites vacancy model seems more probable than the Nb-sites vacancy model. The calculated and measured values show that the lithium vacancy model effectively describes the defect structure in nonstoichiometric lithium tantalite [10]. The oxygen vacancy model was eliminated because he cannot describe the density variation in function of the composition [7].
To find which defect is involved in this phenomenon, we have proposed a theoretical description of the defect structure in LT doped on the basis of a set of vacancy models combined with a ferroelectric phase transition theory. Several studies have been reported on the change in the curie temperature of the Lithium tantalate doped with different cations.
Torii et al. [6] studied the evolution of TC, as a function of doping in (Li1−xMx/2) TaO3 (M = Zn, Ni, Mg, Ca) solid solutions. They showed that TC increases with the c/a ratio of the hexagonal cell parameters.
Paul et al. [4] studied Ni and Co-doped LN and LT. Substitution mechanisms have been the subject of controversy and depend upon the Li/Nb (Li/Ta) ratio of the pure LN or LT, the chosen type of substitution and the nature of the doping cations [4,7,8,11,12].
Joo et al. [13] studied the crystallographic and dielectric properties of LiTaO3-based non-stoechiometric solid solutions substituted by trivalent ions (Li1−xM3+x/3) TaO3, M = Al, Cr, Fe, In and x ≤ 0.20. They showed that all phases obtained are ferroelectric at room temperature, the Curie temperature TC decreases when the composition deviates from LiTaO3. TC has been related to the size of the M3+ cations and to the axial ratio c/a.
Also Abdi et al. found that the Defect structure models for Mg-doped congruent lithium niobate (CLN) were generally based on the defect model proposed for undoped congruent crystals i.e. Nb-site vacancy or Li-site vacancy descriptions [14].
Several critical properties of these studied materials depend on clearly the defects in the lattice and the presence of impurities. The problem persists in use this material is their susceptibility to optical damage. Doping improves the physical properties of these compounds and serves to minimize damage.
![]() In this present article, we develop a work which consists of the theory Masaif et al. [9,10] by making a new theoretical approach to study compounds LiTaO3 doped. We propose quantitative and qualitative defect models in order to interpret some observed phenomena such as change of the Curie temperature and the substitution mechanism. We shall compare also the results experimental and theoretical obtained by applying this new theory in the study of the transition temperature of LiTaO3 doped with nickel.
In this present article, we develop a work which consists of the theory Masaif et al. [9,10] by making a new theoretical approach to study compounds LiTaO3 doped. We propose quantitative and qualitative defect models in order to interpret some observed phenomena such as change of the Curie temperature and the substitution mechanism. We shall compare also the results experimental and theoretical obtained by applying this new theory in the study of the transition temperature of LiTaO3 doped with nickel.
2. Theoretical Approach
While a theory of ferroelectric transition in the crystal LiTaO3 has been performed to understand and predict properties of this crystal [9] in this procedure, the solution of the dynamic problem of the crystal planes system exhibits the existence of the “soft mode” at the ferroelectric transition. These recent studies provide a useful understanding of the phase transition dynamic behaviour and the defect structure of LiTaO3. It allows to give a comparison between the calculated values and the experimental data of the Curie temperature for the three vacancy models.
The aim of our work is to examine the Curie temperature dependence on the non-stoichiometric LiTaO3 doped with Nickel (Ni). However, this approach manifests as a new tool to describe the substitution mechanism in the Ni doped lithium tantalate.
We suppose that ceramic samples of LiTaO3 are single crystal. Such an assumption is based on the experimental fact that the ferroelectric phase transition occurred in the ceramic samples which are formed by parallel planes along the polar “c” axis. In Figure 1, distances between planes (Li, Ta and O at T = 0 K) are denoted as follow: RO-O(b = 2.30 Å), RLi-O(R20 = 0.601 Å), RTa-O(R10 = 0.954 Å), RLi-Ta(R12 = b – R10 – R20) [15].
We avoid the detail of the theory of ferroelectric tran-
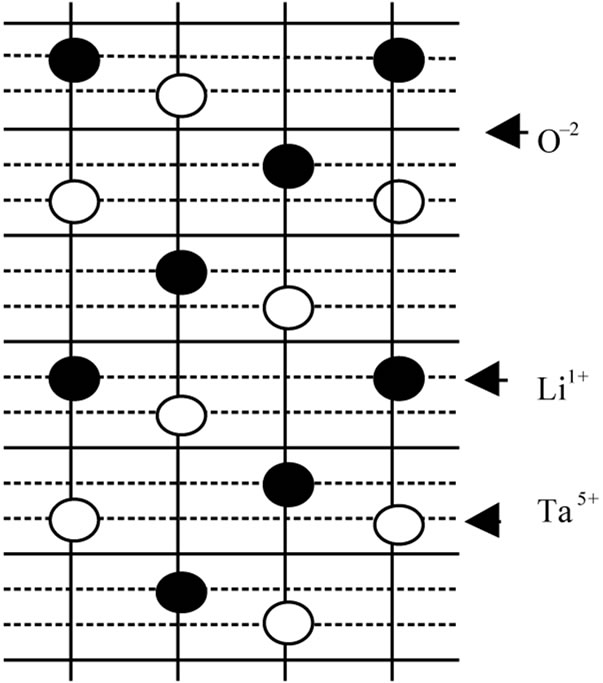
Figure 1. Different planes in an elementary cell of crystal LiTaO3.
sition in the doped ceramic LiTaO3 which is similar to that of reference and we report only the useful expressions in the appendix [9].
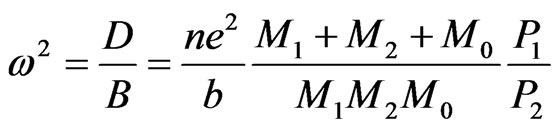
with 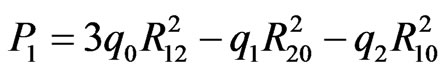
and 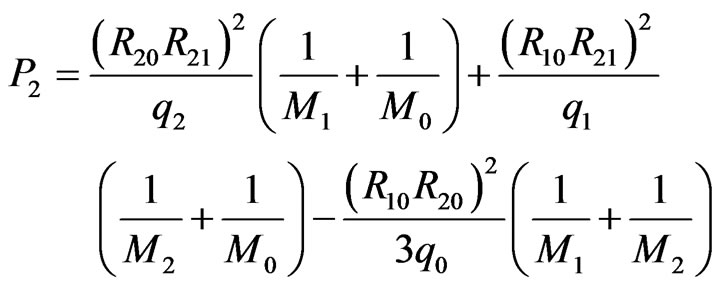 (1)
(1)
where M1, M2, M0 and M3 are the masses of elements Ta, Li, 3O and Ni; q1, q2, q0 and q3 are the electric charge of Ta5+, Li1+, O2– and Ni2+ ions, respectively.
At 0 K, the soft mode frequency, ω2, is proportional to the Curie temperature, Tc. Substituting ω2 by expression (1) to obtain the following relation that allows calculating the Curie temperature:
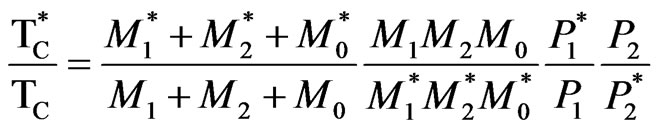 (2)
(2)
The element X represents the exactly stoichiometric compositions and X* is the nonstoichiometric doped compositions. This expression allows to determinate the Curie temperatures of the defect structure models. We analyse the doped structure effect on Curie temperature which depend on the ion masses, the charges and the distance between these ions. The above expression can now be used to analyse the vacancy models of the structure in lithium tantalate doped.
3. Vacancy Model
We remember that in passing of the state non-stoichiometric considered the state non-stoichiometric doped, all the physical quantities X (in particular the masses and the charges) are becoming functions of the composition x and the parameter doping y (X* x, y)).
According to the literature, we found that some authors like Paul [4], Katsumata [16] and Bennani [17] have insisted that the substitution mechanism changes with the concentration of Ni, determining the temperature transition Tc and ionic conductivity of ceramic LT, doped nickel.
The samples used in experimental studies [17] were prepared starting from Li2CO3 carbonate, Ta2O5 and NiO oxydes. The mentioned reagents weighted and mixed in the required amounts according to the following chemical reaction.
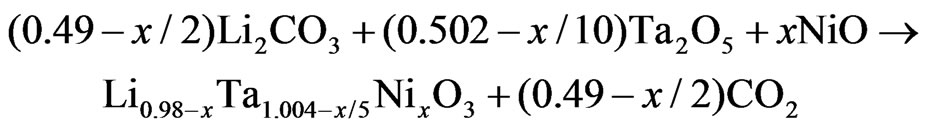
Table 1 shows the chemical analysed formulae and proposed. The number of vacancies was calculated by subtraction of the amount of cation sites, considering a main substitution mechanism 5Li+ + Ta5+ ↔ 5Ni2+. The errors in the formulae obtained were estimated to be about 0.8% for Li, 0.1% for Ta, and 0.5% for Ni.
We found that there are two substitution models in this structure doped non-stoichiometric. The first will be valid for the concentrations lower than 3% and the second, for those superior than or equal to 3%.Taking into account the experimental results [17], we have proposed two possible models for explaining the solid-solution mechanism of LiTaO3 doped. The first will be valid for concentrations% Ni < 3% (a) and the second for the concentration% Ni ≥ 3% (b).
Model (a): 
 (Ni < 3%)
Model (b): 
 (Ni ≥ 3%)
where, Ñ represent the vacancy. We represent these models, described previously, in the following condensed form,

and 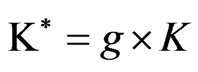
with = M, q and g = α, β. Here α and β allow the two models to be identified as follows:
1) Model (a) corresponds to α = 1 – 5x – 3y, α2 = 1y, β = 1 + x – y, β2 = 3y; and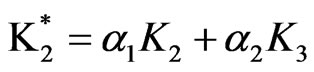 ,
, 
 and
and .
.
2) Model (b) corresponds to α = 1 + 5x – 13y, α2 = 0.5y, β = 1 – x + y, β2 = 3.5y; and ,
,  and
and .
.
In this representation α = β = 0 signified that ions and vacancies are absent in these non-stoichiometric models. In order to provide an adequate description of the structure LiTaO3 doped with Ni we have analytically performed the calculations of the Curie temperature as function of the composition x and y that we illustrate in Table 2. Estimate values of for LT have been obtained using the following values of charges and masses of ions q0
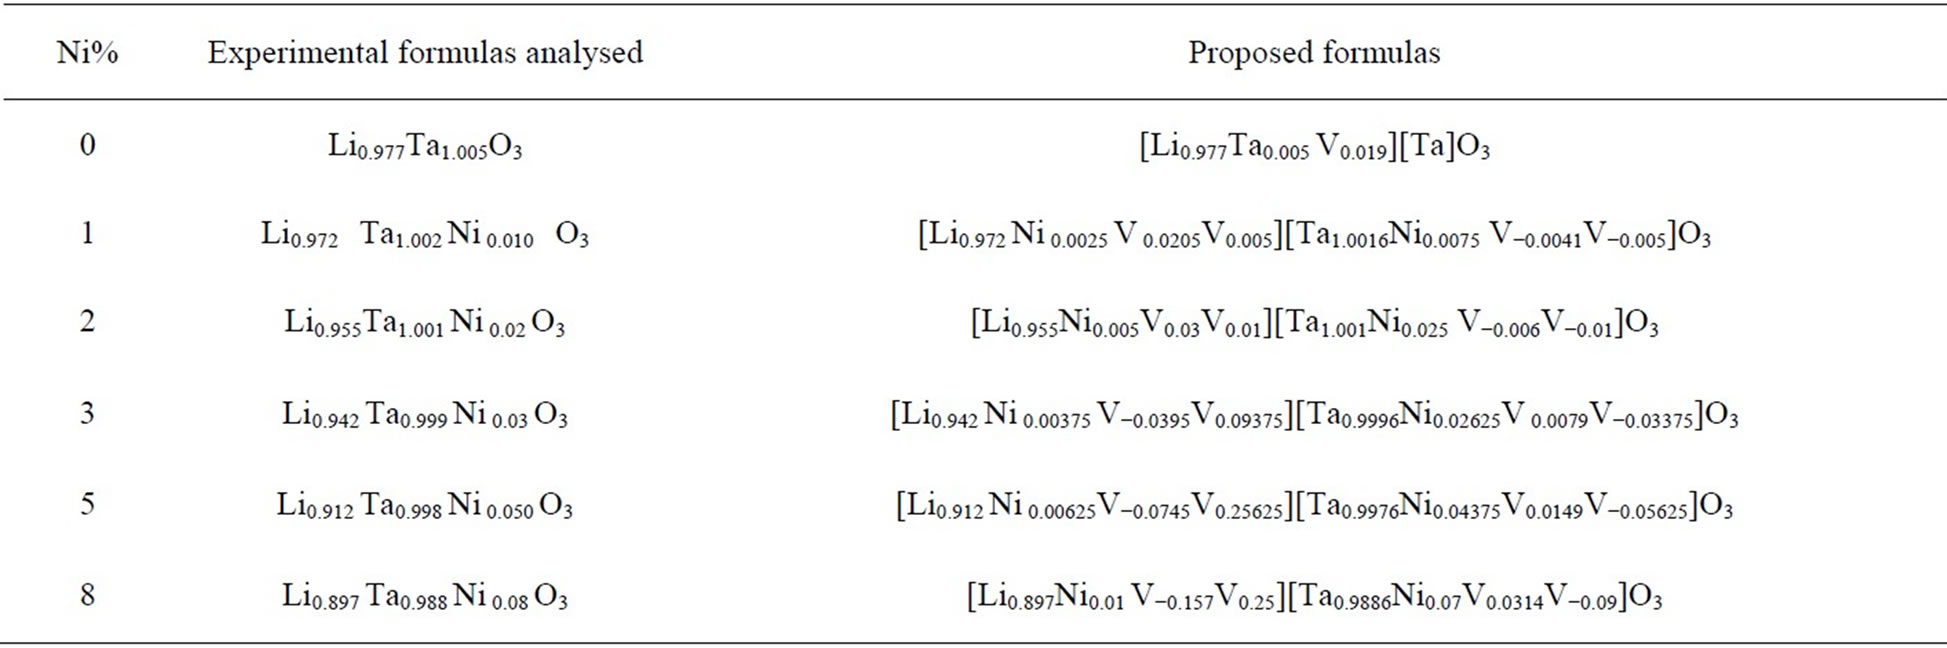
Table 1. Experimental chemical formulas [17] and proposed the LT doped nickel.
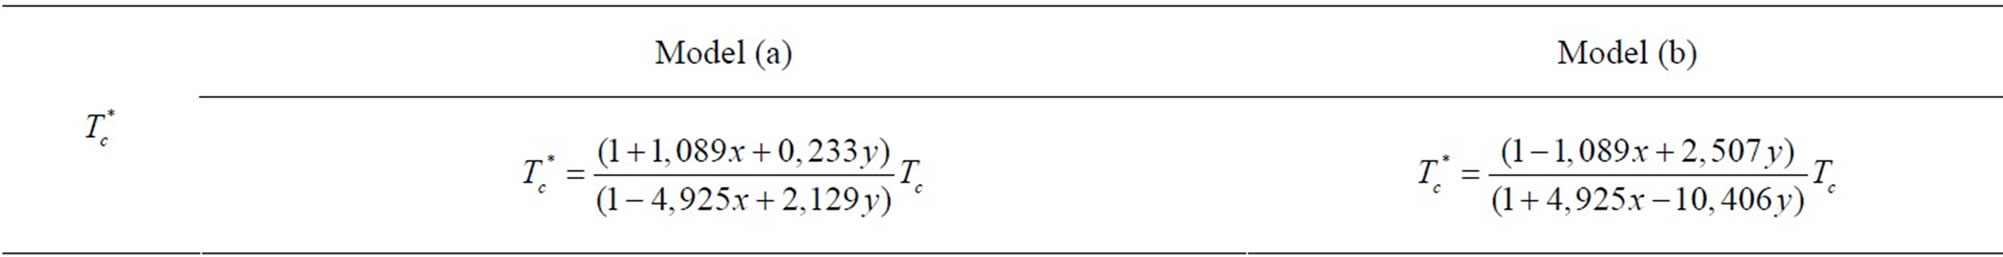
Table 2. The Curie temperature as a function of the nonstoichiometric composition x and rate doping y, (a) and (b) represent the vacancy models.
= 2, q1 = 5, q2 = 1, q3 = 2, M0 = 48, M1 = 180.95, M2 = 6.94, M3 = 58.
4. Results and Discussion
In principle, one could test these models by comparing the experimental results with the calculated values according to the theoretical approach previously mentioned. To explain the effect of doping on the Curie temperature, we have used the experimental data of the Curie temperatures and crystal parameters measured by Bennani and Husson [17].
To calculate the Curie temperatures suggested in Table 2, we needed to know the Curie temperature of the exact stoichiometric compositions. So, we used the following estimations of the Curie temperatures in stoichiometric lithium tantalate: 917 K [17], 928 K [18] and 913 K [19]. The average value of these three estimations is Tc = 919 K.
Tc increases with the Ni content as shown in Figure 2. There is a sharp increase of Tc between x = 0 and x = 0.025 and a weaker increase for x > 0.025.Comparing the measured Curie temperature for nonstoechiometric doped LiTaO3 with the two vacancy models ((a) and (b)); the results demonstrate clearly that the calculated values are in a good agreement with the data obtained by the experimental study.
The prepared pure LT should have the chemical formula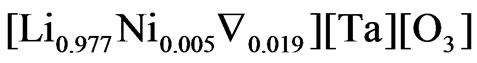 . When Ni cations are inserted in the lattice, it is thus probable that they are preferentially located on the lithium sites and replace the tantalum atoms. From the formulae given in Table 1, it is seen that this is obtained for a Ni content comprised between 2% and 3%. For higher Ni contents, Ni cations should be located on both Li and Ta sites. For example,
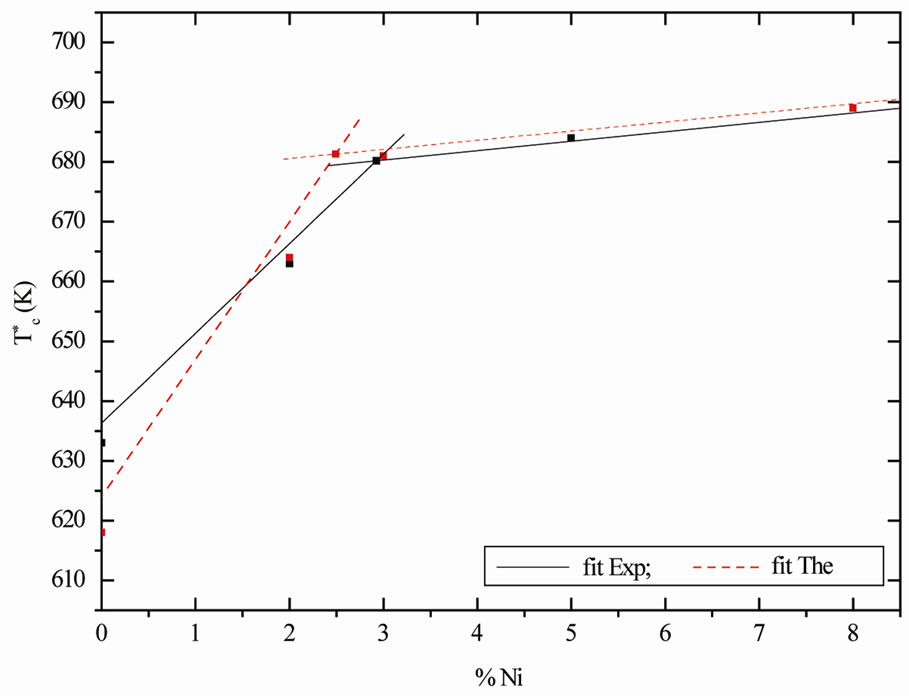
Figure 2. Comparison experimental and theoretical Curie temperature  as function of Ni content in the LiTaO3.
for Ni = 5% the formula should be 
 .
.
The results of our theoretically indicate that the change mechanism effect of the LiTaO3 occurs in the range 2.0 ~ 3.0 mole% of Ni this effect may be caused by the lattice defect or by the substitution of Ni in the some lattice sites.
The evolution of temperature as a function of (% Ni) shows a change of slope when the concentration exceeds 2.5 Ni mol% [19], this change may be related to the fact that we have a change of mechanism of substitution Ni in the lattice.
When Ni dopant concentration was lower than 3.0 mole%, TaLi ions were gradually replaced by Ni ions, thus the curie temperature will increase; otherwise, when Ni dopant concentration was higher than 3 mole%, all TaLi ions were replaced and Ni ions began to occupied LiLi site (normal Li site) and TaTa site simultaneaously, which made TaTa ions decreased, so this is in good agreement with the decrease from the Curie temperature slope.
5. Conclusions
We have presented Curie temperature as a function of the Ni content in the Ni-doped series. In this simple system, the theory of ferroelectric phase transition gives a good description of the experimental results. Application of the theory based on the structure simplified, combined with theoretical models vacancies (a) and (b), in Curie temperature is a fruitful way to describe the structure of Ni:LiTaO3.
A comparative study, between vacancy models and experimental values of the Curie temperature, shows that the vacancy models (a) and (b) is quantitatively and qualitatively imposed as the best model to interpret extrinsic defect structure in lithium tantalate.
6. Acknowledgements
We gratefully acknowledge financial support from the Ministry of Higher Education and the National Center for Scientific Research and Technology.
REFERENCES
- Y. Fujino, H. Tsuya and K. Sugibuchi, “Electrooptic and Ferroelectric Properties of Lithium Tantalate Single Crystals as a Function of Melt Composition,” Ferroelectrics, Vol. 2, No. 1, 1971, pp. 113-117.
- M. E. Lines and A. M. Glass, “Principles and Application of Ferroelectrics and Related Materials,” Clarendon Press, Oxford, 1979.
- S. C. Abrahams and E. T. Keve, “Structural Basis of Ferroelectricity and Ferroelasticity,” Ferroelectrics, Vol. 2, 1971, pp. 129-154.
- M. Paul, M. Tabuchi and A. R. West, “Defect Structure of Ni, Co-Doped LiNbO3 and LiTaO3,” Chemistry of Materials, Vol. 9, No. 12, 1997, pp. 3206-3214. doi:10.1021/cm970511t
- A. A. Ballman, H. J. Livinstein, C. D. Cupio and H. J. Brown, “Curie Temperature and Birefringence Variation in Ferroelectric Lithium Metatantalate as a Function of Melt Stoichiometry,” American Ceramic Society, Vol. 50, No. 12, 1967, pp. 657-659.
- Y. Torii, T. Sekiya, T. Yamamoto, K. Koyabachi and Y. Abe, “The Curie Temperature is Closely Related with the Axial Ratio c/a of the Hexagonal Cell,” Materials Research Bulletin, Vol. 18, 1983, pp. 1569-1574. doi:10.1016/0025-5408(83)90199-X
- N. Iyi, K. Kitamura, F. Izumi, J. K. Yamamoto, T. Hayachi, H. Asano and S. Kimura, “Comparative Study of Defect Structures in Lithium Niobate with Different Compositions,” Journal of Solid State Chemistry, Vol. 101, No. 2, 1992, pp. 340-352. doi:10.1016/0022-4596(92)90189-3
- S. C. Abrahams and P. Marsh, “Defect Structure Dependence on Composition in Lithium Niobate,” Acta Crystallographica Section B, Vol. 42, No. 1, 1986, pp. 61-68.
- N. Masaif, S. Jebbari, F. Bennani, M. Hafid and A. Jennane, “Experimental and Analytical Study of Defect Structures in Nonstoichiometric Lithium Tantalate and Lithium Niobate,” Physica Status Solidi (B), Vol. 240, No. 3, 2003, pp. 1-9. doi:10.1002/pssb.200301895
- N. Masaif, S. Jebbari, F. Bennani and A. Jennane, “New Study of Defect Structure in Nonstoichiometric Lithium Tantalate,” Ferroelectrics Letters Section, Vol. 32, No. 1-2, 2005, pp. 7-22. doi:10.1080/07315170590963662
- J. A. Allemann, Y. Xia, R. E. Morriss, A. P. Wilkinson, H. Eckert, J. S. Speck, C. G. Levi, F. F. Lange and S. Anderson, “Crystallization Behavior of Li1–5x Ta1+xO3 Glasses Synthesized from Liquid Precursors,” Journal of Materials Research, Vol. 11, No. 9, 1996, pp. 2376-2387. doi:10.1557/JMR.1996.0301
- N. Iyi, K. Kitamura, Y. Yajima, S. Kimura, Y. Furukawa and M. Sato, “Defect Structure Model of MgO-Doped LiNbO3,” Journal of Solid State Chemistry, Vol. 118, No. 1, 1995, pp. 148-152. doi:10.1006/jssc.1995.1323
- G. Joo, J. Ravez and P. Hagenmuller, “Crystallographic and Dielectric Properties of LiTaO3-Based Non-Stoichiometric Solid Solutions Substituted by Trivalentions,” Revue de Chimie Minérale, Vol. 22, No. 1, 1985, pp. 18-23.
- F. Abdi, M. Aillerie, P. Bourson and M. D. Fontana, “Defect Structure in Mg-Doped LiNbO3,” Journal of Applied Physics, Vol. 106, No. 3, 2009, pp. 519-524. doi:10.1063/1.3190534
- M. E. Lines and A. M. Glass, “Principles and Application of Ferroelectrics and Related Materials,” Clarendon Press, Oxford, 1977.
- T. Katsumata, K. Shibata and H. Imagawa, “Lattice Parameters and Curie Temperature of Sintered Magnesium Doped Lithium Niobate,” Materials Research Bulletin, Vol. 29, No. 5, 1994, pp. 559-566. doi:10.1016/0025-5408(94)90046-9
- F. Bennani and E. Husson, “Impedance Spectroscopy Analysis of Pure and Ni-Doped Lithium Tantalate,” Journal of the European Ceramic Society, Vol. 21, No. 7, 2001, pp. 847-854. doi:10.1016/S0955-2219(00)00285-5
- S. C. Abrahams, J. M. Reddy and J. L. Bernstein, “Ferroelectric Lithium Niobate. 3. Single Crystal X-Ray Diffraction Study at 24˚C,” Journal of Physics and Chemistry of Solids, Vol. 27, No. 6-7, 1966, pp. 997-1012. doi:10.1016/0022-3697(66)90072-2
- A. Huanosta and A. R. West, “The Electrical Properties of Ferroelectric LiTaO3 and Its Solid Solutions,” Journal of Applied Physics, Vol. 61, No. 12, 1987, pp. 5386-5392. doi:10.1063/1.338279