Applied Mathematics
Vol.5 No.10(2014), Article
ID:46892,8
pages
DOI:10.4236/am.2014.510155
Particle Swarm Optimized Optimal Threshold Value Selection for Clustering based on Correlation Fractal Dimension
Anuradha Yarlagadda1, J. V. R. Murthy2, M. H. M. Krishna Prasad2
1Department of CSE, Jawaharlal Nehru Technological University Hyderabad (JNTUH), Hyderabad, India
2Department of CSE, University College of Engineering Kakinada (UCEK), Jawaharlal Nehru Technological University Kakinada (JNTUK), Kakinada, India
Email: anuradhayarlagaddag@gmail.com, mjonnalagedda@gmail.com, krishnaprasad.mhm@gmail.com
Copyright © 2014 by authors and Scientific Research Publishing Inc.
This work is licensed under the Creative Commons Attribution International License (CC BY).
http://creativecommons.org/licenses/by/4.0/


Received 28 April 2014; revised 28 May 2014; accepted 6 June 2014
ABSTRACT
The work on the paper is focused on the use of Fractal Dimension in clustering for evolving data streams. Recently Anuradha et al. proposed a new approach based on Relative Change in Fractal Dimension (RCFD) and damped window model for clustering evolving data streams. Through observations on the aforementioned referred paper, this paper reveals that the formation of quality cluster is heavily predominant on the suitable selection of threshold value. In the above-mentioned paper Anuradha et al. have used a heuristic approach for fixing the threshold value. Although the outcome of the approach is acceptable, however, the approach is purely based on random selection and has no basis to claim the acceptability in general. In this paper a novel method is proposed to optimally compute threshold value using a population based randomized approach known as particle swarm optimization (PSO). Simulations are done on two huge data sets KDD Cup 1999 data set and the Forest Covertype data set and the results of the cluster quality are compared with the fixed approach. The comparison reveals that the chosen value of threshold by Anuradha et al., is robust and can be used with confidence.
Keywords:Correlation Fractal Dimension, Fractal Dimension, Clustering, Particle Swarm Optimization, Data Stream Clustering

1. Introduction
Clustering is partitioning data into similar objects where each cluster can be a model for the similarity among data points in the cluster. Representing data by less number of clusters necessarily loses certain fine details as well large number of clusters may not give good results. Software and hardware advancement enabled an enormous growth in generation and storage of data in most diverse segments of society [1] [2] . That amount of gathered data is not useful by itself, requiring processing in order to extract relevant and useful information for further analysis by a domain specialist. These requirements motivated the researchers in the field of data stream mining [3] . The design and development of fast, efficient, and accurate techniques, able to extract knowledge from these huge data sets, too large to fit into the main memory of computers, pose significant challenges. First of all, data can be examined only once, as it arrives. Second, using an entire data stream of a long period could mislead the analysis results due to the weight of outdated data, considered in the same way as more recent data. Since data streams are continuous sequences of information, the underlying clusters could change with time, thus giving different results with respect to the time horizon over which they are computed.
Traditional clustering approaches are not sufficiently flexible to deal with data that continuously evolve with time, thus, in the last few years, many proposals to data stream clustering have been presented [4] -[14] . Aggarwal et al. [4] have been the first to address the problem of the impossibility to revise a data stream during the computation, and the evolving characteristics of stream data. They suggested that a stream-clustering algorithm should be separated in an online micro-clustering component, that gathers appropriate summary statistics on the data stream, and an offline macro-clustering component that makes use of the information stored to provide the clustering results. However, their algorithm, CluStream, being based on the k-means approach, finds only spherical clusters and needs to know in advance the number of clusters. Since density-based clustering [15] overcomes these limitations, the density-based framework has been recently extended to the two-phase scheme described above [16] . All these methods use the fading data model to deal with the evolving cluster distribution and discover changes in stream data.
New concepts may keep evolving in data streams over time. Evolving concepts require data stream processing algorithms to continuously update their models to adapt the changes [17] . Fractal dimension is a powerful tool to describe self-similarity, and changes in the correlation dimension imply changes of data distribution, which can be used to indicate changes in data trends. Summaries of the processed data help in computing important statistics of new clusters with the arrival of new points [18] .
In data stream mining algorithms should handle online clustering meritoriously and should maintain the clusters considering the potentiality of clusters. Time plays a major role in data stream clustering as a data point belonging to a cluster in some time horizon can become an outlier; in some other time horizon as most recent data plays an important role. The algorithm [19] uses Correlation Fractal dimension for finding arbitrary shaped cluster and further improving the precision of clustering. In [19] data points are merged into a cluster if the relative change in the Fractal dimension (RCFD) is less than a minimum threshold value and a new cluster is created if the condition is not satisfied. If no points are added to any of the clusters within a stipulated time horizon, then they are considered as real outliers. However the success of algorithm [19] is heavily dependent on the proper tuning of the Threshold value. In our proposed approach a novel scheme for choosing optimal threshold value is suggested. In a suitable range of threshold values that is derived from the various studies, the best minimum threshold value is chosen with the help of a population based randomized optimization technique known as Particle Swarm Optimization (PSO). The benefit of the proposed method is demonstrated in this paper.
The rest of the paper is organized as follows. Section 2 describes the basic concepts described in the algorithm for clustering data stream using correlational fractal dimension [19] . An issue related to minimum threshold selection is given in section 3. Section 4 gives the proposed strategies for selecting minimum threshold. Experimental results and comparisons of the results with other methods are discussed in section 5 and conclusions are given in section 6.
2. Basic Concepts as Described in Clustering Based on Correlation Fractal Dimension [19]
Fractals are self-similar objects. Cluster is a group of more similar objects. Fractal Dimension is the measure for creating a cluster [19] . A multi layered nested grid structure which stores the statistics of data is constructed for finding the Fractal dimension [20] . Fractal Dimension of data set is calculated easily based on number of data points included by each of the lowest grids of a multi-layered Grid, by scanning the data set only once. Squared sum of the number of occupancies in each cell is found out for different cell sizes in the multi layered Grid. The linear part of the slope obtained from the curve between logarithm of the cell size and logarithm of the squared sum of the occupancies is the fractal dimension.
Cluster partitions on evolving data streams are often computed based on certain time intervals (or windows). There are three well-known window models: landmark window, sliding window and damped window. In order to meet the requirements of evolving data stream, we adopt basic window technology based on sliding window model [14] . Each data point is associated with time stamp in an evolving data stream. A time window of data point is added to the low level cell thus obtaining the number of occupancies in the cell. A damped window model is considered to manage huge volumes of data and subsequently the memory. In damped window model, it is assumed that each data point has a time-dependent weight defined by the function f(t) given by equation (1). The function f(t) is also referred to as the fading function and is a non-monotonic decreasing function which decays uniformly with time t and defined in equation (1) [4] . Suppose the initial time of the current window is to and the numbers of points are no, n1, …. ne at to, tl, … te time respectively, the weight of the current window is calculated as equation (2).
 (1)
(1)
 (2)
(2)
Definition 1: (Correlation Fractal Dimension )Given a data set containing N data points which show selfsimilarity in the range of scales (rmin,rmax), the correlation fractal dimension D2 [21] is measured as follows
 (3)
(3)
where Cr,i is the occupancy with which the data points fall in the ith cell when the original space is divided into grid cells with sides of length r. The relative fractal dimension change in more accurate in describing the change in pattern of the data set to form a new cluster. In order to measure the change in fractal dimension that corresponds to the change in patterns, we formally define relative fractal dimension change, RCFD [19] [22] . The smaller the RCFD the greater is the self-similarity with in a cluster otherwise it implies low self-similarity.
Definition 2: (Relative Change in Fractal Dimension, RCFD) Given data stream S, cluster c, and a new cluster c’ formed by joining a new set of data points. fd(c) is the fractal dimension of the old cluster, c and fd(c’) is the fractal dimension of the new cluster, cꞌ. Relative change in the fractal dimension is defined as follows
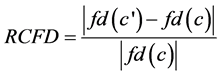 (4)
(4)
Here fd refers to correlation fractal dimension D2, which can reflect the data distribution and indicate the change of data trend.
The main idea behind FractStream [19] , an algorithm for online clustering the data streams using Correlation Fractal Dimension which is an incremental grid-based clustering technique, is to group points in a cluster in such a way that none of the points in the cluster changes the cluster’s fractal dimension radically making it more self-similar. After initializing a set of clusters, the algorithm incrementally adds points to the existing clusters, if RCFD is within a threshold else create a new cluster. To reduce the search for clusters in which new point fits, a concept of prioritizing the clusters is developed by introducing a concept of Core Fractal Cluster, CFC, Progressive Fractal Cluster, PFC and Outlier fractal cluster, OFC. The algorithm for clustering the data stream is divided into two phases—the online phase and the offline phase. In the online phase authors present two steps, Initialization step and incremental step. Initialization step finds core clusters and in the Incremental step online clustering is performed based on RCFD. Weights of the clusters are calculated and updated, and in the offline phase the clustering is performed as demanded by the user.
Algorithm 1 Online Clustering (p1, p2, … pk)
Consider a window of data points p1, p2, … pk
Normalize Data points While stream not end.
For all Core Fractal Clusters, CFCi
CFCi’ is the new cluster formed after placing the points in CFCi
Compute new fractal dimension of CFCi’
If RCFD < €
Then merge {p1, p2, … pk} to CFCi.
Update weight w.
else For all Progressive Fractal Clusters PFCi
PFCi’ is the new cluster formed after placing the points in PFCi
Compute new fractal dimension of PFCi’
If RCFD < €
Then merge {p1, p2, … pk} to PFCi.
Update weight w.
else For all Outlier Fractal Clusters OFCi
OFCi’ is the new cluster formed after placing the points in OFCi
Compute new fractal dimension of OFCi’
If RCFD < €
Then merge {p1, p2, … pk} to OFCi.
Update weight w.
If wo (new weight of OFCi) > βµ
Then remove OFCi from outlier hash table and create a new progressive Fractal Cluster by PFCi.
end if else Create a new Outlier Fractal Cluster with {p1, p2, … pk} and insert it into outlier fractal clusters hash table.
end if.
end if.
Ÿ At first, we try to insert the points into all CFC. We compute the Relative change in the fractal dimension, RCFD. Insert the points into that cluster whose RCFD change is within a minimal threshold and remove the points from rest of the CFC. If w is below µ and above βµ it means that CFCi has become a progressive Fractal cluster. Therefore, we remove CFCi from the Core Fractal buffer and create a new Progressive Fractal Cluster by PFCi.
Ÿ Else, we try to insert the points into all PFC. We compute RCFD. Insert the points into that cluster whose RCFD change is within a minimal threshold and remove the points from rest of the PFC updating the weight of the cluster.
Ÿ Else, we try to merge points into all OFC and compute RCFD. Insert the points into OFC whose RCFD is within the minimum threshold and remove the points from rest of OFC. And then, we check w the new weight of OFC. If w is above βµ it means that OFCi has grown into a progressive Fractal cluster. Therefore, we remove OFCi from the outlier-buffer and create a new Progressive Fractal Cluster by PFCi.
Ÿ Otherwise we create a new Outlier fractal cluster OFCi by basic window of points and insert the points into the outlier-buffer. This is because these points do not naturally fit into any existing Fractal clusters. These points may be an outlier or the seed of a new cluster.
Ÿ The weight of all the clusters needs to be checked periodically, because if no points are added to the clusters then the weight reduces as time passes on. If the weight of PFCi is below βµ, then it is no more progressive and should be deleted to release the memory space for new PFC’s. As data streams advances the number of Outlier fractal Clusters also increases. So OFC’s are to be restored which are potential to grow into PFC deleting the real outlier.
The clustering quality [19] is evaluated by the average purity of clusters which is defined as follows:
 (5)
(5)
where K denotes the number of clusters.  denotes the number of points with the dominant class label in cluster i. Ci denotes the number of points in cluster i. Intuitively, the purity measures the purity of the clusters with respect to the true cluster (class) labels that are known for our data sets.
3. Issues Related to Minimum Threshold Selection
The existing check of belongingness to a cluster based on the Relative Change in Fractal Dimension (RCFD) based on minimum threshold may have following concerns.
Ÿ There may be situations in which RCFD may be less than the minimum threshold value € in more than one base clusters
Ÿ There may be situations in which the incoming data point unnecessarily be created as a new cluster, i.e. outlier cluster instead of fitting into the right cluster.
To handle the above said problems a technique is proposed to choose the right threshold value. From studies it is seen that the threshold value is set from 0.02 to 2.50. If the € value is set to a greater value, the chances of belongingness of incoming set of data points to more than one base cluster increases. However at some instances a minimum value of € may cause creating unnecessary new cluster as outlier. Hence it is a big challenge to properly set the values of € within a given range for the effective creation of quality clusters. In our proposed approach we have adopted a popular evolutionary technique known as particle swarm optimization to compute suitable values.
4. Proposed Method
In this work the attempt is made to compute the most suitable value of € i.e. the threshold without compromising the quality of the clusters. Although there are several classical optimizing techniques such as Newton method, linear programming, Integer programming, quadratic programming etc. existing in the literature, the authors of the paper have chosen a population based randomized approach to address the above issue due to rich wide spread usages, applications and reported effectiveness of the techniques. Particle Swarm optimization (PSO) is one of the most well researched and used randomized techniques. In our work PSO is taken as the basic frame work for developing optimal threshold value. In the section below an introductory explanation of PSO is presented followed by the approach of finding Threshold value using PSO.
PSO is a population-based search algorithm and is initialized with a population of random solutions called particles [23] . In this, each individual is treated as a volume less particle in a d-dimensional search space.
Ÿ The ith particle is represented as xi = (xi1, xi2, ... xid) where d is the dimension
Ÿ The best previous position (the position giving the best fitness value) of the ith particle is recorded and represented as Pi = (Pi1, Pi2, ... Pid). The best position of the particle alternatively can be expressed with a variable called as pbest.
Ÿ The index of the best particle among all the particles in the population is represented by the symbol g. And this can alternatively be expressed as a variable gbest.
Ÿ The rate of position change (velocity) for particle i is represented as Vi = (Vi1, Vi2 ... Vid).
The particle is manipulated according to the following equation:
 (6)
(6)

 (7)
(7)
where w is the inertia of weight, c1 and c2 are two positive constants, and rand( ) is a random function in the range (0,1) [24] . Pid is known as pbest and Pgd is known as gbest.
Algorithm 2 for implementing the global version of PSO to find the threshold value:
Step 1: Initialize population of particles with random positions and velocities on d dimensions in the problem space, evaluating the desired optimization fitness function in d variables, for each particle.
Step 2: compare particle’s fitness evaluation with particle’s pbest. If current value is better than pbest, then set pbest value equal to the current value, and the pbest location equal to the curent location in d-dimensional space.
Step 3: compare fitness evaluation with the population’s overall previous best. If the current value is better than gbest, then reset gbest to the current particle’s value.
Step 4: change the velocity and position of the particle according to the equations (6) and (7), respectively.
Step 5: loop to step 2 until the criterion is met, usually a sufficiently good fitness or a maximum number of iterations.
To optimally choose the minimum threshold value the above describe algorithm is used in our approach. The fitness function of the problem under study is the quality of cluster formed. The quality of the cluster is defined as the purity of the cluster as in equation (5). Each particle initialized in our work is used to evaluate the purity based on the concept of RCFD as described in the section 2. Accordingly the gbest of the swarm and the pbest of each particle are computed for further processing in the iterations. The algorithm runs for enough number of iterations till the best optimal value is obtained.
5. Results and Discussions
The proposed algorithm is implemented for choosing the optimal value of threshold. The range of threshold values are chosen in between 0.02 to 2.50 based on our observations of use from different related research papers. The current position and velocities are initialized in the above range. The maximum velocity is set to 1 for restricting the particles not to overshoot the selected search region.
The values of w, c1 and c2 are chosen as in [24] . The PSO model implemented for our simulation is restricted to g best model, where in each particle in the initialized pool communicates with each other particles of the pool. The simulation is terminated after running for maximum iterations of 100. The data sets chosen for simulation and comparison are the same in [19] . After applying PSO the optimal value of € is found to be 0.23. With this obtained value the clustering is performed on the data sets KDD Cup 1999 data set and the Forest Covertype data set based on Correlation Fractal Dimension as in [19] and the purity of the clustering is evaluated. The results are shown in Figures 1-4.
From the above result and results derived from [19] it is observed that both the approaches lead to competitive purity with almost threshold value. However the proposed approach has a merit over the approach adopted in [19] since it follows a very well defined strategy in computation. It may be noted that there is no systematic strategy used in [19] while computing the threshold value. Thus an obtained simulation result establishes the very fact of choosing the most optimal value for minimum threshold. However the value may vary if the evolved datasets change.
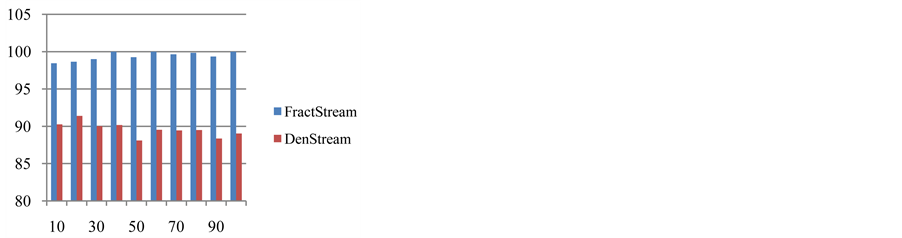
Figure 1. Clustering quality (Network Intrusion data set, horizon = 1, stream speed = 1000).
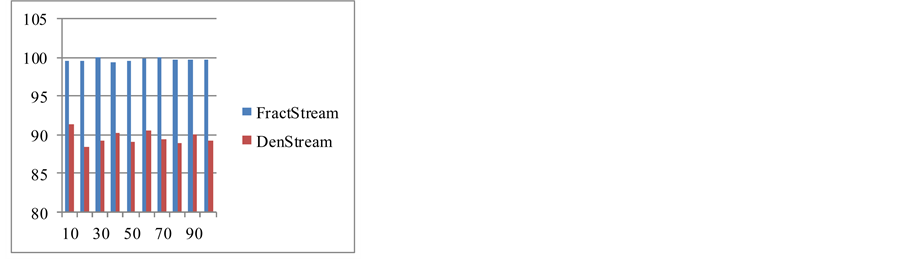
Figure 2. Clustering quality (Network Intrusion data set, horizon = 5, stream speed = 1000).
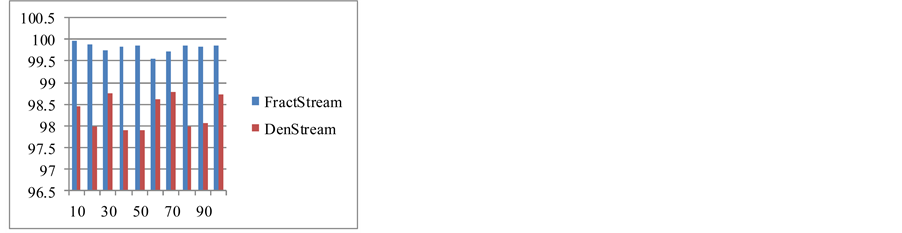
Figure 3. Clustering quality(Forest Covertype data set for stream speed = 1000 and horizon = 1).
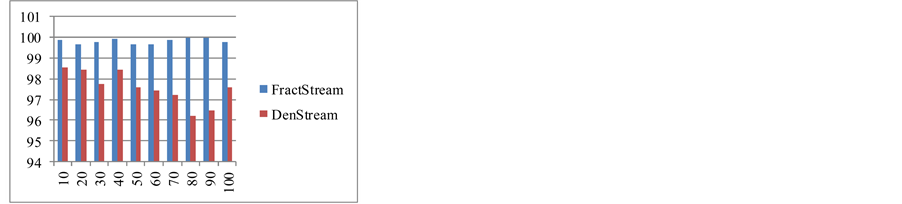
Figure 4. Clustering quality(the Forest Covertype data set for stream speed = 1000 and horizon = 5)
6. Conclusion
In this paper a new approach for suitably choosing a minimum threshold value that helps in identifying the appropriate group or cluster in RCFD based clustering technique is investigated. In [19] the minimum threshold is chosen as 0.23 from the references of various related literatures. Our work in this paper is mainly focused on verifying the validity of the above referenced value. An evolutionary based technique known as PSO is studied and implemented to optimize the minimum threshold value in the range of 0.02 to 2.50. This range is identified from the study of related papers on Fractal Dimension based Clustering. Two datasets known as KDD Cup 1999 data set and the Forest Covertype data sets are taken and the quality of the cluster known as purity is compared. From the analysis of the results a clear observation is made with respect to the value of the minimum threshold. It is clearly revealed that if minimum threshold value is set to 0.23 for the investigated data sets, the purity attains its maximum value. The comparisons of our minimum threshold value 0.23 with values identified by other methods shows that if minimum threshold lies in between 0.2 to 0.23, it can always provide good results. Hence it can be summarized that the minimum threshold is robust and can be used with confidence. However as the future course of research, it remains to be investigated if it fits well to other data streams as well.
References
- Aggarwal, C.C. (2006) Data Streams: Models and Algorithms (Advances in Database Systems). Springer, Secaucus.
- Gantz, J., Reinsel, D., Chute, C., Schlichting, W., McArthur, J., Minton, S., Xheneti, I., Toncheva, A. and Manfrediz, A. (2007) The Expanding Digital Universe: A Forecast of Worldwide Information Growth through 2010. Technical Report, 12, 634-638.
- Gaber, M.M., Zaslavsky, A. and Krishnaswamy, S. (2005) Mining Data Streams: A Review. SIGMOD Record, 34, 18-26. http://dx.doi.org/10.1145/1083784.1083789
- Aggarwal, C.C., Han, J., Wang, J. and Yu, P. (2003) A Framework for Clustering Evolving Data Streams. In: Proceedings of 29th International Conference on Very Large Data Bases (VLDB’03), Berlin, September 2003.
- Aggarwal, C.C., Han, J.W., Wang, J.Y. and Yu, P.S. (2006) On Clustering Massive Data Streams: A Summarization Paradigm. In: Aggarwal, C.C., Ed., Data Streams—Models and Algorithms, Springer, Boston, 11-38.
- Babock, B., Datar, M., Motwani, R. and O’Callaghan, L. (2003) Maintaining Variance and k-Medians over Data Stream Windows. Proceedings of the 22nd ACM Symposium on Principles of Data Base Systems, San Diego, 234-243.
- Barbará, D. (2002) Requirements for Clustering Data Streams. SIGKDD Explorations Newsletter, 3, 23-27. http://dx.doi.org/10.1145/507515.507519
- Beringher, J. and Hullermeier, E. (2006) Online Clustering of Parallel Data Streams. Data & Knowledge Engineering, 58, 180-204. http://dx.doi.org/10.1016/j.datak.2005.05.009
- Cao, F., Ester, M., Qian, W. and Zhou, A. (2006) Density-Based Clustering over Evolving Data Stream with Noise. Proceedings of the 6th SIAM International Conference on Data Mining (SIAM’06), Bethesda, 326-337.
- Charikar, M., O’Callaghan, L. and Panigrahy, R. (2003) Better Streaming Algorithms for Clustering Problems. Proceedings of the 35th Annual ACM Symposium on Theory of Computing (STOC’03), San Diego, 30-39.
- Chen, Y. and Li, T. (2007) Density-Based Clustering for Real-Time Stream Data. In: Proceedings of the 13th ACM SIGKDD International Conference on Knowledge Discovery and Data Mining (KDD’07), ACM, New York, 133-142.
- Guha, S., Meyerson, A., Mishra, N., Motwani, R. and O’Callaghan, L. (2003) Clustering Data Streams: Theory and Practice. IEEE Transactions on Knowledge and Data Engineering, 15, 515-528. http://dx.doi.org/10.1109/TKDE.2003.1198387
- Joao, G. (2009) An Overview on Mining Data Streams. Springer-Verlag, Berlin, Heidelberg, 29-45.
- Zhu, Y.Y. and Shasha, D. (2002) StatStream: Statistical Monitoring of Thousands of Data Streams in Real Time. Proceedings of the 28th International Conference on Very Large Data Bases, Hong Kong, 358-369.
- Ester, M., Kriegel, H.-P., Jrg, S. and Xu, X. (1996) A Density-Based Algorithm for Discovering Clusters in Large Spatial Databases with Noise. Proceedings of the 2nd ACM SIGKDD International Conference on Knowledge Discovery and Data Mining (KDD’96), Portland, 373-382.
- Tu, L. and Chen, Y.X. (2009) Stream Data Clustering Based on Grid Density and Attractions. ACM Transaction Knowledge Discovery Data, 3, 12:1-12:27.
- Guha, S., Mishra, N., Motwani, R. and O’Callaghan, L. (2000) Clustering Data Streams. In: Proceedings of the Annual IEEE Symposium on Foundations of Computer Science, Redondo Beach, 12-14 November 2000, 359-366.
- O’Callaghan, L., Mishra, N., Mishra, N. and Guha, S. (2002) Streaming-Data Algorithms for High Quality Clustering. Proceedings of the 18th International Conference on Data Engineering (ICDE’01), San Jose, 685-694.
- Anuradha, Y., Murthy, J.V.R. and Krishnaprasad, M.H.M. (2014) Clustering Based on Correlation Fractal Dimension over an Evolving Data Stream. Communicated to IJAIT 2014, unpublished.
- Anuradha, Y., Murthy, J.V.R. and Krishnaprasad, M.H.M. (2013) Estimating Correlation Dimension Using Multi Layered Grid and Damped Window Model over Data Streams. Procedia Technology, 10, 797-804. http://dx.doi.org/10.1016/j.protcy.2013.12.424
- Belussi, A. (1995) Estimating the Selectivity of Spatial Queries Using the Correlation Fractal Dimension. Proceedings of 21st International Conference on Very Large Data Bases, Zurich, 11-15 September 1995.
- Li, G.L., et al. (2011) Fractal-Based Algorithm for Anomaly Pattern Discovery on Time Series Stream. Journal of Convergence Information Technology, 6, 181-187. http://dx.doi.org/10.4156/jcit.vol6.issue3.20
- Kennedy, J.F. and Eberhart, R.C. (1995) Particle Swarm Optimization. Proceedings of the IEEE International Conference on Neural Networks, 4, 1942-1948. http://dx.doi.org/10.1109/ICNN.1995.488968
- Shi, Y. and Eberhart, R.C. (1998) Parameter Selection in Particle Swarm Optimization. Evolutionary Programming VII, Springer. Lecture Notes in Computer Science, 1447, 591-600. http://dx.doi.org/10.1007/BFb0040810