Paper Menu >>
Journal Menu >>
 Chinese Studies 2012. Vol.1, No.3, 18-22 Published Online November 2012 in SciRes (http://www.SciRP.org/journal/chnstd) http://dx.doi.org/10.4236/chnstd.2012.13004 Copyright © 2012 SciRes. 18 Impact of Soft-Input on the Cost of Resources and Environment in Economic Growth ——Empirical Research Based on Chinese Provincial Panel Data Chunling Pan, Jie Lü* The College of Economics and Management, Shenyang Agricultural University, Shenyang, China Email: panchunling91@163.com, *jieluesy@163.com Received May 31st, 2012; revised July 28th, 2012; accepted August 26th, 2012 China’s rapid economic growth has proceeded at considerable cost of resources and environment. To find out how to reduce the cost while maintaining economic growth, we took panel data of 28 provinces from 2000 to 2009 as our samples and conducted comparative analysis on the said cost among 28 provinces. From the perspective of soft-input, we subsequently examined soft-input’s influence on the cost of re- sources and environment of in economic growth (CREIEG). Results show that: government spending on scientific research and environmental protections has a significant role in reducing energy consumption and wastewater discharge, but it has limited impact on gas emissions and solid waste emissions reduction. Moreover, financial development also has a positive role in reducing energy consumption. Finally, we propose a number of initiatives to reduce the cost of resources and environment of economic growth based on the analysis results. Keywords: Soft-Input; Economic Growth; Cost of Resources and Environment Introduction China has sustained a rapid economic growth. Her per capita GNI, after exceeding $1000 for the first time in 2003, reached $1500 in 2004, and rose to $1740 in 2005 as a result of further improvement. Her world ranking rose from No. 138 in 2001 to No. 128 in 2005 (National Bureau of Statistics, 2010). However, China’s remarkable economic growth has proceeded at consid- erable cost of both resources and environment. Compared with developed countries, China has relatively low resource-reco- very rate. Likewise, her comprehensive utilization rate is also not high. Many usable and reusable resources have been wasted. China is now the world’s largest energy-consuming country, and also a country with the largest CO, SO2, CO2 emissions as well as other environmentally hazardous substances. The CO2 emissions in China in 2007 took up 22.3% of the total global emissions (293 million tons), which for the first time exceed the emissions in the United States (International Energy Agency, 2007). The question how to reduce environmental damage to the minimum while maintaining economic growth has become a focus of governmental as well as academic attention in Eco- nomists; however, mostly focus their attention on tangible fac- tors, such as capital, raw materials, and labor. These factors invariably have a material form, which is often known as hard- input. But economic growth is something larger than a combi- nation of physical and chemical processes. Human participation will give rise to factors in non-material form. These elements in non-specific material form are known as soft input among eco- nomists. They include system, technology, and so on. Com- pared with research on hard-inputs, there has been little re- search on soft input and its effect on the cost of resources and environment in economic growth (CREIEG henceforward) because of its unmeasured characteristic. In fact, soft-input has at least the same extent of impact on CREIEG as hard-input does. In summary, the impact of soft input on CREIEG is an im- portant economic issue in both theory and practice. Taking the fast-growing Chinese economy as a case study we use the pro- vincial panel data from 2000-2009 to examine the difference in CREIEG among the provinces under study, and to analyze the impact of soft-input on CREIEG. The rest of the paper is organized as follows: Section 2 is re- search design, including a brief introduction of variables, selec- tion of the regression model, and statistical characteristics of variables. Section 3 presents the empirical results. Section 4 is a section of conclusions and suggestions. Empirical Specifications Variable Definiti ons Dependent Variable We mainly investigate CREIEG’s dimensions of energy efficiency and pollution emission level. Energy Efficiency Indicators Energy consumption per unit GDP (Represented by enegdp) is the ratio of the total energy consumption (tons of standard coal) to Domestic (regional) GDP (million). Energy consump- tion per unit industry GDP (Represented by eneind) is the ratio of the total energy consumption (tons of standard coal) to do- mestic (regional) industrial GDP (million). And power con- sumption per unit GDP (Represented by eneele) is the ratio of the total electricity consumption (1000 kWh) to domestic (re- gional) GDP (million). *Corresponding author.  C. L. PAN, J. LÜ Pollution Emission Indicators Sewage emissions per unit GDP (Represented by watgdp) is the ratio of Sewage emissions (tons) to Domestic (regional) GDP (million). Gas emissions per unit GDP (Represented by gasgdp) is the ratio of gas emissions (standard cubic meters) to domestic (regional) production GDP (million). And solid waste emissions per unit GDP (Represented by solgdp) is the ratio of solid waste emissions (tons) to domestic (regional) GDP (mil- lion). Explanatory Variables Soft-input is the sum of non-material elements in addition to the material elements of the production process in certain economies. As defined in (Li, 1995), soft-input divides itself into the following three categories: comprehensive policy in- vestment, comprehensive science and technology investment, and the workers’ enthusiasm investment. Comprehensive policy investments include institutional policy and economic man- agement. Since it is difficult to quantify workers’ enthusiasm, this paper mainly examines the impact of comprehensive policy investment and comprehensive science-and-technology invest- ment on the environmental cost. Taking the literatures of (Jiang, Hou, & Liu, 2004; Chao, 2009; Cheng, 2010) and other studies as references, we mainly choose the following variables shown in Table 1. Regression Specification To test the effect of soft input on CREIEG, we use the fol- lowing regression specification: 01 234 567 8 gov open save edu scinonenv cap itititit it itititit it yaa aaa aaa a (1) In the specific regression analysis, we employ Stata statisti- cal software, using fixed effects methods to estimate the above parameters. Description of Variables All data in this paper came from “China Statistical Year- book” of Chinese National Bureau of Statistics over the years and “China Compendium of statistics”, results of variable de- scrip- tion are shown in Table 2. Table 1. Variable description. Variable Definition gov Government spending in addition to education divided by GDP open Total imports and exports divided by GDP save Financial institutions’ deposits at the end of year divided by GDP edu Government spending on education divided by GDP sci Government spending on scientific research divided by GDP env Government spending on environment protection divided by GDP cap Amount of share capital per Unit employees Table 2. Parameters variables’ summary statistics from 2000 to 2009. Variable Obs Mean Std. Dev. Min Max enegdp 150 1.53 0.77 0.61 4.14 eneind 150 2.81 1.55 0.81 9.03 eneele 150 1.52 0.95 0.68 5.71 watgdp 310 38.97 28.20 3.98 159.90 gasgdp 279 4.35 2.79 0.49 15.54 solgdp 310 2.45 1.93 0.21 10.89 gov 310 15.91 11.59 5.52 92.69 open 310 33.78 44.99 3.68 184.29 save 279 147.40 65.62 73.19 530.87 edu 310 2.76 1.50 1.30 13.83 sci 310 0.16 0.17 0.03 1.43 nonnat 93 58.05 18.31 19.81 89.16 env 93 0.70 0.53 0.09 2.68 cap 303 1.62 1.35 0.24 10.24 Source: National Bureau of Statistics, “China Statistical Yearbook” (2001-2010), China Statistics Press. Empirical Results Abbreviations and Acronyms Comparative Analysis of the Cost of Resources and Environment Provincial and Regional Energy Efficiency Comparison As shown in Table 3, energy consumption per unit of GDP in eastern provinces is much lower than in central and western provinces. For instance, energy consumption per unit GDP is very high in Shanxi, Qinghai, Inner Mongolia, and Guizhou. But the energy consumption per unit of industrial GDP and electricity consumption per unit GDP show similar geographi- cal characteristics. Therefore, from the perspective of energy consumption, CREIEG in eastern provinces is significantly lower than in central and western provinces. So, when they attempt to change the mode of extensive economic growth, central and western provinces face much more challenge than their eastern counterparts. Provincial and Regional Pollution Emission Comparison From Figure 1, we can see that pollution levels in central and western provinces are much higher than in eastern prov- inces. Such western provinces as Guangxi, Shanxi, and Chong- qing have a relatively high pollution level. From the perspective of environmental pollution, there is a big gap between central and western provinces on the one hand and eastern provinces on the other in terms of quality of economic growth. Therefore, economic growths in central and western cities are mainly relying on extensive development model due to their lower level of technology and management. While economic growth is inevitably accompanied by high energy consumption and thus high pollution, conditons in various eastern areas i Copyright © 2012 SciRes. 19 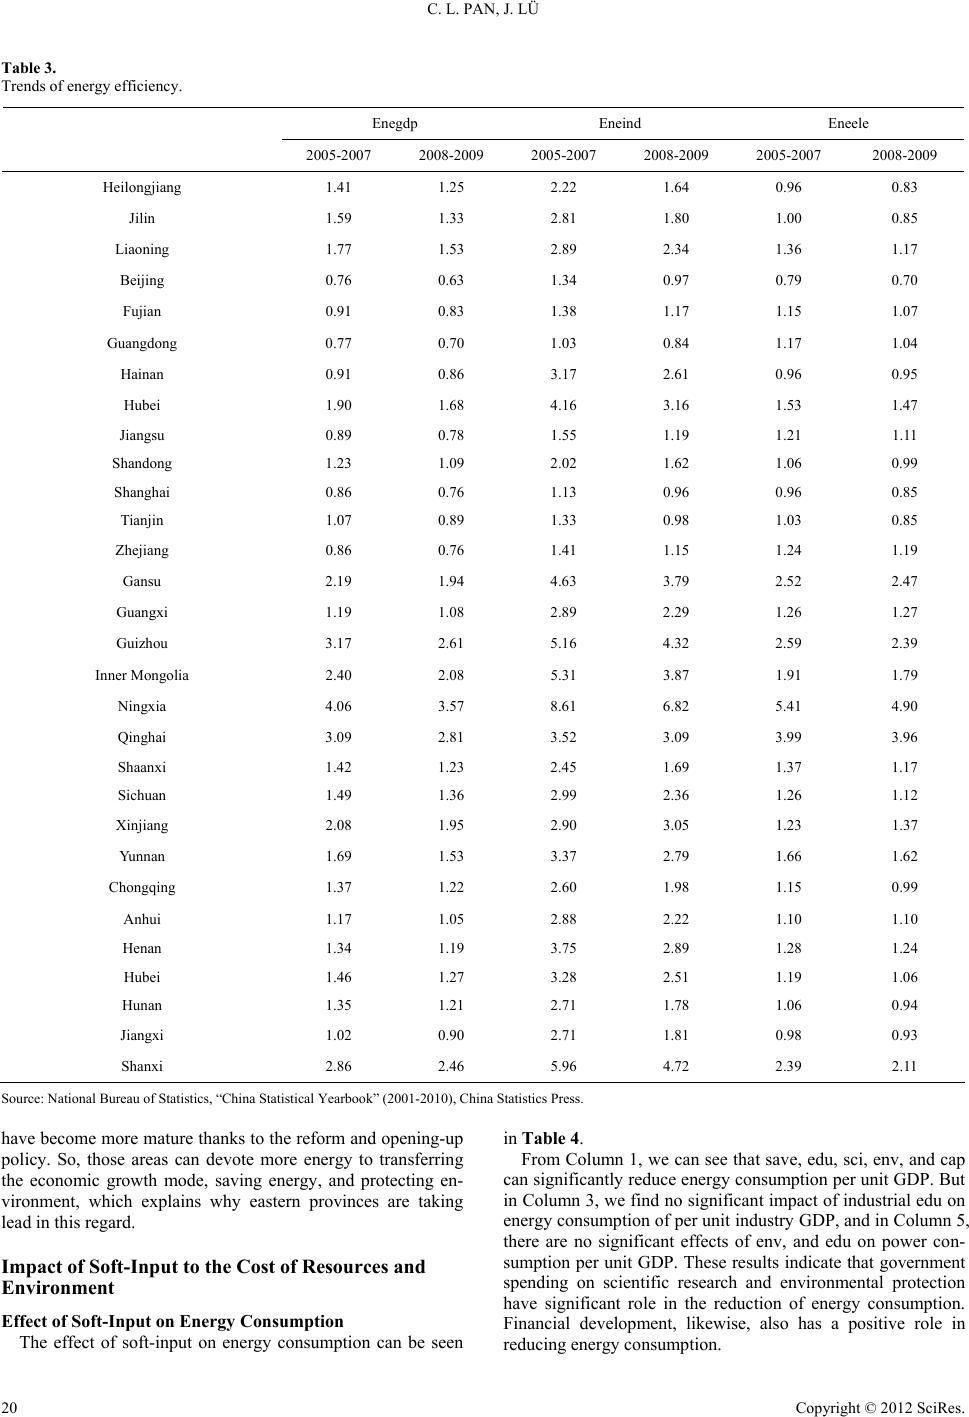 C. L. PAN, J. LÜ Copyright © 2012 SciRes. 20 Table 3. Trends of energy efficiency. Enegdp Eneind Eneele 2005-2007 2008-2009 2005-2007 2008-2009 2005-2007 2008-2009 Heilongjiang 1.41 1.25 2.22 1.64 0.96 0.83 Jilin 1.59 1.33 2.81 1.80 1.00 0.85 Liaoning 1.77 1.53 2.89 2.34 1.36 1.17 Beijing 0.76 0.63 1.34 0.97 0.79 0.70 Fujian 0.91 0.83 1.38 1.17 1.15 1.07 Guangdong 0.77 0.70 1.03 0.84 1.17 1.04 Hainan 0.91 0.86 3.17 2.61 0.96 0.95 Hubei 1.90 1.68 4.16 3.16 1.53 1.47 Jiangsu 0.89 0.78 1.55 1.19 1.21 1.11 Shandong 1.23 1.09 2.02 1.62 1.06 0.99 Shanghai 0.86 0.76 1.13 0.96 0.96 0.85 Tianjin 1.07 0.89 1.33 0.98 1.03 0.85 Zhejiang 0.86 0.76 1.41 1.15 1.24 1.19 Gansu 2.19 1.94 4.63 3.79 2.52 2.47 Guangxi 1.19 1.08 2.89 2.29 1.26 1.27 Guizhou 3.17 2.61 5.16 4.32 2.59 2.39 Inner Mongolia 2.40 2.08 5.31 3.87 1.91 1.79 Ningxia 4.06 3.57 8.61 6.82 5.41 4.90 Qinghai 3.09 2.81 3.52 3.09 3.99 3.96 Shaanxi 1.42 1.23 2.45 1.69 1.37 1.17 Sichuan 1.49 1.36 2.99 2.36 1.26 1.12 Xinjiang 2.08 1.95 2.90 3.05 1.23 1.37 Yunnan 1.69 1.53 3.37 2.79 1.66 1.62 Chongqing 1.37 1.22 2.60 1.98 1.15 0.99 Anhui 1.17 1.05 2.88 2.22 1.10 1.10 Henan 1.34 1.19 3.75 2.89 1.28 1.24 Hubei 1.46 1.27 3.28 2.51 1.19 1.06 Hunan 1.35 1.21 2.71 1.78 1.06 0.94 Jiangxi 1.02 0.90 2.71 1.81 0.98 0.93 Shanxi 2.86 2.46 5.96 4.72 2.39 2.11 Source: National Bureau of Statistics, “China Statistical Yearbook” (2001-2010), China Statistics Press. have become more mature thanks to the reform and opening-up policy. So, those areas can devote more energy to transferring the economic growth mode, saving energy, and protecting en- vironment, which explains why eastern provinces are taking lead in this regard. Impact of Soft-Input to the Cost of Resources and Environment Effect of Soft-Input on Energy Consumption The effect of soft-input on energy consumption can be seen in Table 4. From Column 1, we can see that save, edu, sci, env, and cap can significantly reduce energy consumption per unit GDP. But in Column 3, we find no significant impact of industrial edu on energy consumption of per unit industry GDP, and in Column 5, there are no significant effects of env, and edu on power con- sumption per unit GDP. These results indicate that government spending on scientific research and environmental protection have significant role in the reduction of energy consumption. Financial development, likewise, also has a positive role in reducing energy consumption. 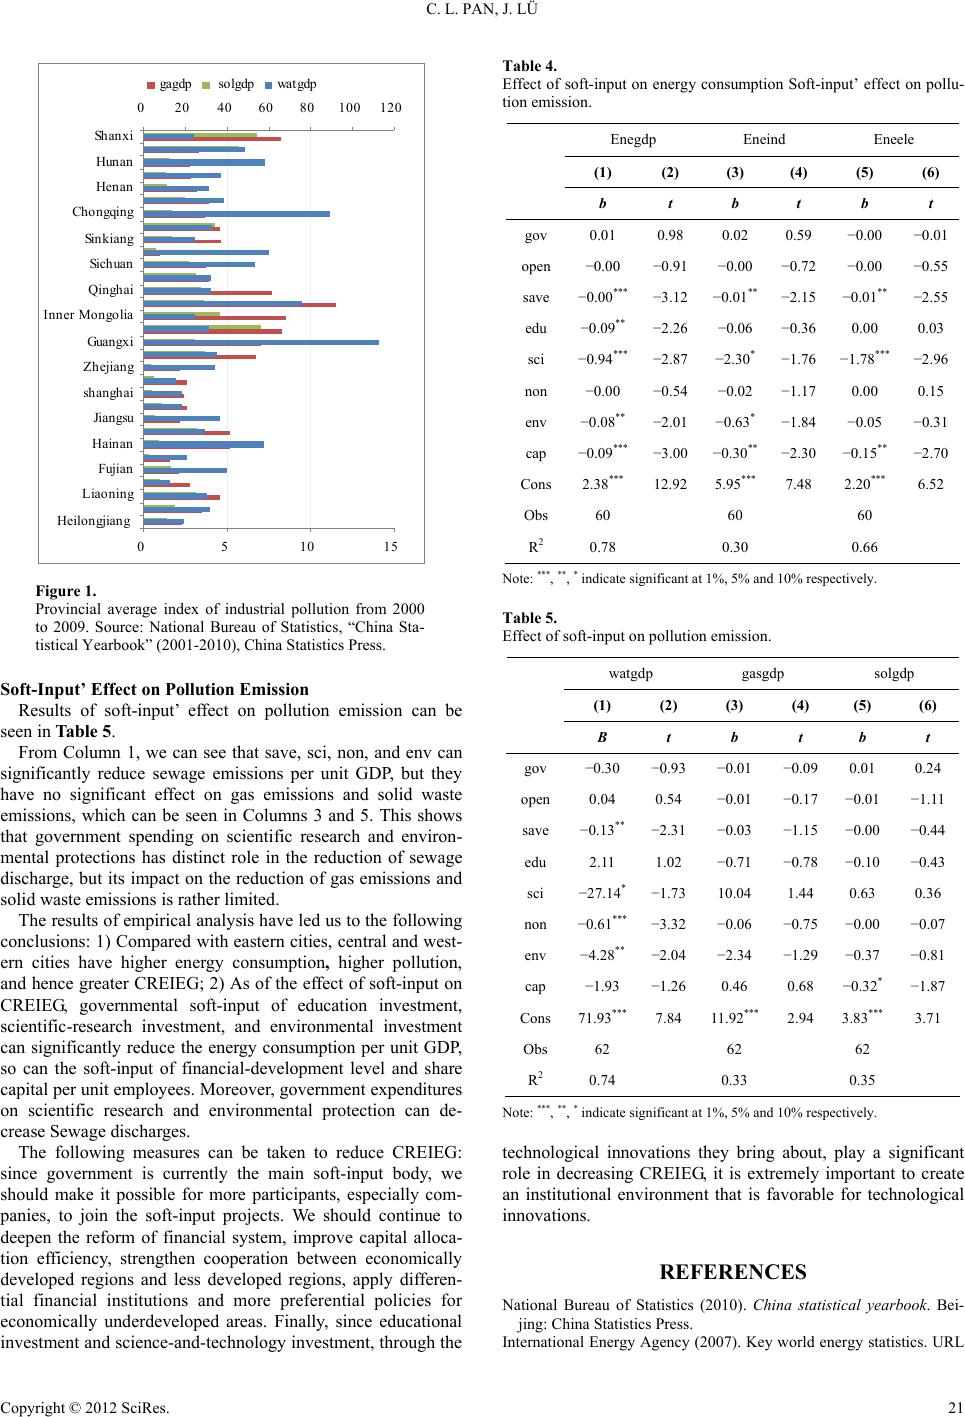 C. L. PAN, J. LÜ 051015 Heilongjiang Liaoning Fujia n Hain an Jiangsu shan gh ai Zhejiang Guangxi Inner Mongolia Qin ghai Sich ua n Sin k ia n g Chongqi ng Hen a n Hun a n Sh an x i 0 20406080100120 gagdp solgdpwat gdp Figure 1. Provincial average index of industrial pollution from 2000 to 2009. Source: National Bureau of Statistics, “China Sta- tistical Yearbook” (2001-2010), China Statistics Press. Soft-Input’ Effect on Pollution Emission Results of soft-input’ effect on pollution emission can be seen in Table 5. From Column 1, we can see that save, sci, non, and env can significantly reduce sewage emissions per unit GDP, but they have no significant effect on gas emissions and solid waste emissions, which can be seen in Columns 3 and 5. This shows that government spending on scientific research and environ- mental protections has distinct role in the reduction of sewage discharge, but its impact on the reduction of gas emissions and solid waste emissions is rather limited. The results of empirical analysis have led us to the following conclusions: 1) Compared with eastern cities, central and west- ern cities have higher energy consumption, higher pollution, and hence greater CREIEG; 2) As of the effect of soft-input on CREIEG, governmental soft-input of education investment, scientific-research investment, and environmental investment can significantly reduce the energy consumption per unit GDP, so can the soft-input of financial-development level and share capital per unit employees. Moreover, government expenditures on scientific research and environmental protection can de- crease Sewage discharges. The following measures can be taken to reduce CREIEG: since government is currently the main soft-input body, we should make it possible for more participants, especially com- panies, to join the soft-input projects. We should continue to deepen the reform of financial system, improve capital alloca- tion efficiency, strengthen cooperation between economically developed regions and less developed regions, apply differen- tial financial institutions and more preferential policies for economically underdeveloped areas. Finally, since educational investment and science-and-technology investment, through the Table 4. Effect of soft-input on energy consumption Soft-input’ effect on pollu- tion emission. Enegdp Eneind Eneele (1) (2) (3) (4) (5) (6) b t b t b t gov 0.01 0.98 0.02 0.59 −0.00 −0.01 open −0.00 −0.91 −0.00 −0.72 −0.00 −0.55 save −0.00*** −3.12 −0.01** −2.15 −0.01** −2.55 edu −0.09** −2.26 −0.06 −0.36 0.00 0.03 sci −0.94*** −2.87−2.30* −1.76 −1.78*** −2.96 non −0.00 −0.54 −0.02 −1.17 0.00 0.15 env −0.08** −2.01−0.63* −1.84 −0.05 −0.31 cap −0.09*** −3.00 −0.30** −2.30 −0.15** −2.70 Cons 2.38*** 12.925.95*** 7.48 2.20*** 6.52 Obs 60 60 60 R2 0.78 0.30 0.66 Note: ***, **, * indicate significant at 1%, 5% and 10% respectively. Table 5. Effect of soft-input on pollution emission. watgdp gasgdp solgdp (1) (2) (3) (4) (5) (6) B t b t b t gov −0.30 −0.93 −0.01 −0.09 0.01 0.24 open0.04 0.54 −0.01 −0.17 −0.01 −1.11 save −0.13** −2.31 −0.03 −1.15 −0.00 −0.44 edu 2.11 1.02 −0.71 −0.78 −0.10 −0.43 sci −27.14*−1.7310.04 1.44 0.63 0.36 non −0.61*** −3.32 −0.06 −0.75 −0.00 −0.07 env −4.28** −2.04 −2.34 −1.29 −0.37 −0.81 cap −1.93 −1.260.46 0.68 −0.32*−1.87 Cons 71.93*** 7.84 11.92*** 2.94 3.83*** 3.71 Obs 62 62 62 R2 0.74 0.33 0.35 Note: ***, **, * indicate significant at 1%, 5% and 10% respectively. technological innovations they bring about, play a significant role in decreasing CREIEG, it is extremely important to create an institutional environment that is favorable for technological innovations. REFERENCES National Bureau of Statistics (2010). China statistical yearbook. Bei- jing: China Statistics Press. International Energy Agency (2007). Key world energy statistics. URL Copyright © 2012 SciRes. 21  C. L. PAN, J. LÜ Copyright © 2012 SciRes. 22 (last checked 12 February 2007). http://www.iea.org/w/bookshop/add.aspx?id=144 Li, G. Z. (1995). Several theoretical issues on soft-input research. Re- search and Developmen t, 5, 11-14. Jiang, R. X., Hou, X. L., & Liu, Y. (2004). Evaluating China’s provin- cial sustainability by integrated indicators. Journal of the Graduate School of the Chinese Academy of Sciences, 21, 63-70. Chao, X. J. (2009). The quality of economic growth: A theoretical ex- planation and empirical analysis in China. Ph.D. Thesis, Xi’an: University of Northwest. Cheng, W. H. (2010). Soft-input and region quality of economic gro wth. Ph.D. Thesis, Lanzhou: University of Lanzhou. |