Optimization of Intraday Trading Strategy Based on ACD Rules and Pivot Point System in Chinese Market
280
egy, the pivot point system can derivate various com-
plicate technique analysis [12,13], including prevail 5
points system, 7 points system and 13 points system. Now
we only care about the pivot range in this system to com-
bine with the ACD rules to forecast the formation of pri-
ce trend as well as mood and atmosphere of the market,
providing investors with reference entry and exit points.
In ACD rules, we usually choose the high and low
price of the first 5 - 20 minutes as the upper and lower
bounds of opening range. Aup or Adown point is on or
below the bounds of opening range for a specific distance.
When the price stays above Aup point for half of the time
domain of opening range, the Aup point is established
successfully and the stop-loss point B is the lower bound
of opening range in this case. After Aup point has been
established, the reverse entry point is C. It is the turning
point of the market atmosphere, from bullish to bearish
or from bearish to bullish. It indicates a strong change in
market trends, providing investors with signal about how
to trade. It is away from the bounds of opening range for
some larger distance than that of A. After Aup point has
been established, if the price falls strongly instead of
increasing, reaching Cdown point, then investors should
establish a clear preference for short at this time, seizing
the market downward trend to get profits as much as
possible. In this case, the stop-loss point, D, is one tick
above the upper bound of opening rang. Situation on the
other side of the market is symmetric.
The other part of this trading strategy, pivot point sys-
tem, is mainly used to determine the price support or
resistance zone. The relative places of these zones and
the last close price forecast the market mood of next day.
Combining both in trading, double signals from them
increase investors’ confidence to maximize positions to
get more profits. It is also helpful to refine the stop-loss
point B and D to minimize loss.
However, In the process of implementing this trading
strategy, the most crucial and difficult problem for each
investor is how to determine the right place of entry point
A and C. In 2010, a report from Guosen applied the
trading strategy that based on ACD rules and pivot point
system into stock index futures in Chinese market and
realized substantial excess profits [14]. However, it fails
to talk about methods for calculating the place of A and
C, which is unique for each future in different market. In
this paper, we focus on improving this strategy, discuss-
ing how to determine the place of these two important
entry points, which are determined by two important pa-
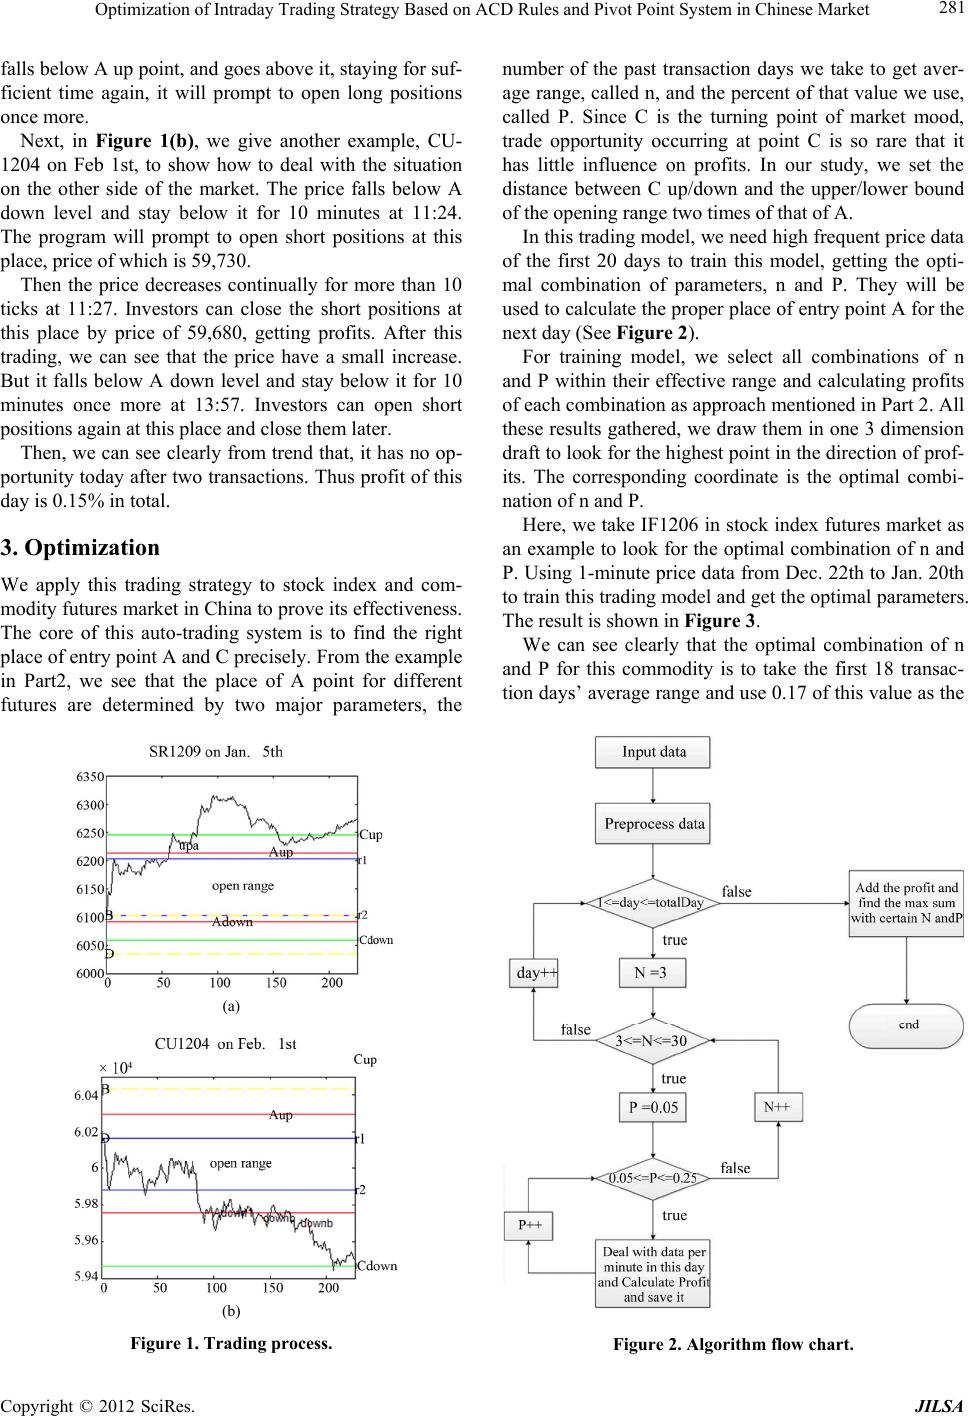
rameters. We program this trading strategy to find the
optimal combination of parameters. In empirical study,
we apply this auto-trading system into stock index and
commodity futures market in China to prove its effec-
tiveness.
2. An Empirical Example
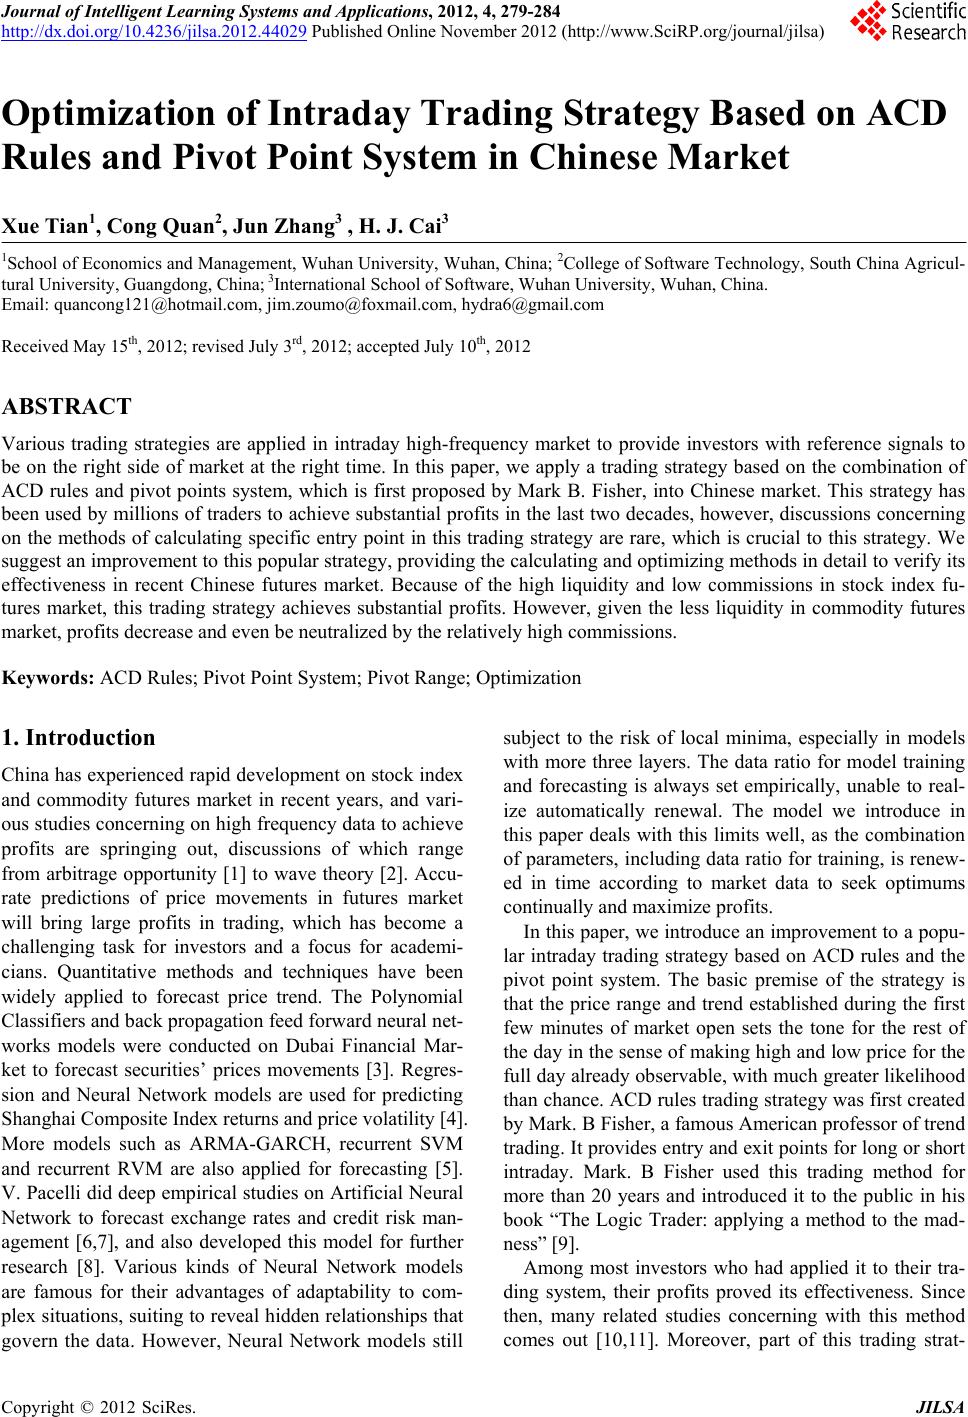
We choose a commodity future, SR1209, to show how to
apply this method to intraday trading in details. Take the
commodity futures SR1209, on Jan 5th, for example. We
take the average of the previous 4 transaction days’ range
(high-low), and use 12% of this value as the distance
between Aup/Adown and the upper/lower bound of the
opening range. On Jan 5th, the highest and lowest prices
of the first 20 minutes are 6202 and 6102 respectively.
So the opening range of this transaction day is 6102 -
6202, r2 - r1 in Figure 1(a).
The pivot range (not present in figures) in pivot point
system is calculated by the high(H), low(L) and close
price(C) of the previous one transaction day, namely Jan
4th.
Specific formulas are as follows: (PP: pivot price; SV:
the second value; PD: pivot difference; PR: pivot range)
PPH+L+C 3
SVH+L 2
PPSV = PD
PP / PDPR
Figure 1(a) shows that the price breaks Aup level at
9:57. From then on, the program starts to calculate time.
Once the price stays above Aup level for more than 10
minutes, it will prompt to open long positions.
Then the time goes to 10:06 and the price has stayed
above Aup level for just 10 minutes. It will prompt
investors to open long positions (“upa” point in Figure
1(a)). The price of this moment is 6228. Since then, the
program will judge the point where to close the long
positions. If the price rises continually, then investors can
sell them after 10 ticks rise. According to history data of
sugar trading, we set tick as 1. Of course, the amount of
tick may not be fixed. It varies in accordance with price
range of certain futures and investors preference How-
ever, if price falls. Instead of increasing, investors should
close the long position at stop-loss point. Combing ACD
rules and the pivot point system, the stop-loss point B in
this case is the higher one between the lower bound of
opening range, 6028 and that of pivot range, 6102. So B
is 6102 in this example. If neither of these above two
situations occurs, then close them at the closing time, 15:
00.
From Figure 1(a), we see that price rises continually,
reaching 6243, more than 10 ticks, at 10:17. Then inve-
stors can close the long positions at this moment. Calcu-
lating profits by formula: (sell price-buy price)/sell price,
we get 0.241% gains.
Later, the price stays above A up level for the remain-
ing time of this day, the program will not prompt to open
long positions or short positions, for it is unlikely for
price to have another significant rise. However, if price
Copyright © 2012 SciRes. JILSA