American Journal of Plant Sciences, 2012, 3, 1541-1545
http://dx.doi.org/10.4236/ajps.2012.311186 Published Online November 2012 (http://www.SciRP.org/journal/ajps)
1541
Shoot Biomass Assessments of the Marine Phanerogam
Zostera marina for Two Methods of Data Gathering
Elena Solana-Arellano*, Héctor Echavarría-Heras, Victoria Díaz-Castañeda, Olga Flores-Uzeta
Marine Ecology Department, Ensenada Scientific and Higher Education Center, Baja California, México.
Email: *esolana@cicese.mx
Received August 8th, 2012; revised September 16th, 2012; accepted October 10th, 2012
ABSTRACT
In order to compare to data gathering methods for shoot biomass assessments of Zostera marina, we compare two al-
lometric models each one representing a data gathering method, one at leaf level and the other in aggregated form. The
first allometric model presented leaf dry weight in terms of leaf length as .wl
The second model is expressed as a
several-variables version of the allometric Equation (1) dry weight of each leaf in a given shoot can be considered to be
a random variable therefore shoot biomass ws can be represented in the form 1.
s
n
s
k
k
wl
Both models presented
similar determination coefficients values of 0.85 and 0.87 respectively. We found no significant differences between
parameters
(p = 0.11) and
(p = 0.50) fitted for each model, showing that both equations conduced to the same
result. Moreover, both fitted models presented high Concordance Correlation Coefficients of reproducibility (ˆ
) (0.92
and 0.91). We concluded that for shoot weight assessments if larger samples and faster data processing is required then
should model of Equation (2) be used. On the other hand, we proposed model of Equation (1) if data at leaf level is
required for other endeavors.
Keywords: Allometric Models; Aggregated Data; Leaf Dry Weight; Shoot Dry Weight
1. Introduction
Because of the valuable services that Zostera marina
meadows provide to shallow coastal ecosystems, [1-6]
accurate measurements of biomass or productivity of this
eelgrass are important for the study and modeling of such
environments. Since shoot biomass is the basic unit to
study production in the eelgrass Z. marina, many at-
tempts have been made to model biomass in terms of
other shoot characteristics as leaf length and width [7,8].
On the other hand, shoot biomass assessments for Z. ma-
rina are reported in a variety of methodologies, some at a
leaf level [7-11], and some in aggregated way [12,14].
Although aggregated data are sometimes easy and faster
to obtain, measurements cannot be used to fit models and
make comparisons with other data sets.
The importance of modeling seagrasses in terms of
other variables has been pointed out by several authors
[7,9,11,15-17]. One of the main features of modeling is
to calibrate non-destructive methods, that is, once the
goodness of fit of a particular model is tested to data, the
model can be used to predict the pertinent dependent
variable from one or several independent variables that
are obtained in a non-destructively way. In this paper we
prove that we can obtain robust allometric parameters
even if the data are collected at leaf level or an aggre-
gated form.
2. Materials and Methods
2.1. Data and Related Calculations
The data used for this study were collected from January
to December 2001 in a Z. marina meadow in Punta
Banda Estuary, located 23 km. south of Ensenada, Baja
California, Mexico at 31˚43'N-46'N and 116˚N37'W-
40'W. For a detailed description of the site see [10].
Since has been proven that for Zostera marina allometric
parameters are time invariant [8,10,18] we believe that a
hole year cycle is sufficient to compare the two methods.
At each sampling time t, using the Kentula and McIntire
method [19], approximately 20 shoots were marked bi-
weekly. Only complete leaves were used for the analysis.
Since Zostera marina present a ribbon like architecture
leaf length was measured from the tip to the ligula [see
[20]), width was measure at halfway of the length, this
measure of width has been proven to be the best repre-
sentative proxy of leaf width [20], dry weigh was also
*Corresponding author.
Copyright © 2012 SciRes. AJPS
Shoot Biomass Assessments of the Marine Phanerogam Zostera marina for Two Methods of Data Gathering
1542
determined using standard methodology. For this study
only leaf length and dry weight were analyzed. Data
were then tested at a single leaf bases and in an aggre-
gated form and results were statistically compared. We
also calculated the Lin [21] Concorance Correlation Co-
efficient of reproducibility (ˆ
) for predicted and ob-
served values in each fitted model.
2.2. Formal Methods
Some authors ([7,8,10,11,15] among others), have proven
that leaf dry weight can be consistently represented al-
lometrically in terms of leaf length and/or leaf width or
area. They considered the allometric basic model
,wl
(1)
were w and l represent the dry weight and length of a
single leaf respectively and
and
are parameters
to be fitted. That means that leaf dry weight can be rep-
resented in terms of leaf length.
On the other hand, when individual leaf dry weight is
not available and dry weight data is represented in an
aggregated form, that is, weight is obtained at a shoot
level, we cannot fit Equation (1). Nevertheless, the dry
weight of each leaf in a given shoot can be considered to
be a random variable and can thus be expressed as sev-
eral-variables version of the allometric Equation (1)
therefore shoot biomass
w can be represented in the
form

12
1
1
,
s
s
s
n
sn
k
n
sk
k
wll
wl
l

 
(2)
where k denotes the length of the kth leaf and ns stands
for the number of leaves in the shoot under consideration.
Models of Equations (1) and (2) where fitted using stan-
dard nonlinear regression methods.
l
3. Results
For the whole annual cycle, we recovered 128 shoots
with 393 complete leaves. Table 1 shows basic statistic
for leaf length (l), dry weight (w) and shoot dry weight
,
s
w showing high variability on all of these variables.
Equation (1) was fitted at leaf level data with a deter-
mination coefficient of 0.85 and fitted parameters α =
1.19 ± 0.045 and β = 0.00002 ± 0.000008. Figure 1
shows predicted versus observed values of this fit. Sub-
sequently the Lin [19] Concordance correlation coeffi-
cient of reproducibility (ˆ
) was performed between ob-
served and predicted values for the fit of Equation (1)
finding a value of 0.92. Similarly, for measurements of
weights at a shoot level, the several-variable version of
Equation (1), (Equation (2)) was fitted using nonlinear
Table 1. basic statistics for leaf length, weight and shoot
weight.
Mean Min. Max. Std. Dev.
Length 188.09 4 517 124.7
Leaf dry weight0.015 0.0001 0.06 0.01
Shoot dry weight0.046 0.005 0.39 0.03
Figure 1. Leaf dry weight in terms of leaf length fitted by
Equation (1).
multiple regression finding a determination coefficient
and values for α = 1.17 ± 0.051 and β =
0.00003 ± 0.000009. The estimation errors for both fit-
tings were 0.00003 and 0.0002 respectively.
20.87R
The corresponding plot of predicted versus observed
values is shown in Figure 2. The Concordance correla-
tion coefficient of reproduciblity was of ˆ0.91
.
Residuals shown Normality and homoscesticity, al-
though dispersion apparently is bigger for residuals of
the fitting of Equation (1) (see Figure 3).
Since Equations (1) and (2) were both fitted using least
square method parameters, they are distributed normally
therefore we performed a t test between parameters find-
ing no significant differences between parameters with a
p-value of 0.11 for
and 0.50 for
. This demon-
strates that the fitted parameters in Equations (1) and (2)
are statistically the same with a 0.95 confidence level.
Moreover, using the Akaike information criterion (AIC)
[22] the AIC for Equation (1) is the minimum between
both fits with a value of 3660 and the AIC for the fitting
of Equation (2) the AIC = 1156.35 therefore since this
is less than 4 times the minimum (3.1) we have consider-
able support to consider it a good model for inference
purposes. Moreover using parameters found in Equations
(1) and (2) we projected mean shoot weight per month,
Figure 4 shows the comparison with observed values.
Copyright © 2012 SciRes. AJPS
Shoot Biomass Assessments of the Marine Phanerogam Zostera marina for Two Methods of Data Gathering 1543
Figure 2. Predicted versus observed values of the fitting of
Equation (2) to shoot dry weight in terms lengths of leaves
in a shoot.
(a)
(b)
Figure 3. Distribution of residual of respective fittings (a)
allometric Equation (1); (b) Equation (2), which is a multi-
variate version of Equation (1).
(a)
(b)
Figure 4. Observed (dashed lines) and projected (continu-
ous lines) mean shoot weight per month. (a) By means of
allometric Equation (1) this is, at a leaf level (b) Using the
multivariate Equation (2), this is at a shoot level.
Residuals showed normality and homoscesticity, al-
though dispersion apparently is bigger for residuals of
the fitting of Equation (1) (see Figure 3).
4. Discussion
Body size affects the structure and functioning at all lev-
els of biological organization from individuals, popula-
tions, communities and ecosystems [23]. Related to body
size, is the allometry term used first by Huxley (1932 in
[23]) to describe the study of the relationship between
body size and other variables. The importance of al-
lometric relationships to describe and predict production/
biomass of seagrass communities have been used by
several authors [7-11,15]. Moreover, [24] present a com-
plete discussion on how application of allometric laws
prediction could benefit our understanding of estuaries
and coastal ecology. However, for Z. marina, sampling
Copyright © 2012 SciRes. AJPS
Shoot Biomass Assessments of the Marine Phanerogam Zostera marina for Two Methods of Data Gathering
1544
and processing sufficient data to test a robust statistical
method, could be an extremely time consuming endeavor.
For that reason some authors use aggregated data or data
at a shoot level instead of data at a leaf level (non-ag-
gregated) to test differences of some measurements in
time and space [13]. Moreover, data gathering for eel-
grass assessments methods could be time consuming and
destructive. For example at a leaf level, each leaf in a
shoot should be counted, measured (length and width)
and weighted implying a enormous time of sample proc-
essing and for biomass (for example) a bigger error in
weighting each leaf separately.
On the other hand, aggregated data, could be easier to
obtain and present less error, but could not be used in
some models that require individual measurements, as
Equation (1).
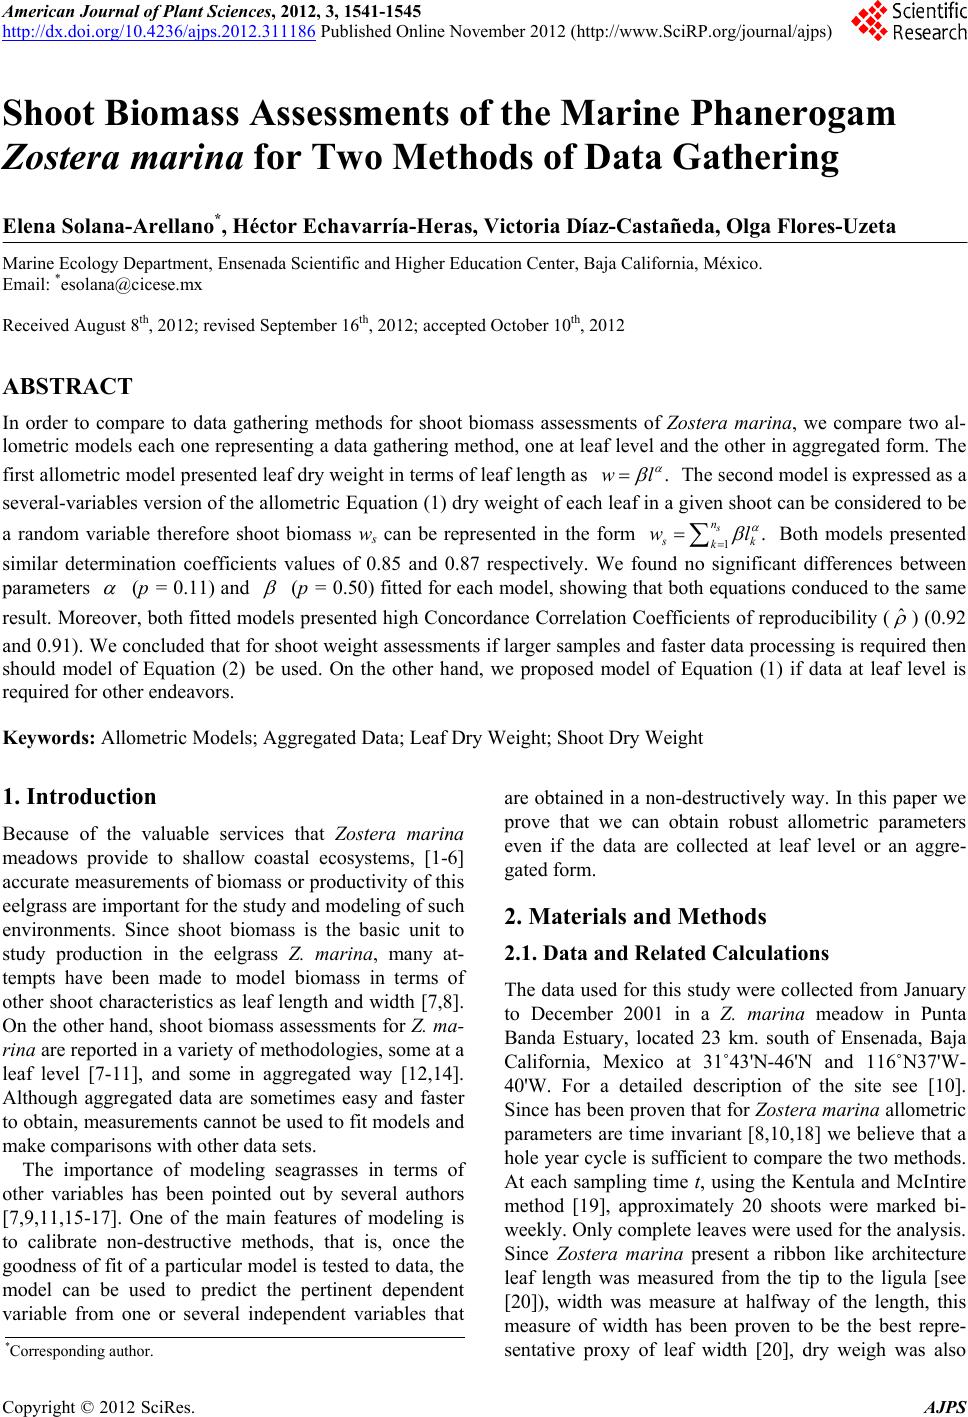
We have demonstrated in this work, that for biomass
assessments a several-variables version of the allometric
Equation (1), Equation (2) where leaf dry weights are
aggregated at a shoot level gives the same results as the
assessments found for the fitting of Equation (1). We
found that parameters fitted for both models were statis-
tically the same with p = 0.11 for
and p = 0.50 for
.
The determination coefficients for both fittings were
also statistically the same (p > 0.05). Moreover Lin [19]
Concordance Correlation Coefficient of reproducibility
(ˆ
) attained exactly the same value for both fits (0.92),
and The AIC shows that both models deserve considera-
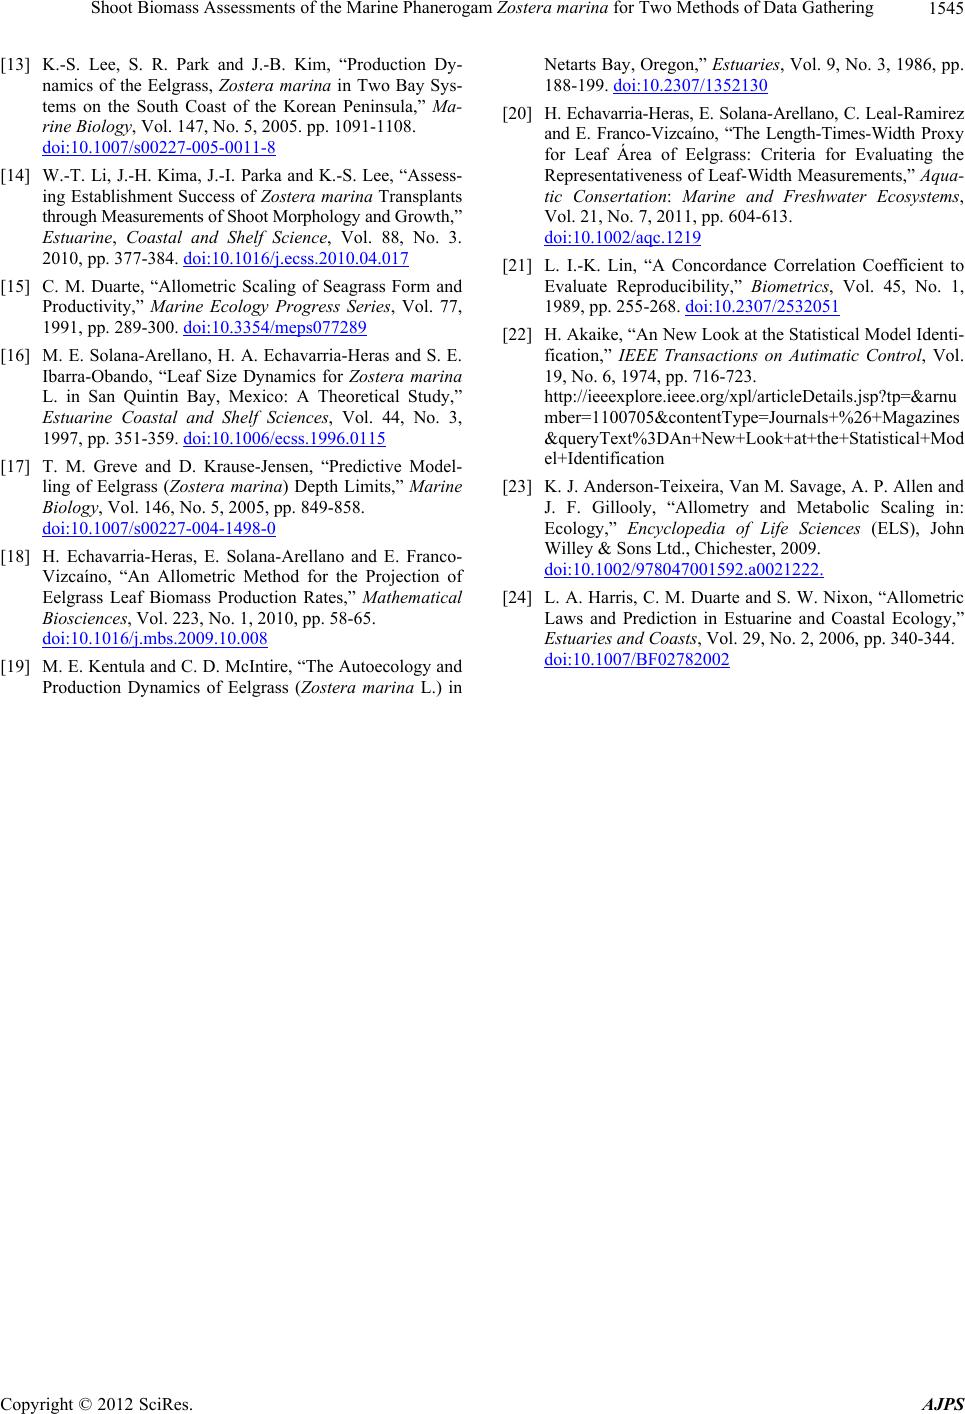
tion for statistical inference. Figure 4 shows that pro-
jected values of mean shoot biomass per month are al-
most identical and in a good correspondence with ob-
served values, therefore we consider that Equations (1)
and (2) can be used indistinctly for shoot biomass as-
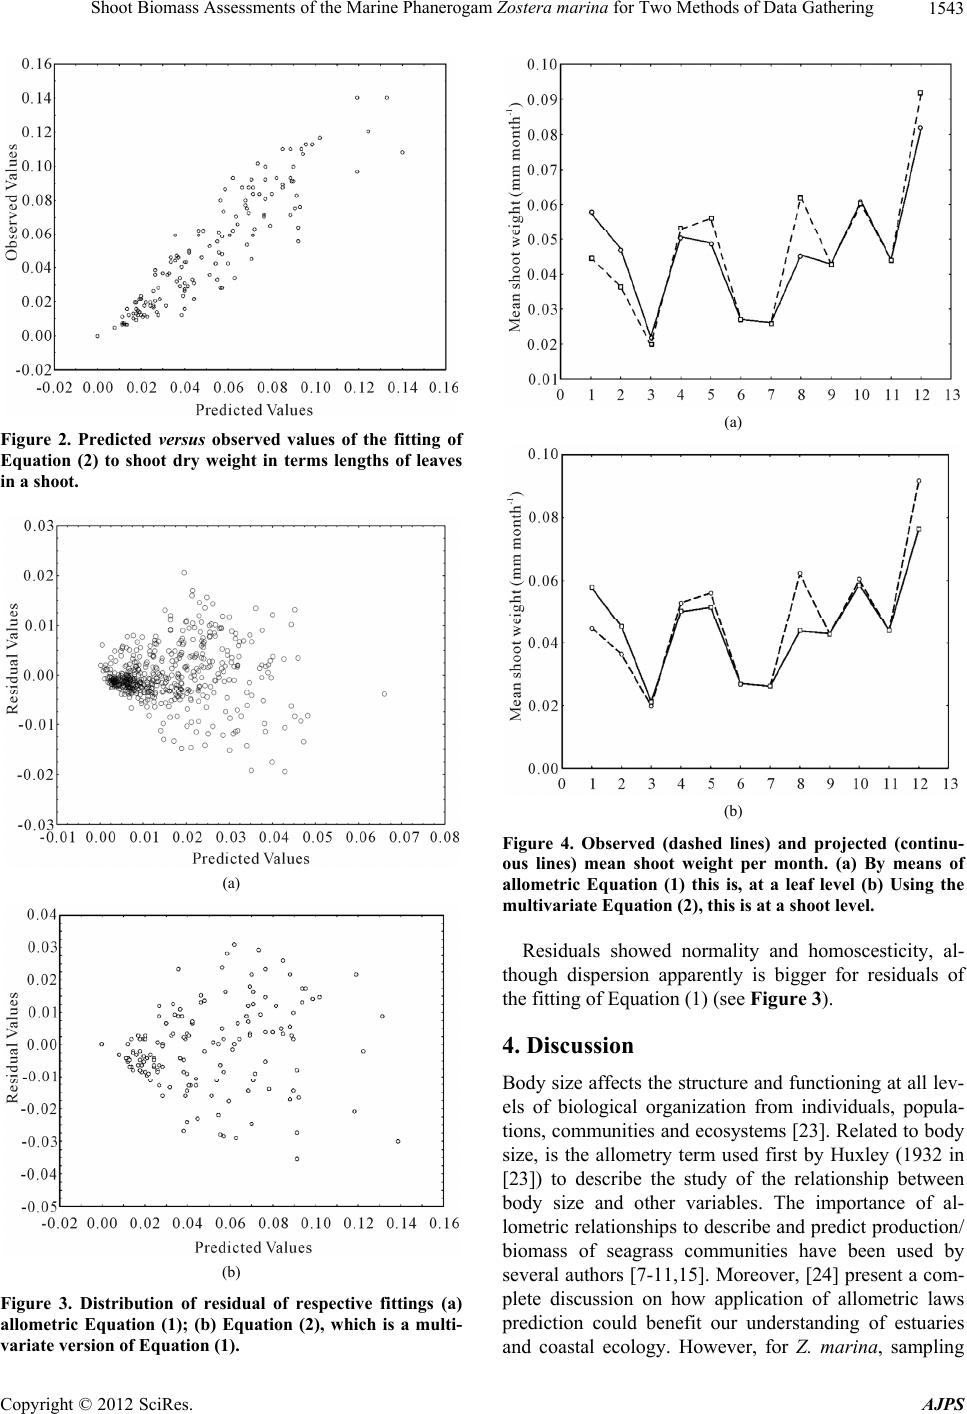
sessments. Nevertheless, the fitting of Equation (1) gives
us the advantages of a smaller estimation error, but with
the disadvantage of bigger time consuming in data proc-
essing. Whereas in the fitting of Equation (2) processing
data is much less time consuming but have a slight
higher estimation error and a better disposition of residu-
als. Moreover, since the time of processing material in
aggregated form is much less time consuming, bigger
samples can be taken if necessary. In any case, regardless
of the type of data (aggregated or non-aggregated), the
allometric relationship between leaf or shoot dry weight
and leaf length is consistent for Zostera marina. In con-
clusion, for shoot weight assessments, we proposed
model of Equation (2) for large samples and faster data
processing and model of Equation (1) if data at leaf level
is required for other endeavors.
5. Acknowledgements
The authors thank Jose Maria Dominguez and Francisco
Ponce for the art work.
REFERENCES
[1] F. T. Short and C. A. Short, “The Seagrass Filter: Purifi-
cation of Coastal Water,” In: V. S. Kennedy, Ed., The
Estuary as a Filter, Academic Press, Orlando, 1984, pp.
395-413.
[2] G. W. Thayer, W. J. Kenworthy and M. S. Fonseca, “The
Ecology of Eelgrass Meadows of the Atlantic Coast: A
Community Profile,” US Fish and Wildlife Service Divi-
sion of Biological Services, FWS/OBS-84/02, No. 147,
1984.
[3] L. G. Ward, W. M. Kemp and W. R. Boynton, “The In-
fluence of Waves and Seagrass Communities on Sus-
pended Particulates in an Estuarine Embayment,” Journal
of Marine Geology, Vol. 59, No. 1-4, 1984, pp. 85-103.
doi:10.1016/0025-3227(84)90089-6
[4] M. S. Fonseca and J. S. Fisher, “A Comparison of Can-
opy Friction and Sediment Movement between Four Spe-
cies of Seagrass with Reference to Their Ecology and
Restoration,” Marine Ecology Progress Series, Vol. 29,
1986, pp. 15-22. doi:10.3354/meps029015
[5] T. P. Williams, J. M. Bubb and J. N. Lester, “Metal Ac-
cumulation within Salt Marsh Environment: A Review,”
Marine Pollution Bulletin, Vol. 28, No. 5, 1994, pp. 277-
290. doi:10.1016/0025-326X(94)90152-X
[6] K. L. Heck, K. W. Able, C. T. Roman and M. P. Fahay,
“Composition, Abundance, Biomass and Production of
Macrofauna in a New England Estuary: Comparison
among Eelgrass Meadows and Other Nursery Habitats,”
Estuaries, Vol. 18, No. 2, 1995, pp. 379-389.
doi:10.2307/1352320
[7] S. P. Hamburg and P. S. Homann, “Utilization of Growth
Parameters of Eelgrass, Zostera marina, for Productivity
Estimates under Laboratory and in Situ Conditions,” Ma-
rine Biology, Vol. 93, No. 2, 1986, pp. 299-303.
doi:10.1007/BF00508267
[8] E. Solana-Arellano, D. J. Brobon-Gonzalez and H. A.
Echavarria-Heras, “A General Allometric Model for Blade
Production in Zostera marina L.,” Bulletin of Southern
California Academy of Sciences, Vol. 97, 1998, pp. 39-
48.
[9] C. M. Duarte, “Temporal Biomass Variability and Pro-
duction/Biomass Relationships of Seagrass Communi-
ties,” Marine Ecology Progress Series, Vol. 51, 1989, pp.
269-276. doi:10.3354/meps051269
[10] H. Echavarria-Heras, K. S. Lee, E. Solana-Arellano and E.
Franco-Vizcaíno, “Formal Analysis and Evaluation of
Allometric Methods for Estimating Above-Ground Bio-
mass of Eelgrass,” Annals of Applied Biology, Vol. 159,
No. 3, 2011, pp. 503-515.
doi:10.1111/j.1744-7348.2011.00511.x
[11] E. Solana-Arellano, S. E. Ibarra-Obando and H. A. Echa-
varria-Heras, “Calibración de un Modelo Alométrico para
Evaluar la Producción Foliar de Zostera marina L.,”
Hidrobiológica, Vol. 1, 1991, pp. 41-44.
[12] K. Aioi, “Seasonal Change in the Standing Crop of Eel-
grass Zostera marina L. in Odawa Bay, Central Japan,”
Aquatic Botany, Vol. 8, 1980, pp. 343-354.
doi:10.1016/0304-3770(80)90064-9
Copyright © 2012 SciRes. AJPS
Shoot Biomass Assessments of the Marine Phanerogam Zostera marina for Two Methods of Data Gathering
Copyright © 2012 SciRes. AJPS
1545
[13] K.-S. Lee, S. R. Park and J.-B. Kim, “Production Dy-
namics of the Eelgrass, Zostera marina in Two Bay Sys-
tems on the South Coast of the Korean Peninsula,” Ma-
rine Biology, Vol. 147, No. 5, 2005. pp. 1091-1108.
doi:10.1007/s00227-005-0011-8
[14] W.-T. Li, J.-H. Kima, J.-I. Parka and K.-S. Lee, “Assess-
ing Establishment Success of Zostera marina Transplants
through Measurements of Shoot Morphology and Growth,”
Estuarine, Coastal and Shelf Science, Vol. 88, No. 3.
2010, pp. 377-384. doi:10.1016/j.ecss.2010.04.017
[15] C. M. Duarte, “Allometric Scaling of Seagrass Form and
Productivity,” Marine Ecology Progress Series, Vol. 77,
1991, pp. 289-300. doi:10.3354/meps077289
[16] M. E. Solana-Arellano, H. A. Echavarria-Heras and S. E.
Ibarra-Obando, “Leaf Size Dynamics for Zostera marina
L. in San Quintin Bay, Mexico: A Theoretical Study,”
Estuarine Coastal and Shelf Sciences, Vol. 44, No. 3,
1997, pp. 351-359. doi:10.1006/ecss.1996.0115
[17] T. M. Greve and D. Krause-Jensen, “Predictive Model-
ling of Eelgrass (Zostera marina) Depth Limits,” Marine
Biology, Vol. 146, No. 5, 2005, pp. 849-858.
doi:10.1007/s00227-004-1498-0
[18] H. Echavarria-Heras, E. Solana-Arellano and E. Franco-
Vizcaíno, “An Allometric Method for the Projection of
Eelgrass Leaf Biomass Production Rates,” Mathematical
Biosciences, Vol. 223, No. 1, 2010, pp. 58-65.
doi:10.1016/j.mbs.2009.10.008
[19] M. E. Kentula and C. D. McIntire, “The Autoecology and
Production Dynamics of Eelgrass (Zostera marina L.) in
Netarts Bay, Oregon,” Estuaries, Vol. 9, No. 3, 1986, pp.
188-199. doi:10.2307/1352130
[20] H. Echavarria-Heras, E. Solana-Arellano, C. Leal-Ramirez
and E. Franco-Vizcaíno, “The Length-Times-Width Proxy
for Leaf Área of Eelgrass: Criteria for Evaluating the
Representativeness of Leaf-Width Measurements,” Aqua-
tic Consertation: Marine and Freshwater Ecosystems,
Vol. 21, No. 7, 2011, pp. 604-613.
doi:10.1002/aqc.1219
[21] L. I.-K. Lin, “A Concordance Correlation Coefficient to
Evaluate Reproducibility,” Biometrics, Vol. 45, No. 1,
1989, pp. 255-268. doi:10.2307/2532051
[22] H. Akaike, “An New Look at the Statistical Model Identi-
fication,” IEEE Transactions on Autimatic Control, Vol.
19, No. 6, 1974, pp. 716-723.
http://ieeexplore.ieee.org/xpl/articleDetails.jsp?tp=&arnu
mber=1100705&contentType=Journals+%26+Magazines
&queryText%3DAn+New+Look+at+the+Statistical+Mod
el+Identification
[23] K. J. Anderson-Teixeira, Van M. Savage, A. P. Allen and
J. F. Gillooly, “Allometry and Metabolic Scaling in:
Ecology,” Encyclopedia of Life Sciences (ELS), John
Willey & Sons Ltd., Chichester, 2009.
doi:10.1002/978047001592.a0021222.
[24] L. A. Harris, C. M. Duarte and S. W. Nixon, “Allometric
Laws and Prediction in Estuarine and Coastal Ecology,”
Estuaries and Coasts, Vol. 29, No. 2, 2006, pp. 340-344.
doi:10.1007/BF02782002