Paper Menu >>
Journal Menu >>
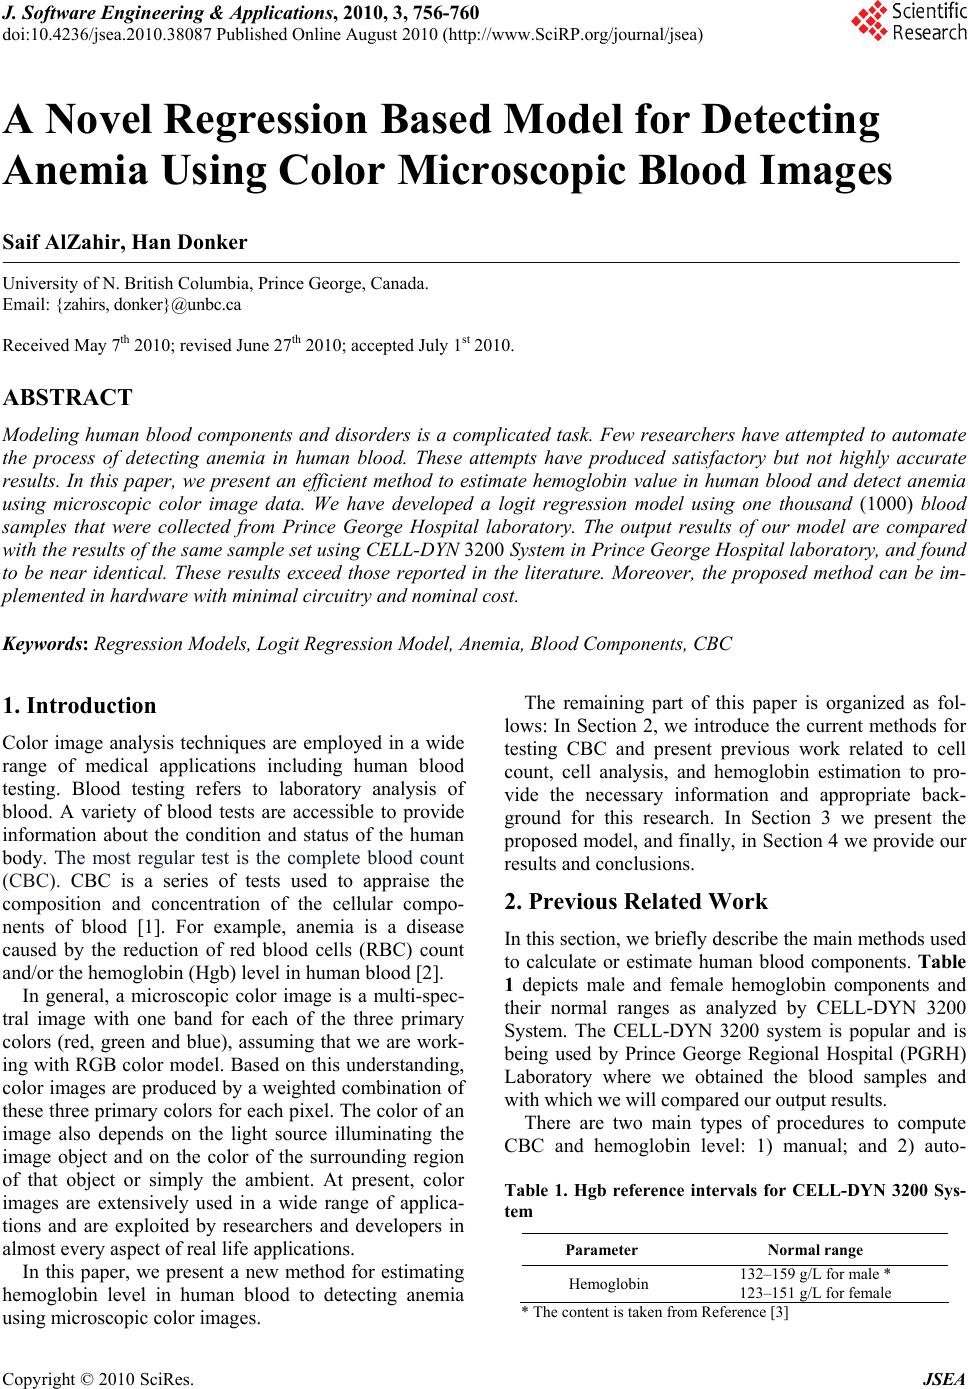 J. Software Engineering & Applications, 2010, 3, 756-760 doi:10.4236/jsea.2010.38087 Published Online August 2010 (http://www.SciRP.org/journal/jsea) Copyright © 2010 SciRes. JSEA A Novel Regression Based Model for Detecting Anemia Using Color Microscopic Blood Images Saif AlZahir, Han Donker University of N. British Columbia, Prince George, Canada. Email: {zahirs, donker}@unbc.ca Received May 7th 2010; revised June 27th 2010; accepted July 1st 2010. ABSTRACT Modeling human blood components and disorders is a complicated task. Few researchers have attempted to automate the process of detecting anemia in human blood. These attempts have produced satisfactory but not highly accurate results. In this paper, we present an efficient method to estimate hemoglobin value in human blood and detect anemia using microscopic color image data. We have developed a logit regression model using one thousand (1000) blood samples that were collected from Prince George Hospital laboratory. The output results of our model are compared with the results of the same sample set using CELL-DYN 3200 System in Prince George Hospital laboratory, and found to be near identical. These results exceed those reported in the literature. Moreover, the proposed method can be im- plemented in hardware with minimal circuitry and nominal cost. Keywords: Regression Models, Logit Regression Model, Anemia, Blood Components, CBC 1. Introduction Color image analysis techniques are employed in a wide range of medical applications including human blood testing. Blood testing refers to laboratory analysis of blood. A variety of blood tests are accessible to provide information about the condition and status of the human body. The most regular test is the complete blood count (CBC). CBC is a series of tests used to appraise the composition and concentration of the cellular compo- nents of blood [1]. For example, anemia is a disease caused by the reduction of red blood cells (RBC) count and/or the hemoglobin (Hgb) level in human blood [2]. In general, a microscopic color image is a multi-spec- tral image with one band for each of the three primary colors (red, green and blue), assuming that we are work- ing with RGB color model. Based on this understanding, color images are produced by a weighted combination of these three primary colors for each pixel. The color of an image also depends on the light source illuminating the image object and on the color of the surrounding region of that object or simply the ambient. At present, color images are extensively used in a wide range of applica- tions and are exploited by researchers and developers in almost every aspect of real life applications. In this paper, we present a new method for estimating hemoglobin level in human blood to detecting anemia using microscopic color images. The remaining part of this paper is organized as fol- lows: In Section 2, we introduce the current methods for testing CBC and present previous work related to cell count, cell analysis, and hemoglobin estimation to pro- vide the necessary information and appropriate back- ground for this research. In Section 3 we present the proposed model, and finally, in Section 4 we provide our results and conclusions. 2. Previous Related Work In this section, we briefly describe the main methods used to calculate or estimate human blood components. Table 1 depicts male and female hemoglobin components and their normal ranges as analyzed by CELL-DYN 3200 System. The CELL-DYN 3200 system is popular and is being used by Prince George Regional Hospital (PGRH) Laboratory where we obtained the blood samples and with which we will compared our output results. There are two main types of procedures to compute CBC and hemoglobin level: 1) manual; and 2) auto- Table 1. Hgb reference intervals for CELL-DYN 3200 Sys- tem Parameter Normal range Hemoglobin 132–159 g/L for male * 123–151 g/L for female * The content is taken from Reference [3] 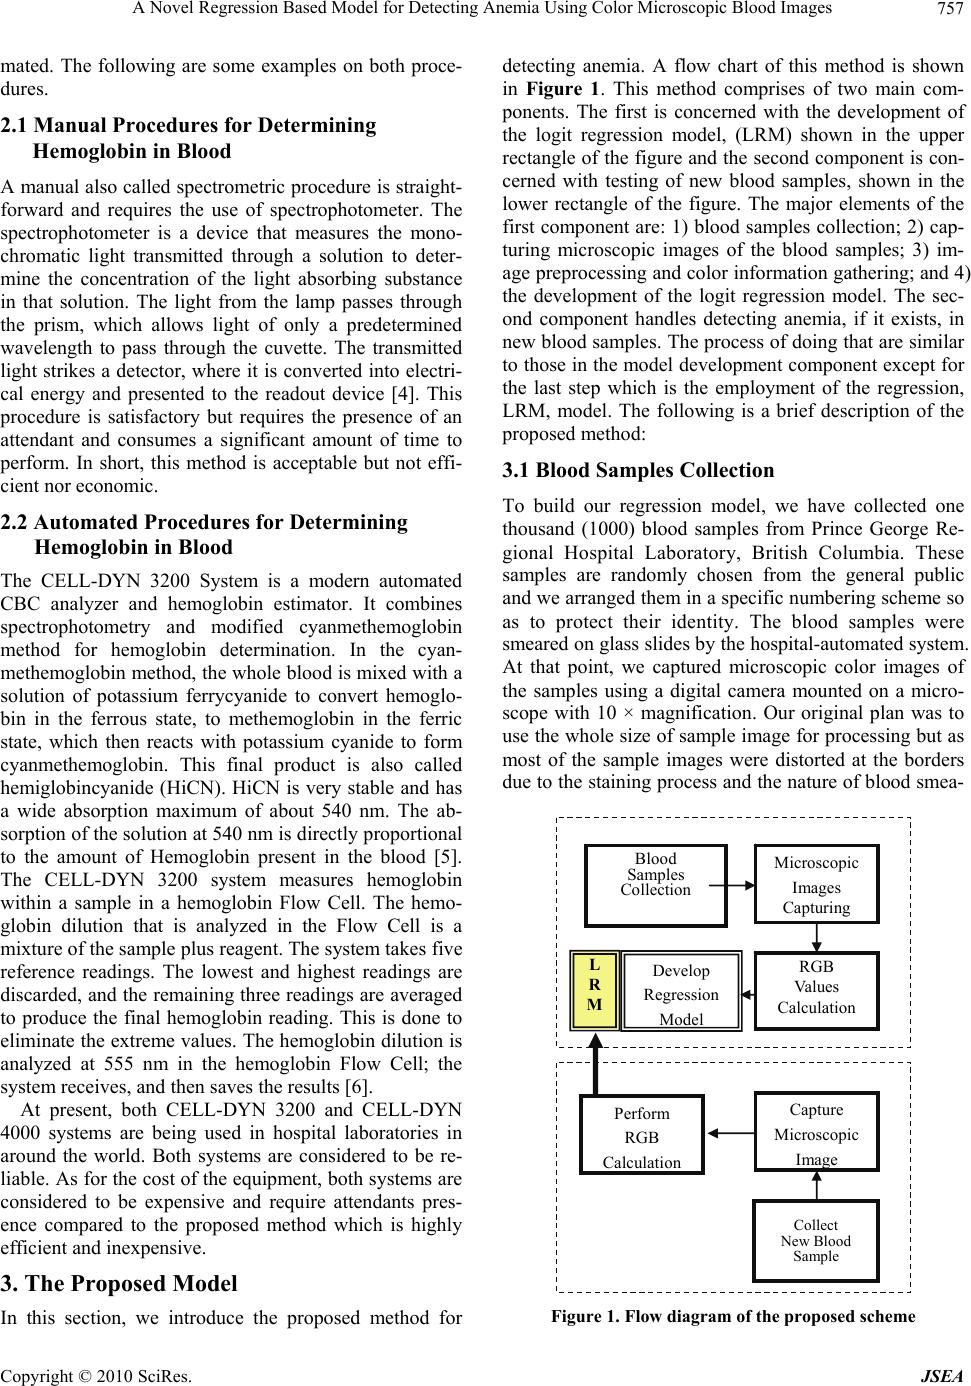 A Novel Regression Based Model for Detecting Anemia Using Color Microscopic Blood Images Copyright © 2010 SciRes. JSEA 757 mated. The following are some examples on both proce- dures. 2.1 Manual Procedures for Determining Hemoglobin in Blood A manual also called spectrometric procedure is straight- forward and requires the use of spectrophotometer. The spectrophotometer is a device that measures the mono- chromatic light transmitted through a solution to deter- mine the concentration of the light absorbing substance in that solution. The light from the lamp passes through the prism, which allows light of only a predetermined wavelength to pass through the cuvette. The transmitted light strikes a detector, where it is converted into electri- cal energy and presented to the readout device [4]. This procedure is satisfactory but requires the presence of an attendant and consumes a significant amount of time to perform. In short, this method is acceptable but not effi- cient nor economic. 2.2 Automated Procedures for Determining Hemoglobin in Blood The CELL-DYN 3200 System is a modern automated CBC analyzer and hemoglobin estimator. It combines spectrophotometry and modified cyanmethemoglobin method for hemoglobin determination. In the cyan- methemoglobin method, the whole blood is mixed with a solution of potassium ferrycyanide to convert hemoglo- bin in the ferrous state, to methemoglobin in the ferric state, which then reacts with potassium cyanide to form cyanmethemoglobin. This final product is also called hemiglobincyanide (HiCN). HiCN is very stable and has a wide absorption maximum of about 540 nm. The ab- sorption of the solution at 540 nm is directly proportional to the amount of Hemoglobin present in the blood [5]. The CELL-DYN 3200 system measures hemoglobin within a sample in a hemoglobin Flow Cell. The hemo- globin dilution that is analyzed in the Flow Cell is a mixture of the sample plus reagent. The system takes five reference readings. The lowest and highest readings are discarded, and the remaining three readings are averaged to produce the final hemoglobin reading. This is done to eliminate the extreme values. The hemoglobin dilution is analyzed at 555 nm in the hemoglobin Flow Cell; the system receives, and then saves the results [6]. At present, both CELL-DYN 3200 and CELL-DYN 4000 systems are being used in hospital laboratories in around the world. Both systems are considered to be re- liable. As for the cost of the equipment, both systems are considered to be expensive and require attendants pres- ence compared to the proposed method which is highly efficient and inexpensive. 3. The Proposed Model In this section, we introduce the proposed method for detecting anemia. A flow chart of this method is shown in Figure 1. This method comprises of two main com- ponents. The first is concerned with the development of the logit regression model, (LRM) shown in the upper rectangle of the figure and the second component is con- cerned with testing of new blood samples, shown in the lower rectangle of the figure. The major elements of the first component are: 1) blood samples collection; 2) cap- turing microscopic images of the blood samples; 3) im- age preprocessing and color information gathering; and 4) the development of the logit regression model. The sec- ond component handles detecting anemia, if it exists, in new blood samples. The process of doing that are similar to those in the model development component except for the last step which is the employment of the regression, LRM, model. The following is a brief description of the proposed method: 3.1 Blood Samples Collection To build our regression model, we have collected one thousand (1000) blood samples from Prince George Re- gional Hospital Laboratory, British Columbia. These samples are randomly chosen from the general public and we arranged them in a specific numbering scheme so as to protect their identity. The blood samples were smeared on glass slides by the hospital-automated system. At that point, we captured microscopic color images of the samples using a digital camera mounted on a micro- scope with 10 × magnification. Our original plan was to use the whole size of sample image for processing but as most of the sample images were distorted at the borders due to the staining process and the nature of blood smea- Develop Regression Model Blood Samples Collection Microscopic Images Capturing RGB Values Calculation Collect New Blood Sample Capture Microscopic Ima g e Perform RGB Calculation L R M Figure 1. Flow diagram of the proposed scheme 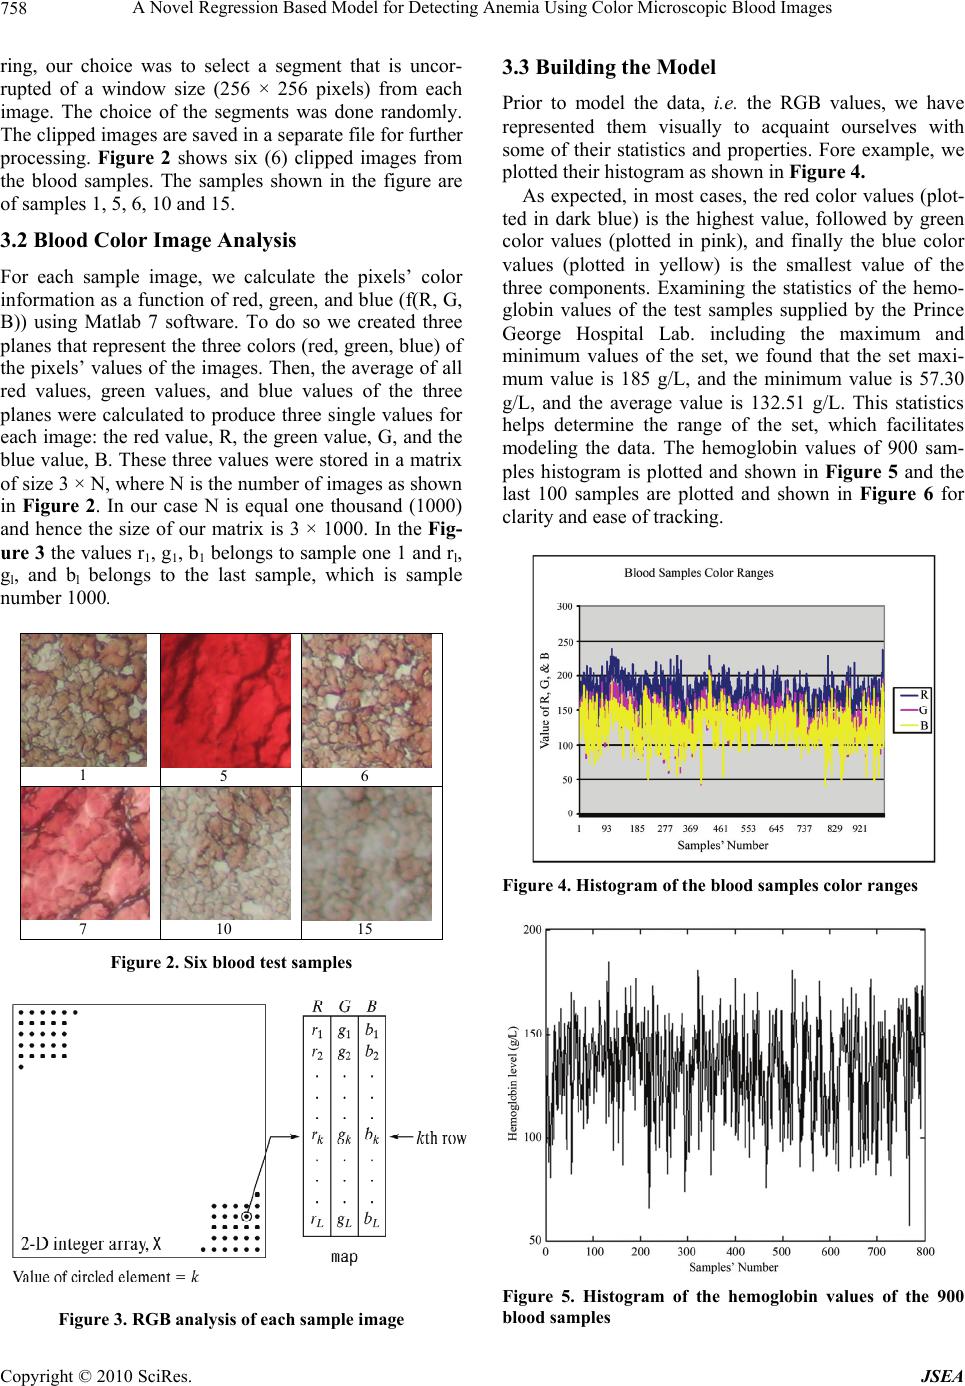 A Novel Regression Based Model for Detecting Anemia Using Color Microscopic Blood Images Copyright © 2010 SciRes. JSEA 758 ring, our choice was to select a segment that is uncor- rupted of a window size (256 × 256 pixels) from each image. The choice of the segments was done randomly. The clipped images are saved in a separate file for further processing. Figure 2 shows six (6) clipped images from the blood samples. The samples shown in the figure are of samples 1, 5, 6, 10 and 15. 3.2 Blood Color Image Analysis For each sample image, we calculate the pixels’ color information as a function of red, green, and blue (f(R, G, B)) using Matlab 7 software. To do so we created three planes that represent the three colors (red, green, blue) of the pixels’ values of the images. Then, the average of all red values, green values, and blue values of the three planes were calculated to produce three single values for each image: the red value, R, the green value, G, and the blue value, B. These three values were stored in a matrix of size 3 × N, where N is the number of images as shown in Figure 2. In our case N is equal one thousand (1000) and hence the size of our matrix is 3 × 1000. In the Fig- ure 3 the values r1, g1, b1 belongs to sample one 1 and rl, gl, and bl belongs to the last sample, which is sample number 1000. 1 5 6 7 10 15 Figure 2. Six blood test samples Figure 3. RGB analysis of each sample image 3.3 Building the Model Prior to model the data, i.e. the RGB values, we have represented them visually to acquaint ourselves with some of their statistics and properties. Fore example, we plotted their histogram as shown in Figure 4. As expected, in most cases, the red color values (plot- ted in dark blue) is the highest value, followed by green color values (plotted in pink), and finally the blue color values (plotted in yellow) is the smallest value of the three components. Examining the statistics of the hemo- globin values of the test samples supplied by the Prince George Hospital Lab. including the maximum and minimum values of the set, we found that the set maxi- mum value is 185 g/L, and the minimum value is 57.30 g/L, and the average value is 132.51 g/L. This statistics helps determine the range of the set, which facilitates modeling the data. The hemoglobin values of 900 sam- ples histogram is plotted and shown in Figure 5 and the last 100 samples are plotted and shown in Figure 6 for clarity and ease of tracking. Figure 4. Histogram of the blood samples color ranges Figure 5. Histogram of the hemoglobin values of the 900 blood samples 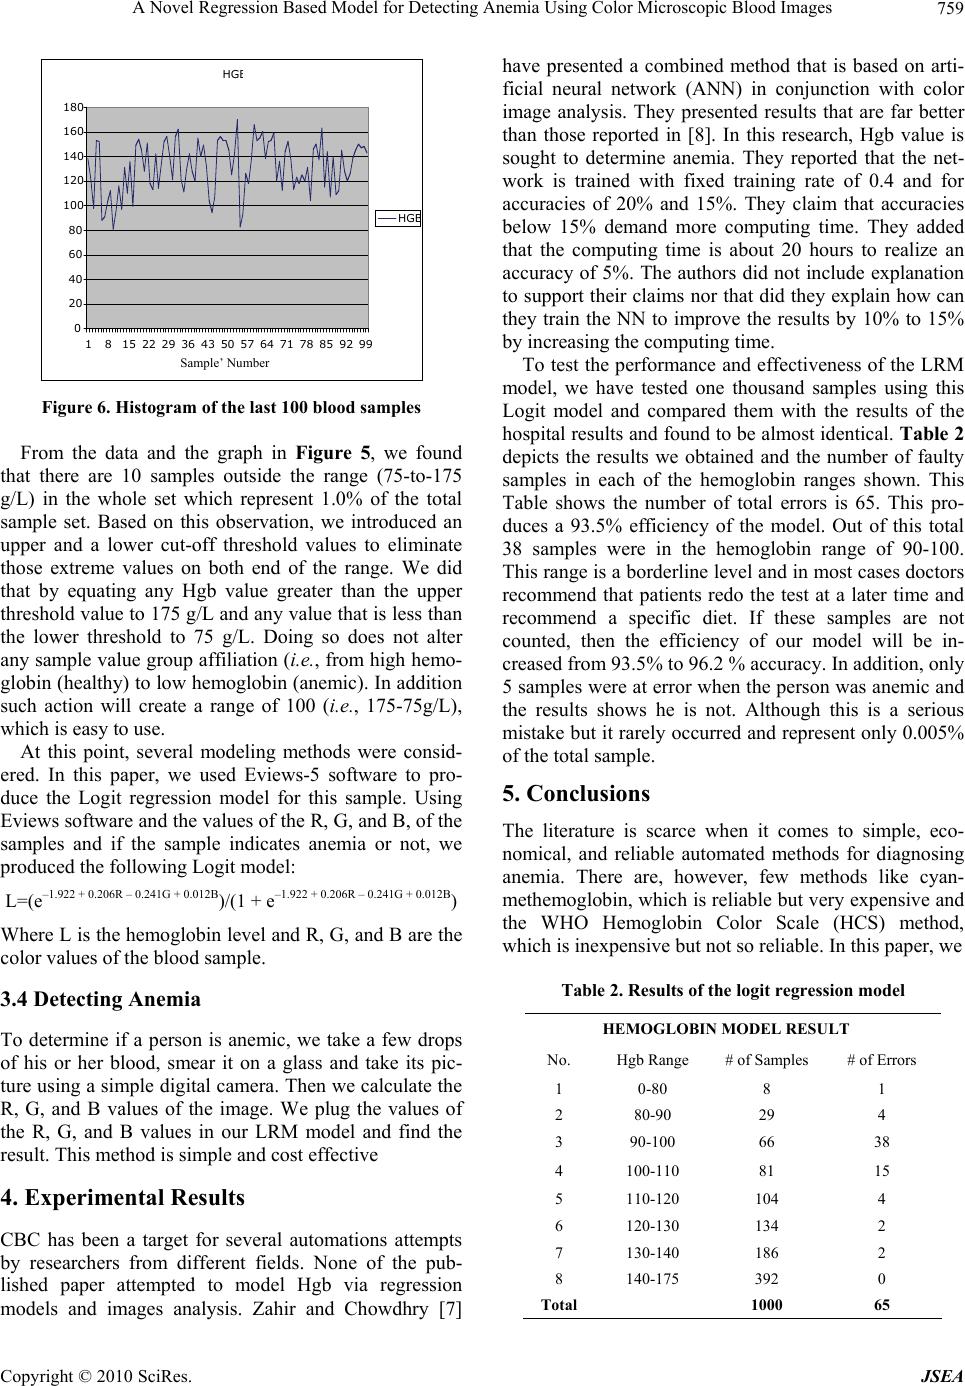 A Novel Regression Based Model for Detecting Anemia Using Color Microscopic Blood Images Copyright © 2010 SciRes. JSEA 759 HG B 0 20 40 60 80 100 120 140 160 180 1815 22 29 36 43 50 57 6471 78 85 92 99 Sam p le's Nu m HG B Figure 6. Histogram of the last 100 blood samples From the data and the graph in Figure 5, we found that there are 10 samples outside the range (75-to-175 g/L) in the whole set which represent 1.0% of the total sample set. Based on this observation, we introduced an upper and a lower cut-off threshold values to eliminate those extreme values on both end of the range. We did that by equating any Hgb value greater than the upper threshold value to 175 g/L and any value that is less than the lower threshold to 75 g/L. Doing so does not alter any sample value group affiliation (i.e. , from high hemo- globin (healthy) to low hemoglobin (anemic). In addition such action will create a range of 100 (i.e., 175-75g/L), which is easy to use. At this point, several modeling methods were consid- ered. In this paper, we used Eviews-5 software to pro- duce the Logit regression model for this sample. Using Eviews software and the values of the R, G, and B, of the samples and if the sample indicates anemia or not, we produced the following Logit model: L=(e–1.922 + 0.206R – 0.241G + 0.012B)/(1 + e–1.922 + 0.206R – 0.241G + 0.012B) Where L is the hemoglobin level and R, G, and B are the color values of the blood sample. 3.4 Detecting Anemia To determine if a person is anemic, we take a few drops of his or her blood, smear it on a glass and take its pic- ture using a simple digital camera. Then we calculate the R, G, and B values of the image. We plug the values of the R, G, and B values in our LRM model and find the result. This method is simple and cost effective 4. Experimental Results CBC has been a target for several automations attempts by researchers from different fields. None of the pub- lished paper attempted to model Hgb via regression models and images analysis. Zahir and Chowdhry [7] have presented a combined method that is based on arti- ficial neural network (ANN) in conjunction with color image analysis. They presented results that are far better than those reported in [8]. In this research, Hgb value is sought to determine anemia. They reported that the net- work is trained with fixed training rate of 0.4 and for accuracies of 20% and 15%. They claim that accuracies below 15% demand more computing time. They added that the computing time is about 20 hours to realize an accuracy of 5%. The authors did not include explanation to support their claims nor that did they explain how can they train the NN to improve the results by 10% to 15% by increasing the computing time. To test the performance and effectiveness of the LRM model, we have tested one thousand samples using this Logit model and compared them with the results of the hospital results and found to be almost identical. Table 2 depicts the results we obtained and the number of faulty samples in each of the hemoglobin ranges shown. This Table shows the number of total errors is 65. This pro- duces a 93.5% efficiency of the model. Out of this total 38 samples were in the hemoglobin range of 90-100. This range is a borderline level and in most cases doctors recommend that patients redo the test at a later time and recommend a specific diet. If these samples are not counted, then the efficiency of our model will be in- creased from 93.5% to 96.2 % accuracy. In addition, only 5 samples were at error when the person was anemic and the results shows he is not. Although this is a serious mistake but it rarely occurred and represent only 0.005% of the total sample. 5. Conclusions The literature is scarce when it comes to simple, eco- nomical, and reliable automated methods for diagnosing anemia. There are, however, few methods like cyan- methemoglobin, which is reliable but very expensive and the WHO Hemoglobin Color Scale (HCS) method, which is inexpensive but not so reliable. In this paper, we Table 2. Results of the logit regression model HEMOGLOBIN MODEL RESULT No. Hgb Range # of Samples # of Errors 1 0-80 8 1 2 80-90 29 4 3 90-100 66 38 4 100-110 81 15 5 110-120 104 4 6 120-130 134 2 7 130-140 186 2 8 140-175 392 0 Total 1000 65 Sample’ Number  A Novel Regression Based Model for Detecting Anemia Using Color Microscopic Blood Images Copyright © 2010 SciRes. JSEA 760 introduced a new logit regression based model that uses image analysis data to detect anemia. The simulation results of the proposed model are significantly higher than the published results. For a set of 1000 sample, our results show an accuracy of 96.2% if we do not consider 38 samples on the borderline between anemic and not anemic which is a grey area for all testing methods. Con- sidering all samples, our model accuracy is 93.5%. In addition to its high accuracy, the proposed model is easy to implement and inexpensive. This model can be build in hardware at a cheep cost. 6. Acknowledgements The authors would like to thank Northern Health Author- ity of British Columbia, Prince George Regional Hospital Laboratory for their continued support to this research. REFERENCES [1] J. B. Henry, “Clinical Diagnosis and Management by Laboratory Methods,” W. B. Saunders, Philadelphia, 2001. [2] http://www.nlm.nih.gov/medlineplus [3] M. Rendell, M. Anderson, W. Schlueter, J. Mailliard, D. Honigs and R. Rosenthal, “Determination of Hemoglobin Levels in The Finger Using Near Infrared Spectroscopy”, Journal of Clinical & Laboratory Haematology, Vol. 25, No. 2, April 2003, pp. 93-97. [4] J. P. Greer, J. Foerster, J. N. Lukens, G. M. Rodgers, F. Paraskevas and B. Glader, “Wintrobe’s Clinical hema- tology,” 11th Edition, Lippincott Williams & Wilkins, Philadelphia, 2003. [5] G. Ongun, U. Halici, K. Leblebicioglu and V. Atalay, “Feature Extraction and Classification of Blood Cells for an Automated Differential Blood Count System,” Inter- national Joint INNS-IEEE Conference on Neural Net- works, Washington DC, Vol. 4, 2001, pp. 2461-2466. [6] CELL-DYN 3200 System Training Guide, 2004. [7] S. Zahir, C. G. Rejaul and W. Payne, “Automated Assessment of Erythrocyte Disorders Using Artificial Neural Network,” IEEE International Symposium on Signal Processing and Information Technology, Vancou- ver, 2006, pp. 776-780. [8] H. Ranganath and N. Gunasekaran, “Artificial Neural Network Approach in Estimation of Hemoglobin in Hu- man Blood,” International Computer Engineering Con- ference on New Technologies for the Information Society, ICENCO, Cairo, 2004, pp. 341-344. |