Paper Menu >>
Journal Menu >>
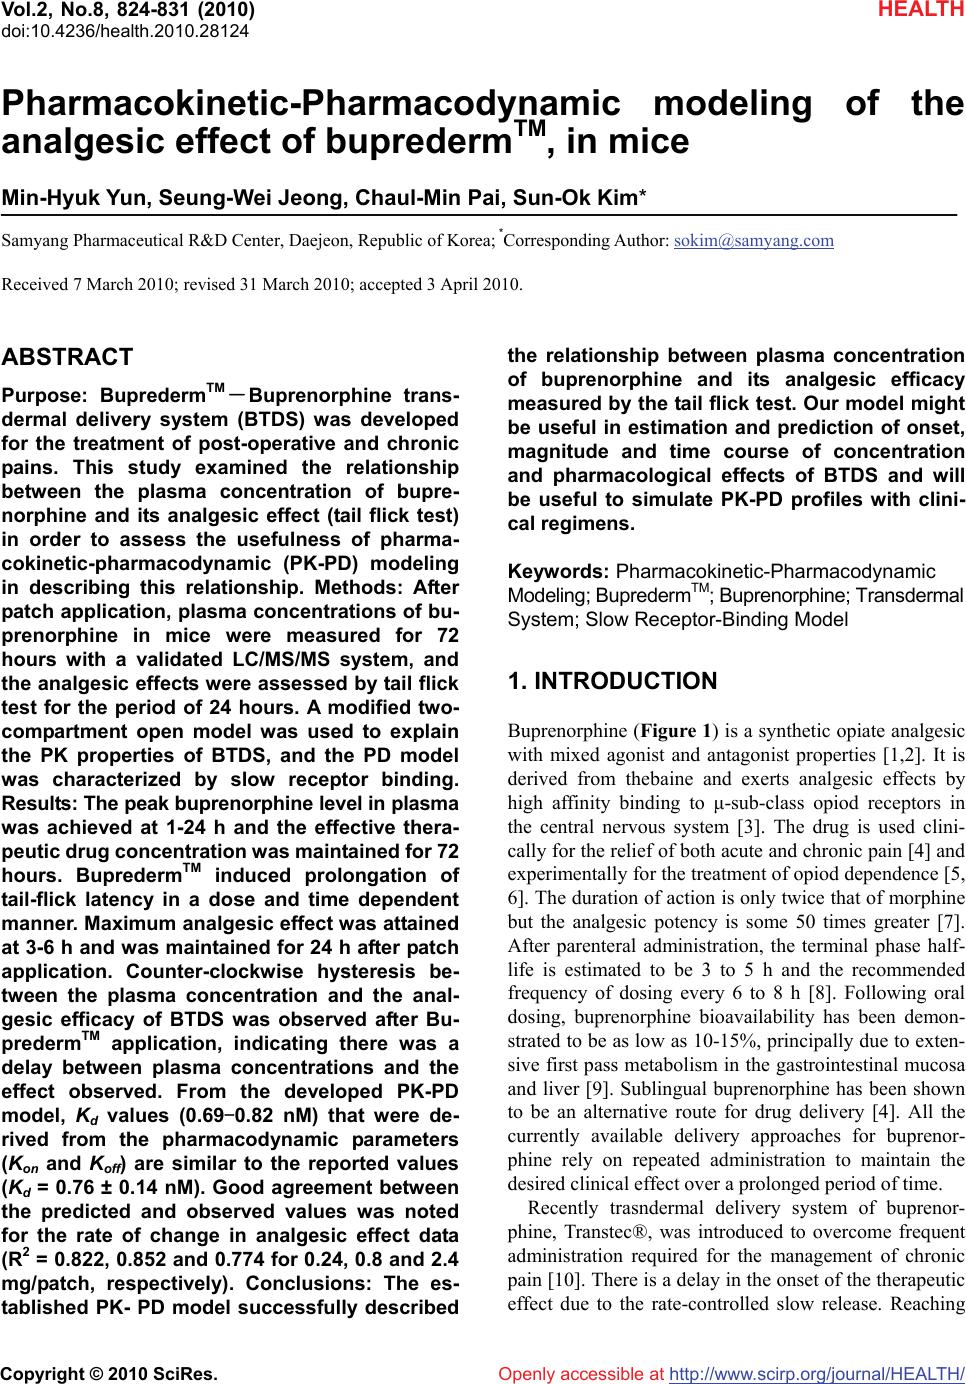 Vol.2, No.8, 824-831 (2010) doi:10.4236/health.2010.28124 Copyright © 2010 SciRes. Openly accessible at http://www.scirp.org/journal/HEALTH/ HEALTH Pharmacokinetic-Pharmacodynamic modeling of the analgesic effect of bupredermTM, in mice Min-Hyuk Yun, Seung-Wei Jeong, Chaul-Min Pai, Sun-Ok Kim* Samyang Pharmaceutical R&D Center, Daejeon, Republic of Korea; *Corresponding Author: sokim@samyang.com Received 7 March 2010; revised 31 March 2010; accepted 3 April 2010. ABSTRACT Purpose: BupredermTM -Buprenorphine trans- dermal delivery system (BTDS) was developed for the treatment of post-operative and chronic pains. This study examined the relationship between the plasma concentration of bupre- norphine and its analgesic effect (tail flick test) in order to assess the usefulness of pharma- cokinetic-pharmacodynamic (PK-PD) modeling in describing this relationship. Methods: After patch application, plasma concentrations of bu- prenorphine in mice were measured for 72 hours with a validated LC/MS/MS system, and the analgesic effects were assessed by tail flick test for the period of 24 hours. A modified two- compartment open model was used to explain the PK properties of BTDS, and the PD model was characterized by slow receptor binding. Results: The peak buprenorphine level in plasma was achieved at 1-24 h and the effective thera- peutic drug concentration was maintained for 72 hours. BupredermTM induced prolongation of tail-flick latency in a dose and time dependent manner. Maximum analgesic effect was attained at 3-6 h and was maintained for 24 h after patch application. Counter-clockwise hysteresis be- tween the plasma concentration and the anal- gesic efficacy of BTDS was observed after Bu- predermTM application, indicating there was a delay between plasma concentrations and the effect observed. From the developed PK-PD model, Kd values (0.69-0.82 nM) that were de- rived from the pharmacodynamic parameters (Kon and Koff) are similar to the reported values (Kd = 0.76 ± 0.14 nM). Good agreement between the predicted and observed values was noted for the rate of change in analgesic effect data (R2 = 0.822, 0.852 and 0.774 for 0.24, 0.8 and 2.4 mg/patch, respectively). Conclusions: The es- tablished PK- PD model successfully described the relationship between plasma concentration of buprenorphine and its analgesic efficacy measured by the tail flick test. Our model might be useful in estimation and prediction of onset, magnitude and time course of concentration and pharmacological effects of BTDS and will be useful to simulate PK-PD profiles with clini- cal regimens. Keywords: Pharmacokinetic-Pharmacodynamic Modeling; BupredermTM; Buprenorphine; Transdermal System; Slow Receptor-Binding Model 1. INTRODUCTION Buprenorphine (Figure 1) is a synthetic opiate analgesic with mixed agonist and antagonist properties [1,2]. It is derived from thebaine and exerts analgesic effects by high affinity binding to μ-sub-class opiod receptors in the central nervous system [3]. The drug is used clini- cally for the relief of both acute and chronic pain [4] and experimentally for the treatment of opiod dependence [5, 6]. The duration of action is only twice that of morphine but the analgesic potency is some 50 times greater [7]. After parenteral administration, the terminal phase half- life is estimated to be 3 to 5 h and the recommended frequency of dosing every 6 to 8 h [8]. Following oral dosing, buprenorphine bioavailability has been demon- strated to be as low as 10-15%, principally due to exten- sive first pass metabolism in the gastrointestinal mucosa and liver [9]. Sublingual buprenorphine has been shown to be an alternative route for drug delivery [4]. All the currently available delivery approaches for buprenor- phine rely on repeated administration to maintain the desired clinical effect over a prolonged period of time. Recently trasndermal delivery system of buprenor- phine, Transtec®, was introduced to overcome frequent administration required for the management of chronic pain [10]. There is a delay in the onset of the therapeutic effect due to the rate-controlled slow release. Reaching 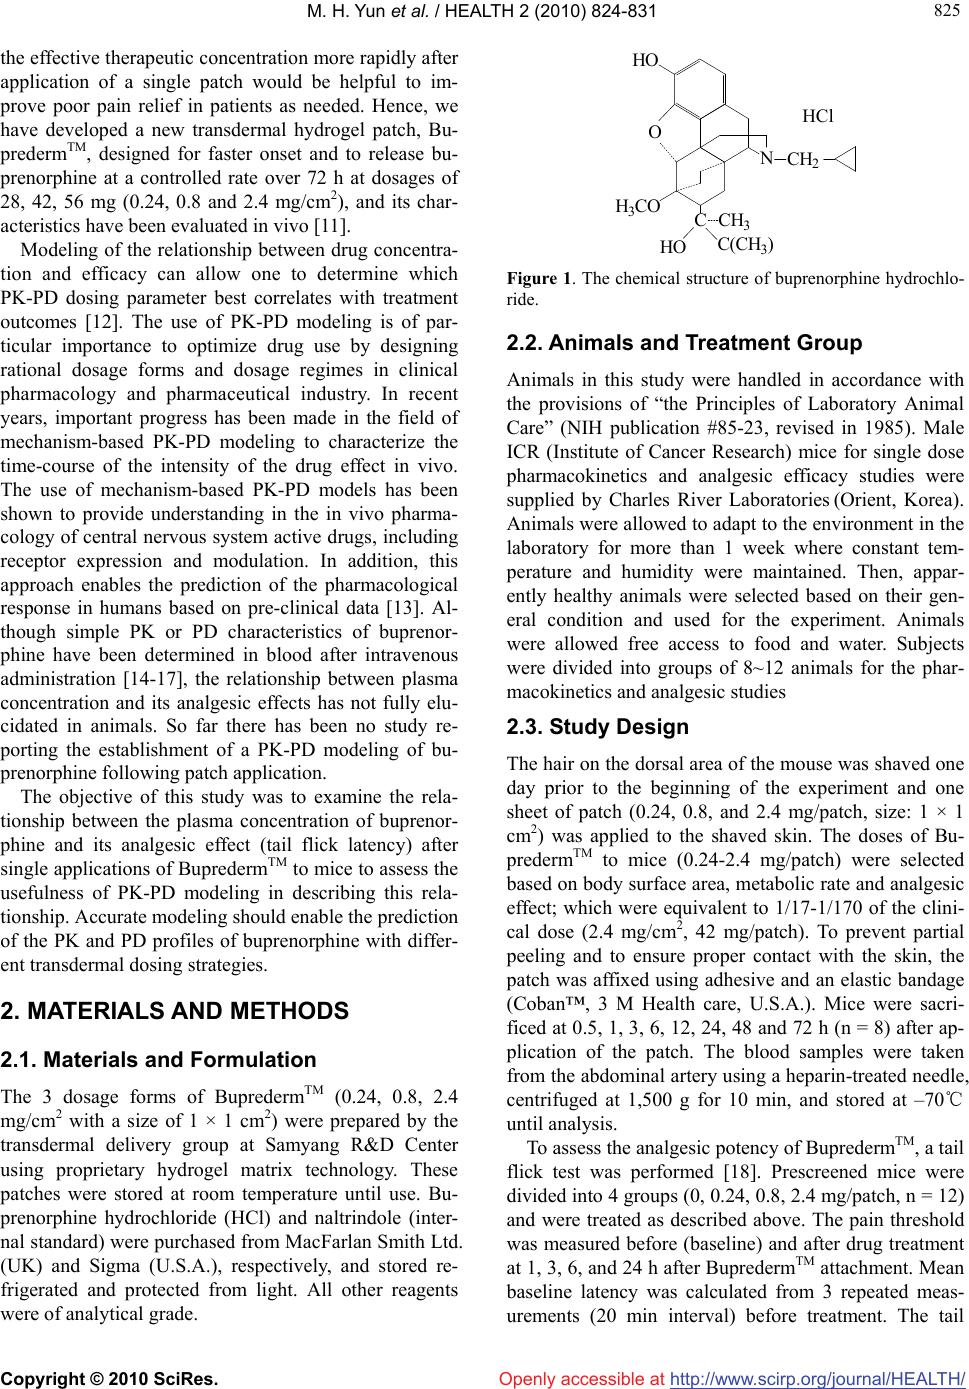 M. H. Yun et al. / HEALTH 2 (2010) 824-831 Copyright © 2010 SciRes. http://www.scirp.org/journal/HEALTH/ 825 825 Openly accessible at the effective therapeutic concentration more rapidly after application of a single patch would be helpful to im- prove poor pain relief in patients as needed. Hence, we have developed a new transdermal hydrogel patch, Bu- predermTM, designed for faster onset and to release bu- prenorphine at a controlled rate over 72 h at dosages of 28, 42, 56 mg (0.24, 0.8 and 2.4 mg/cm2), and its char- acteristics have been evaluated in vivo [11]. Modeling of the relationship between drug concentra- tion and efficacy can allow one to determine which PK-PD dosing parameter best correlates with treatment outcomes [12]. The use of PK-PD modeling is of par- ticular importance to optimize drug use by designing rational dosage forms and dosage regimes in clinical pharmacology and pharmaceutical industry. In recent years, important progress has been made in the field of mechanism-based PK-PD modeling to characterize the time-course of the intensity of the drug effect in vivo. The use of mechanism-based PK-PD models has been shown to provide understanding in the in vivo pharma- cology of central nervous system active drugs, including receptor expression and modulation. In addition, this approach enables the prediction of the pharmacological response in humans based on pre-clinical data [13]. Al- though simple PK or PD characteristics of buprenor- phine have been determined in blood after intravenous administration [14-17], the relationship between plasma concentration and its analgesic effects has not fully elu- cidated in animals. So far there has been no study re- porting the establishment of a PK-PD modeling of bu- prenorphine following patch application. The objective of this study was to examine the rela- tionship between the plasma concentration of buprenor- phine and its analgesic effect (tail flick latency) after single applications of BupredermTM to mice to assess the usefulness of PK-PD modeling in describing this rela- tionship. Accurate modeling should enable the prediction of the PK and PD profiles of buprenorphine with differ- ent transdermal dosing strategies. 2. MATERIALS AND METHODS 2.1. Materials and Formulation The 3 dosage forms of BupredermTM (0.24, 0.8, 2.4 mg/c m 2 with a size of 1 × 1 cm2) were prepared by the transdermal delivery group at Samyang R&D Center using proprietary hydrogel matrix technology. These patches were stored at room temperature until use. Bu- prenorphine hydrochloride (HCl) and naltrindole (inter- nal standard) were purchased from MacFarlan Smith Ltd. (UK) and Sigma (U.S.A.), respectively, and stored re- frigerated and protected from light. All other reagents were of analytical grade. HO NCH2 CH3 C(CH3) HO H3CO O C HCl Figure 1. The chemical structure of buprenorphine hydrochlo- ride. 2.2. Animals and Treatment Group Animals in this study were handled in accordance with the provisions of “the Principles of Laboratory Animal Care” (NIH publication #85-23, revised in 1985). Male ICR (Institute of Cancer Research) mice for single dose pharmacokinetics and analgesic efficacy studies were supplied by Charles River Laboratories (Orient, Korea). Animals were allowed to adapt to the environment in the laboratory for more than 1 week where constant tem- perature and humidity were maintained. Then, appar- ently healthy animals were selected based on their gen- eral condition and used for the experiment. Animals were allowed free access to food and water. Subjects were divided into groups of 8~12 animals for the phar- macokinetics and analgesic studies 2.3. Study Design The hair on the dorsal area of the mouse was shaved one day prior to the beginning of the experiment and one sheet of patch (0.24, 0.8, and 2.4 mg/patch, size: 1 × 1 cm2) was applied to the shaved skin. The doses of Bu- predermTM to mice (0.24-2.4 mg/patch) were selected based on body surface area, metabolic rate and analgesic effect; which were equivalent to 1/17-1/170 of the clini- cal dose (2.4 mg/cm2, 42 mg/patch). To prevent partial peeling and to ensure proper contact with the skin, the patch was affixed using adhesive and an elastic bandage (Coban™, 3 M Health care, U.S.A.). Mice were sacri- ficed at 0.5, 1, 3, 6, 12, 24, 48 and 72 h (n = 8) after ap- plication of the patch. The blood samples were taken from the abdominal artery using a heparin-treated needle, centrifuged at 1,500 g for 10 min, and stored at –70℃ until analysis. To assess the analgesic potency of BupredermTM, a tail flick test was performed [18]. Prescreened mice were divided into 4 groups (0, 0.24, 0.8, 2.4 mg/patch, n = 12) and were treated as described above. The pain threshold was measured before (baseline) and after drug treatment at 1, 3, 6, and 24 h after BupredermTM attachment. Mean baseline latency was calculated from 3 repeated meas- urements (20 min interval) before treatment. The tail 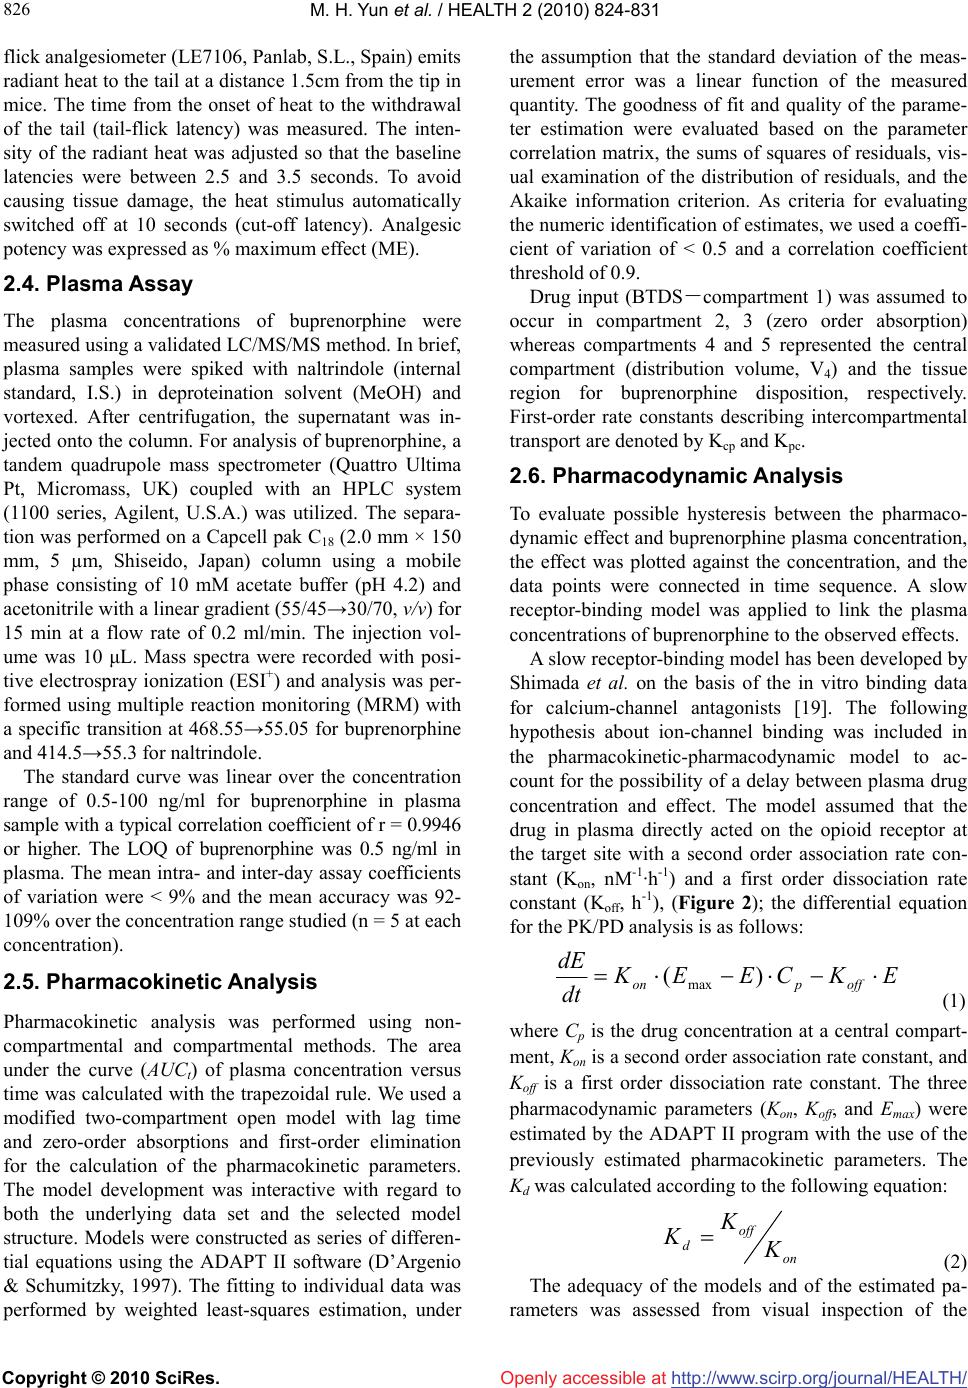 M. H. Yun et al. / HEALTH 2 (2010) 824-831 Copyright © 2010 SciRes. http://www.scirp.org/journal/HEALTH/ 826 Openly accessible at flick analgesiometer (LE7106, Panlab, S.L., Spain) emits radiant heat to the tail at a distance 1.5cm from the tip in mice. The time from the onset of heat to the withdrawal of the tail (tail-flick latency) was measured. The inten- sity of the radiant heat was adjusted so that the baseline latencies were between 2.5 and 3.5 seconds. To avoid causing tissue damage, the heat stimulus automatically switched off at 10 seconds (cut-off latency). Analgesic potency was expressed as % maximum effect (ME). 2.4. Plasma Assay The plasma concentrations of buprenorphine were measured using a validated LC/MS/MS method. In brief, plasma samples were spiked with naltrindole (internal standard, I.S.) in deproteination solvent (MeOH) and vortexed. After centrifugation, the supernatant was in- jected onto the column. For analysis of buprenorphine, a tandem quadrupole mass spectrometer (Quattro Ultima Pt, Micromass, UK) coupled with an HPLC system (1100 series, Agilent, U.S.A.) was utilized. The separa- tion was performed on a Capcell pak C18 (2.0 mm × 150 mm, 5 µm, Shiseido, Japan) column using a mobile phase consisting of 10 mM acetate buffer (pH 4.2) and acetonitrile with a linear gradient (55/45→30/70, v/v) for 15 min at a flow rate of 0.2 ml/min. The injection vol- ume was 10 μL. Mass spectra were recorded with posi- tive electrospray ionization (ESI+) and analysis was per- formed using multiple reaction monitoring (MRM) with a specific transition at 468.55→55.05 for buprenorphine and 414.5→55.3 for naltrindole. The standard curve was linear over the concentration range of 0.5-100 ng/ml for buprenorphine in plasma sample with a typical correlation coefficient of r = 0.9946 or higher. The LOQ of buprenorphine was 0.5 ng/ml in plasma. The mean intra- and inter-day assay coefficients of variation were < 9% and the mean accuracy was 92- 109% over the concentration range studied (n = 5 at each concentration). 2.5. Pharmacokinetic Analysis Pharmacokinetic analysis was performed using non- compartmental and compartmental methods. The area under the curve (AUCt) of plasma concentration versus time was calculated with the trapezoidal rule. We used a modified two-compartment open model with lag time and zero-order absorptions and first-order elimination for the calculation of the pharmacokinetic parameters. The model development was interactive with regard to both the underlying data set and the selected model structure. Models were constructed as series of differen- tial equations using the ADAPT II software (D’Argenio & Schumitzky, 1997). The fitting to individual data was performed by weighted least-squares estimation, under the assumption that the standard deviation of the meas- urement error was a linear function of the measured quantity. The goodness of fit and quality of the parame- ter estimation were evaluated based on the parameter correlation matrix, the sums of squares of residuals, vis- ual examination of the distribution of residuals, and the Akaike information criterion. As criteria for evaluating the numeric identification of estimates, we used a coeffi- cient of variation of < 0.5 and a correlation coefficient threshold of 0.9. Drug input (BTDS-compartment 1) was assumed to occur in compartment 2, 3 (zero order absorption) whereas compartments 4 and 5 represented the central compartment (distribution volume, V4) and the tissue region for buprenorphine disposition, respectively. First-order rate constants describing intercompartmental transport are denoted by Kcp and Kpc. 2.6. Pharmacodynamic Analysis To evaluate possible hysteresis between the pharmaco- dynamic effect and buprenorphine plasma concentration, the effect was plotted against the concentration, and the data points were connected in time sequence. A slow receptor-binding model was applied to link the plasma concentrations of buprenorphine to the observed effects. A slow receptor-binding model has been developed by Shimada et al. on the basis of the in vitro binding data for calcium-channel antagonists [19]. The following hypothesis about ion-channel binding was included in the pharmacokinetic-pharmacodynamic model to ac- count for the possibility of a delay between plasma drug concentration and effect. The model assumed that the drug in plasma directly acted on the opioid receptor at the target site with a second order association rate con- stant (Kon, nM-1·h-1) and a first order dissociation rate constant (Koff, h-1), (Figure 2); the differential equation for the PK/PD analysis is as follows: EKCEEK dt dE offpon )( max (1) where Cp is the drug concentration at a central compart- ment, Kon is a second order association rate constant, and Koff is a first order dissociation rate constant. The three pharmacodynamic parameters (Kon, K off, and Emax) were estimated by the ADAPT II program with the use of the previously estimated pharmacokinetic parameters. The Kd was calculated according to the following equation: on off dK K K (2) The adequacy of the models and of the estimated pa- rameters was assessed from visual inspection of the 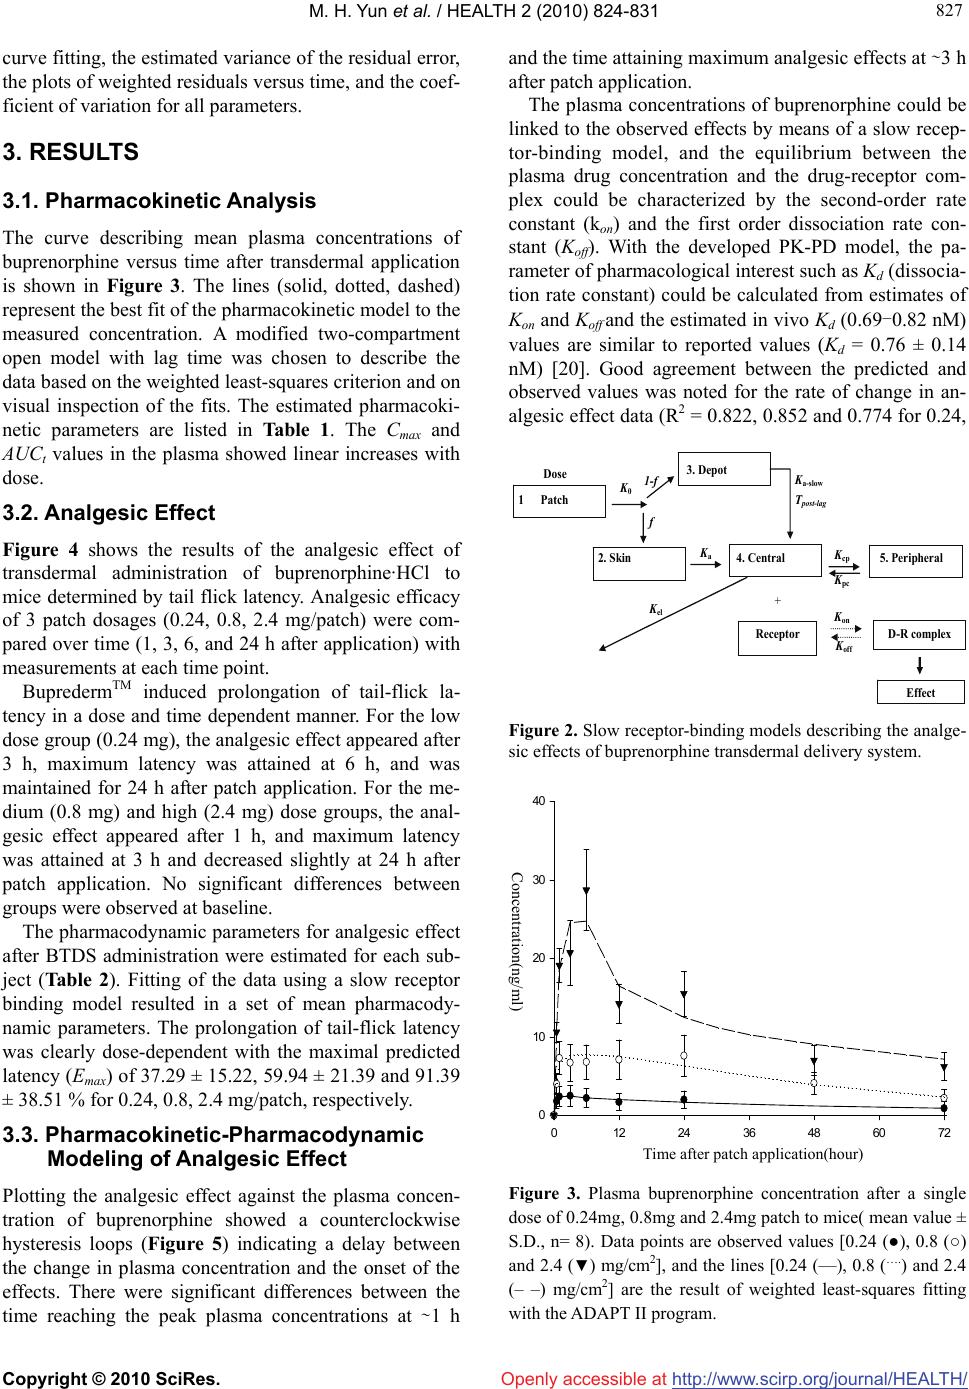 M. H. Yun et al. / HEALTH 2 (2010) 824-831 Copyright © 2010 SciRes. http://www.scirp.org/journal/HEALTH/ 827 827 Openly accessible at curve fitting, the estimated variance of the residual error, the plots of weighted residuals versus time, and the coef- ficient of variation for all parameters. 3. RESULTS 3.1. Pharmacokinetic Analysis The curve describing mean plasma concentrations of buprenorphine versus time after transdermal application is shown in Figure 3. The lines (solid, dotted, dashed) represent the best fit of the pharmacokinetic model to the measured concentration. A modified two-compartment open model with lag time was chosen to describe the data based on the weighted least-squares criterion and on visual inspection of the fits. The estimated pharmacoki- netic parameters are listed in Table 1. The Cmax and AUCt values in the plasma showed linear increases with dose. 3.2. Analgesic Effect Figure 4 shows the results of the analgesic effect of transdermal administration of buprenorphine·HCl to mice determined by tail flick latency. Analgesic efficacy of 3 patch dosages (0.24, 0.8, 2.4 mg/patch) were com- pared over time (1, 3, 6, and 24 h after application) with measurements at each time point. BupredermTM induced prolongation of tail-flick la- tency in a dose and time dependent manner. For the low dose group (0.24 mg), the analgesic effect appeared after 3 h, maximum latency was attained at 6 h, and was maintained for 24 h after patch application. For the me- dium (0.8 mg) and high (2.4 mg) dose groups, the anal- gesic effect appeared after 1 h, and maximum latency was attained at 3 h and decreased slightly at 24 h after patch application. No significant differences between groups were observed at baseline. The pharmacodynamic parameters for analgesic effect after BTDS administration were estimated for each sub- ject (Table 2). Fitting of the data using a slow receptor binding model resulted in a set of mean pharmacody- namic parameters. The prolongation of tail-flick latency was clearly dose-dependent with the maximal predicted latency (Emax) of 37.29 ± 15.22, 59.94 ± 21.39 and 91.39 ± 38.51 % for 0.24, 0.8, 2.4 mg/patch, respectively. 3.3. Pharmacokinetic-Pharmacodynamic Modeling of Analgesic Effect Plotting the analgesic effect against the plasma concen- tration of buprenorphine showed a counterclockwise hysteresis loops (Figure 5) indicating a delay between the change in plasma concentration and the onset of the effects. There were significant differences between the time reaching the peak plasma concentrations at ∼1 h and the time attaining maximum analgesic effects at ∼3 h after patch application. The plasma concentrations of buprenorphine could be linked to the observed effects by means of a slow recep- tor-binding model, and the equilibrium between the plasma drug concentration and the drug-receptor com- plex could be characterized by the second-order rate constant (kon) and the first order dissociation rate con- stant (Koff). With the developed PK-PD model, the pa- rameter of pharmacological interest such as Kd (dissocia- tion rate constant) could be calculated from estimates of Kon and Koff and the estimated in vivo Kd (0.69-0.82 nM) values are similar to reported values (Kd = 0.76 ± 0.14 nM) [20]. Good agreement between the predicted and observed values was noted for the rate of change in an- algesic effect data (R2 = 0.822, 0.852 and 0.774 for 0.24, K c p K p c Effect D-R complex K off K o n Dose 2. Skin 4. Central 5. Peripheral K a K el + 1 Patch 3. Depot K 0 f 1-f K a-slow T post-lag Receptor Figure 2. Slow receptor-binding models describing the analge- sic effects of buprenorphine transdermal delivery system. Time after patch application (hour) 0 12243648607 0 10 20 30 40 Concentration (ng/ml) Concentration(ng/ml) 2 Time after patch application(hour) Figure 3. Plasma buprenorphine concentration after a single dose of 0.24mg, 0.8mg and 2.4mg patch to mice( mean value ± S.D., n= 8). Data points are observed values [0.24 (●), 0.8 (○) and 2.4 (▼) mg/cm2], and the lines [0.24 (—), 0.8 (….) and 2.4 (– –) mg/cm2] are the result of weighted least-squares fitting with the ADAPT II program. 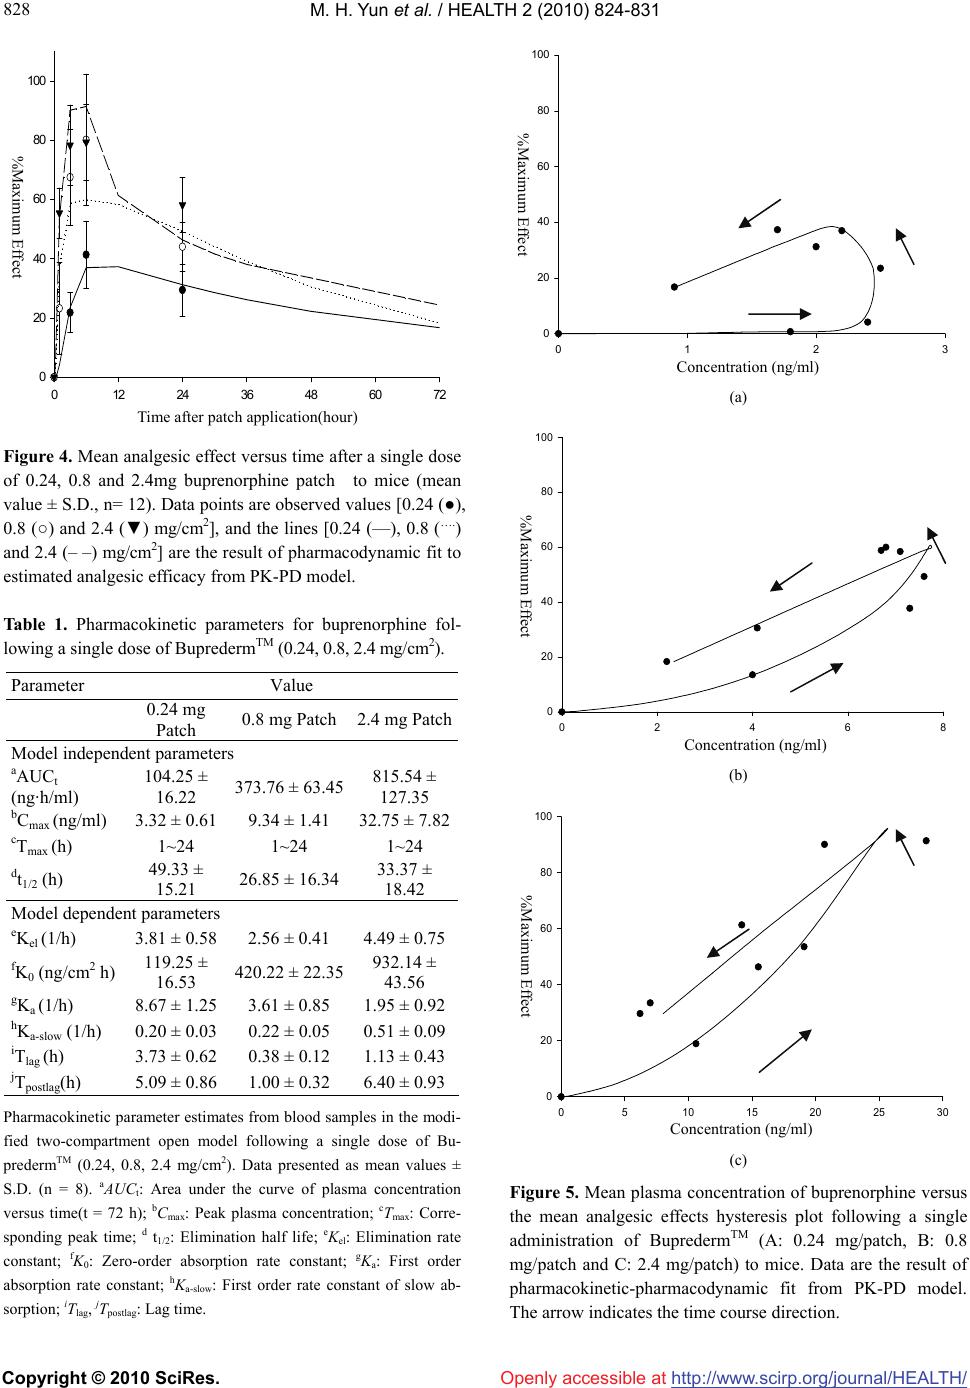 M. H. Yun et al. / HEALTH 2 (2010) 824-831 Copyright © 2010 SciRes. http://www.scirp.org/journal/HEALTH/ 828 Openly accessible at Time after patch application (hour) 0 12243648607 % Maximum Effect 2 0 20 40 60 80 100 Figure 4. Mean analgesic effect versus time after a single dose of 0.24, 0.8 and 2.4mg buprenorphine patch to mice (mean value ± S.D., n= 12). Data points are observed values [0.24 (●), 0.8 (○) and 2.4 (▼) mg/cm2], and the lines [0.24 (—), 0.8 (….) and 2.4 (– –) mg/cm2] are the result of pharmacodynamic fit to estimated analgesic efficacy from PK-PD model. Table 1. Pharmacokinetic parameters for buprenorphine fol- lowing a single dose of BupredermTM (0.24, 0.8, 2.4 mg/cm2). Parameter Value 0.24 mg Patch 0.8 mg Patch 2.4 mg Patch Model independent parameters aAUCt (ng·h/ml) 104.25 ± 16.22 373.76 ± 63.45 815.54 ± 127.35 bCmax (ng/ml) 3.32 ± 0.61 9.34 ± 1.41 32.75 ± 7.82 cTmax (h) 1~24 1~24 1~24 dt1/2 (h) 49.33 ± 15.21 26.85 ± 16.34 33.37 ± 18.42 Model dependent parameters eKel (1/h) 3.81 ± 0.58 2.56 ± 0.41 4.49 ± 0.75 fK0 (ng/cm2 h) 119.25 ± 16.53 420.22 ± 22.35 932.14 ± 43.56 gKa (1/h) 8.67 ± 1.25 3.61 ± 0.85 1.95 ± 0.92 hKa-slow (1/h) 0.20 ± 0.03 0.22 ± 0.05 0.51 ± 0.09 iTlag (h) 3.73 ± 0.62 0.38 ± 0.12 1.13 ± 0.43 jTpostlag(h) 5.09 ± 0.86 1.00 ± 0.32 6.40 ± 0.93 Pharmacokinetic parameter estimates from blood samples in the modi- fied two-compartment open model following a single dose of Bu- predermTM (0.24, 0.8, 2.4 mg/cm2). Data presented as mean values ± S.D. (n = 8). aAUCt: Area under the curve of plasma concentration versus time(t = 72 h); bCmax : Peak plasma concentration; cTmax: Corre- sponding peak time; d t1/2: Elimination half life; eKel: Elimination rate constant; fK0: Zero-order absorption rate constant; gKa: First order absorption rate constant; hKa-slow: First order rate constant of slow ab- sorption; iTlag, jTpostlag: Lag time. Concentration (ng/ml) 0123 % Maximum Effect 0 20 40 60 80 100 %Maximum Effect %Maximum Effect (a) Concentration (ng/ml) 0246 % Maximum Effect 8 0 20 40 60 80 100 (b) Concentration (ng/ml) 0510 15 20 25 30 %ect Maximum Eff 0 20 40 60 80 100 Concentration (ng/ml) Time after patch application(hour) %Maximum Effect Concentration (ng/ml) %Maximum Effect Concentration (ng/ml) (c) Figure 5. Mean plasma concentration of buprenorphine versus the mean analgesic effects hysteresis plot following a single administration of BupredermTM (A: 0.24 mg/patch, B: 0.8 mg/patch and C: 2.4 mg/patch) to mice. Data are the result of pharmacokinetic-pharmacodynamic fit from PK-PD model. The arrow indicates the time course direction. 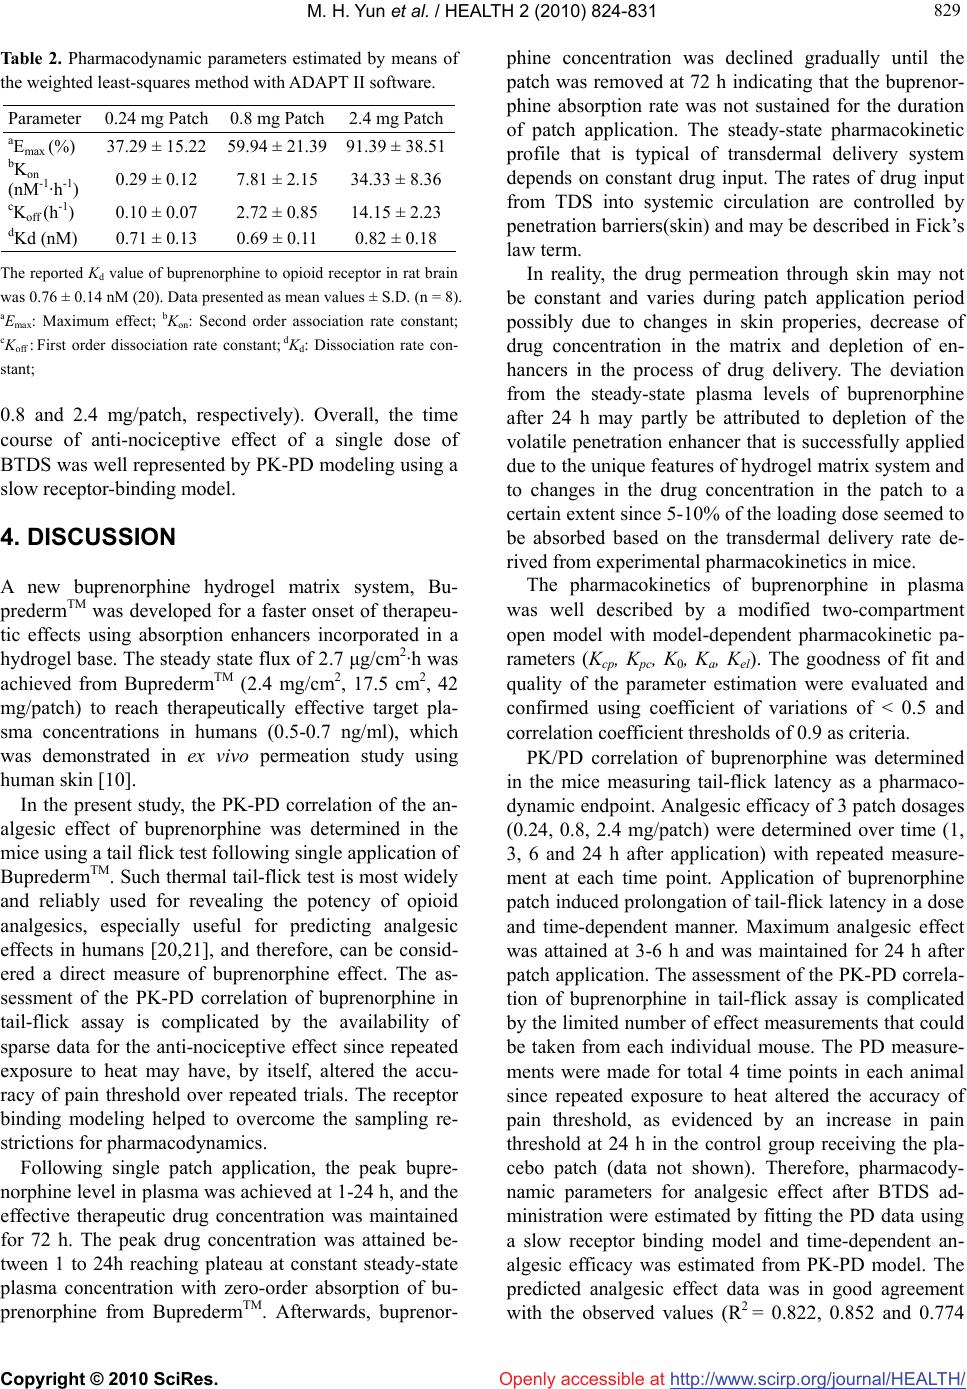 M. H. Yun et al. / HEALTH 2 (2010) 824-831 Copyright © 2010 SciRes. http://www.scirp.org/journal/HEALTH/Openly accessible at 829 829 Table 2. Pharmacodynamic parameters estimated by means of the weighted least-squares method with ADAPT II software. Parameter 0.24 mg Patch 0.8 mg Patch 2.4 mg Patch aEmax (%) 37.29 ± 15.22 59.94 ± 21.39 91.39 ± 38.51 bKon (nM-1·h-1) 0.29 ± 0.12 7.81 ± 2.15 34.33 ± 8.36 cKoff (h-1) 0.10 ± 0.07 2.72 ± 0.85 14.15 ± 2.23 dKd (nM) 0.71 ± 0.13 0.69 ± 0.11 0.82 ± 0.18 The reported Kd value of buprenorphine to opioid receptor in rat brain was 0.76 ± 0.14 nM (20). Data presented as mean values ± S.D. (n = 8). aEmax: Maximum effect; bKon: Second order association rate constant; cKoff : First order dissociation rate constant; dKd: Dissociation rate con- stant; 0.8 and 2.4 mg/patch, respectively). Overall, the time course of anti-nociceptive effect of a single dose of BTDS was well represented by PK-PD modeling using a slow receptor-binding model. 4. DISCUSSION A new buprenorphine hydrogel matrix system, Bu- predermTM was developed for a faster onset of therapeu- tic effects using absorption enhancers incorporated in a hydrogel base. The steady state flux of 2.7 μg/cm2·h was achieved from BupredermTM (2.4 mg/cm2, 17.5 cm2, 42 mg/patch) to reach therapeutically effective target pla- sma concentrations in humans (0.5-0.7 ng/ml), which was demonstrated in ex vivo permeation study using human skin [10]. In the present study, the PK-PD correlation of the an- algesic effect of buprenorphine was determined in the mice using a tail flick test following single application of BupredermTM. Such thermal tail-flick test is most widely and reliably used for revealing the potency of opioid analgesics, especially useful for predicting analgesic effects in humans [20,21], and therefore, can be consid- ered a direct measure of buprenorphine effect. The as- sessment of the PK-PD correlation of buprenorphine in tail-flick assay is complicated by the availability of sparse data for the anti-nociceptive effect since repeated exposure to heat may have, by itself, altered the accu- racy of pain threshold over repeated trials. The receptor binding modeling helped to overcome the sampling re- strictions for pharmacodynamics. Following single patch application, the peak bupre- norphine level in plasma was achieved at 1-24 h, and the effective therapeutic drug concentration was maintained for 72 h. The peak drug concentration was attained be- tween 1 to 24h reaching plateau at constant steady-state plasma concentration with zero-order absorption of bu- prenorphine from BupredermTM. Afterwards, buprenor- phine concentration was declined gradually until the patch was removed at 72 h indicating that the buprenor- phine absorption rate was not sustained for the duration of patch application. The steady-state pharmacokinetic profile that is typical of transdermal delivery system depends on constant drug input. The rates of drug input from TDS into systemic circulation are controlled by penetration barriers(skin) and may be described in Fick’s law term. In reality, the drug permeation through skin may not be constant and varies during patch application period possibly due to changes in skin properies, decrease of drug concentration in the matrix and depletion of en- hancers in the process of drug delivery. The deviation from the steady-state plasma levels of buprenorphine after 24 h may partly be attributed to depletion of the volatile penetration enhancer that is successfully applied due to the unique features of hydrogel matrix system and to changes in the drug concentration in the patch to a certain extent since 5-10% of the loading dose seemed to be absorbed based on the transdermal delivery rate de- rived from experimental pharmacokinetics in mice. The pharmacokinetics of buprenorphine in plasma was well described by a modified two-compartment open model with model-dependent pharmacokinetic pa- rameters (Kcp, Kpc, K0, Ka, Kel). The goodness of fit and quality of the parameter estimation were evaluated and confirmed using coefficient of variations of < 0.5 and correlation coefficient thresholds of 0.9 as criteria. PK/PD correlation of buprenorphine was determined in the mice measuring tail-flick latency as a pharmaco- dynamic endpoint. Analgesic efficacy of 3 patch dosages (0.24, 0.8, 2.4 mg/patch) were determined over time (1, 3, 6 and 24 h after application) with repeated measure- ment at each time point. Application of buprenorphine patch induced prolongation of tail-flick latency in a dose and time-dependent manner. Maximum analgesic effect was attained at 3-6 h and was maintained for 24 h after patch application. The assessment of the PK-PD correla- tion of buprenorphine in tail-flick assay is complicated by the limited number of effect measurements that could be taken from each individual mouse. The PD measure- ments were made for total 4 time points in each animal since repeated exposure to heat altered the accuracy of pain threshold, as evidenced by an increase in pain threshold at 24 h in the control group receiving the pla- cebo patch (data not shown). Therefore, pharmacody- namic parameters for analgesic effect after BTDS ad- ministration were estimated by fitting the PD data using a slow receptor binding model and time-dependent an- algesic efficacy was estimated from PK-PD model. The predicted analgesic effect data was in good agreement with the observed values (R2 = 0.822, 0.852 and 0.774  M. H. Yun et al. / HEALTH 2 (2010) 824-831 Copyright © 2010 SciRes. http://www.scirp.org/journal/HEALTH/ 830 Openly accessible at for 0.24, 0.8 and 2.4 mg/patch, respectively). From the developed PK-PD model, Kd values (0.69-0.82 nM) that were derived from the pharmacodynamic parameters (Kon and Koff) are similar to the reported values (Kd = 0.76 ± 0.14 nM) [20] indicating that the established PK-PD model well represents analgesic effect of BTDS. Plotting the analgesic effect against the plasma con- centration of buprenorphine resulted a counterclockwise hysteresis loops indicating there was a delay between plasma concentrations and the effects observed after BTDS administration. It is well known that the analgesic effect of buprenor- phine is mediated by interaction with the μ-type of opioid receptor [22,23] localized in various brain regions and binding to the μ-receptor. is sustained due to its slow receptor equilibration kinetics [14,24]. Hence, the time course of buprenorphine effect is influenced by target binding equilibration. In conclusion, we were able to describe the analgesic effect of buprenorphine transdermal delivery system using a slow receptor-binding model. The established PK-PD model successfully described the relationship between plasma concentration and its analgesic efficacy measured by the tail flick test. Our model might be use- ful in estimation and prediction of onset, magnitude and time course of concentration and pharmacological ef- fects of BTDS and will be useful to simulate PK-PD profiles with clinical regimens. REFERENCES [1] Jasinski, D.R., Pevnick, J.S. and Griffith, J.D. (1978) Human pharmacology and abuse potential of the analge- sic buprenorphine. Archives of General Psychiatry, 35(4), 501-516. [2] Lewis, J.W. (1985) Buprenorphine. Drug and Alcohol Dependence, 14(3-4), 363-372. [3] Hambrook, J.M. and Rance, M.J. (1976) The interaction of buprenorphine with opiate receptor. In: Kosterlitz, H.W., Ed., Opiates and Endogenous Opioid Peptides, Elsevier/North Holland Biomedical Press, Amsterdam, 295-301. [4] Adrianensen, H., Mattlaer, B. and Vanmeenen, H. (1985) A longtermopen, clinical and pharmacokinetic assess- ment of sublingual buprenorphine in patients suffering from chronic pain. Acta Anaesthesiologica, 36(1), 33-40. [5] Amass, L., Bickel, W.K., Higgins, S.T. and Badger, G.J. (1994) Alternate-day dosing during buprenorphine treat- ment of opoid dependence. Life Science, 54(17), 1215- 1228. [6] Strain, E.C., Stitzer, M.L., Liebson, L.A. and Bigelow, G.E. (1994) Comparison of buprenorphine and metha- done in the treatment of opiod dependence. American Journal of Psychiatry, 151(7), 1025-1030. [7] Downing, J.W., Leary, W.P. and White, E.S. (1977) Bu- prenorphine: A new potent long-acting synthetic analge- sic. Comparison with morphine. British Journal of An- aesthesia, 49(3), 251-255. [8] Bullingham, R.E.S., McQuay, H.J., Moore, A. and Ben- nett, M.D.R. (1980) Buprenorphine kinetics. Clinical Pharmacology & Therapeutics, 28(5), 667-672. [9] Walsh, S.L, Preston, K.L., Stitzer, M.L., Cone, E.J. and Bigelow, G.E. (1994) Clinical Pharmacology of bupre- norphine: Ceiling effects at high doses, Clinical Phar- macology & Therapeutics, 55(5), 569-580. [10] Evans, H.C. (2003) Transdermal buprenorphine. Drugs, 63(19), 1999-2010. [11] Park, I., Kim, D.W., Song, J.D., In, C.H., Jeong, S.W., Lee, S.H., Min, B.C., Lee D.H. and Kim, S.O. (2008) BupredermTM, a new transdermal delivery system of bu- prenorphine: Pharmacokinetic, efficacy and skin irritancy studies. Pharmaceutical Research, in press. [12] Perez-Urizar, J., Granados-Soto, V. and Flores-Murrieta, F.J. (2000) Pharmacokinetic-pharmacodynamic modeling: Why? Archives of Medical Research, 31(6), 539-545. [13] Van der Graaf, P.H. and Danhof, M. (1997) Analysis of frug-receptor interactions in vivo: A new approach in pharmacokinetic-parmacodynamic modeling. International Journal of Clinical Pharmacology, Therapy & Toxicol- ogy, 35, 442-446. [14] Gopal, S., Tzeng, T-B. and Cowan, A. (2002) Charac- terization of the pharmacokinetics of buprenorphine and norbuprenorphine in rats after intravenous bolus admini- stration of buprenorphine. European Journal of Pharma- ceutical Sciences, 15(3), 287-293. [15] Kogel, B., Christoph, T., Straβburger, W. and Friderichs, E. (2005) Interation of μ-opioid receptor agonists and antagonists with the analgesic effect of buprenorphine in mice. European Journal of Pain, 9(5), 599-611. [16] Ohtani, M., Kotaki, H., Sawada, Y. and Iga, T. (1995) Comparative analysis of buprenorphine- & norbupre- norphine-induced analgesic effects based on pharma- cokinetic-pharmacodynamic modeling. Journal of Phar- macology and Experimental Therapeutics, 272(2), 505- 510. [17] Yassen, A., Olofsen, E., Dahan, A. and Danhof, M. (2005) Pharmacokinetic-pharmacodynamic modeling of the antinociceptive effect of buprenorphine and fentanyl in rats: role of receptor equilibration kinetics. Journal of Pharmacology and Experimental Therapeutics, 313(3), 1136-1149. [18] Hernandez-Delgadillo, G.P. and Cruz, S.L. (2006) En- dogenous opioids are involved in morphine and dipyrone analgesic potentiation in the tail flick test in rats. Euro- pean Journal of Pharmacology, 546(1-3), 54-59. [19] Shimada, S., Nakazima, Y., Yamamoto, K., Sawada, Y. and Iga, T. (1996) Comparative pharmacodynamics of eight calcium channel blocking agents in Japanese essen- tial hypertensive patients. Biological & Pharmaceutical Bulletin, 19(3), 430-437. [20] Eaton1, M. (2003) Common animal models for spasticity and pain. Journal of Rehabilitation Research and Devel- opment, 40(4), 41-54. [21] Grumbach, L. (1996) The prediction of analgesic activity in man by animal testing. In: Knighton, R.S. and Dumke, P.R., Eds., 15th International Symposium, Detroit, 1964. Little Brown, Boston, 163-182. [22] Lutfy, K., Eitan, S., Bryant, CD., Yang, YC., Saliminejad,  M. H. Yun et al. / HEALTH 2 (2010) 824-831 Copyright © 2010 SciRes. http://www.scirp.org/journal/HEALTH/Openly accessible at 831 831 N. and Walwyn, W. (2003) Buprenorphine-induced anti- nociception is mediated by muopioid receptors and com- promised by concomitant activation of opioid receptor- like receptors. Journal of Neuroscience, 23(32), 10331- 10337. [23] Villiger, J.W. and Taylor, K.M. (1981) Buprenorphine: characteristics of binding sites in the rat central nervous system. Life Science, 29(26), 2699-2708. [24] Cowan, A. (1995) Updaate on the general pharmacology of buprenorphin. In: Cowan, A. and Lewis J.W., Eds., Buprenorphine: Combating Drug Abuse with a Unique Opioid, Wiley-Liss, New York, 31-47. |