Vol.2, No.8, 846-854 (2010) Natural Science
http://dx.doi.org/10.4236/ns.2010.28106
Copyright © 2010 SciRes. OPEN ACCESS
Codon evolution in double-stranded organelle DNA:
strong regulation of homonucleotides and their analog
alternations
Kenji Sorimachi
Educational Support Center, Dokkyo Medical University, Tochigi, Japan; kenjis@dokkyomed.ac.jp
Received 29 April 2010; revised 7 June; accepted 11 June 2010.
ABSTRACT
In our previous study, complete single DNA
strands which were obtained from nuclei, chlo-
roplasts and plant mitochondria obeyed Char-
gaff’s second parity rule, although those which
were obtained from animal mitochondria devi-
ated from the rule. On the other hand, plant mi-
tochondria obeyed another different rule after
their classification. Complete single DNA strand
sequences obtained from chloroplasts, plant
mitochondria, and animal mitochondria, were
divided into the coding and non-coding regions.
The non-coding region, which was the com-
plementary coding region on the reverse strand,
was incorporated as a coding region in the
forward strand. When the nucleotide contents of
the coding region or non-coding regions were
plotted against the composition of the four nu-
cleotides in the complete single DNA strand, it
was determined that chloroplast and plant mi-
tochondrial DNA obeyed Chargaff’s second
parity rule in both the coding and non-coding
regions. However, animal mitochondrial DNA
deviated from this rule. In chloroplast and plant
mitochondrial DNA, which obey Chargaff’s
second parity rule, the lines of regression for G
(purine) and C (pyrimidine) intersected with re-
gression lines for A (purine) and T (pyrimidines),
respectively, at around 0.250 in all cases. On the
other hand, in animal mitochondrial DNA, which
deviates from Chargaff’s second parity rule,
only regression lines due to the content of ho-
monucleotides or their analogs in the coding or
non-coding region against those in the com-
plete single DNA strand intersected at around
0.250 at the horizontal axis. Conversely, the in-
tersection of the two lines of regression (G and
A or C and T) against the contents of heteronu-
cleotides or their analogs shifted from 0.25 in
both coding and non-coding regions. Nucleo-
tide alternations in chloroplasts and plant mi-
tochondria are strictly regulated, not only by the
proportion of homonucleotides and their ana-
logs, but also by the heteronucleotides and their
analogs. They are strictly regulated in animal
mitochondria only by the content of homonu-
cleotides and their analogs.
Keywords: Evolution; Chargaff’s Parity Rules;
Organelle; DNA; Genome; Coding and Non-Coding
Regions
1. INTRODUCTION
“Chargaff’s second parity rule” [1], G C, A T and
[(G + A) (T + C)] is retained in single DNA stranded
that is formed from double-stranded DNA; however, it is
difficult to imagine how the G and C or A and T base
pairs are formed in the single DNA strand, or why G C
and A T. Therefore, the biological significance of
Chargaff’s second parity rule (first described 40 years
ago) has not yet been elucidated because of its unclear
fundamental reasoning. In fact, it is unclear whether
Chargaff’s second parity rule is even linked to biological
evolution. However, recently, this historic puzzle [2], has
been solved, based on the fact that genome nucleotide
composition is homogeneous [3] and that both the for-
ward and reverse strand compositions are very similar
[4]. The second parity rule derives the similarities of
nucleotide composition found between the forward and
reverse strands. On the other hand, nucleotide contents
represented by Chargaff’s first parity rule [5], G = C, A
= T and [(A + G) = (T + C)], excludes biological sig-
nificance, and this rule is mathematically definitive and
independent of biological significance. Under this rule, the
nucleotide contents in nuclei are defined by these equa-
tions in any organism from bacteria to Homo sapiens.
The existence of deviations from Chargaff’s second
rule was reported by other groups [6,7]. Only single
K. Sorimachi / Natural Science 2 (2010) 846-854
Copyright © 2010 SciRes. OPEN ACCESS
847
DNA strands that form double-stranded genomic DNA
obey Chargaff’s second parity rule, whereas organelle
DNA does not obey this rule [8]. Nikolaou and Almiran-
tis reported that mitochondrial DNA might be classified
into three groups based on GC and AT skews, and that
their DNA deviated from Chargaff’s second parity rule
[7]. They also reported that chloroplasts shared the pat-
terns of bacterial genomes [7]. Mitochondrial gene se-
quences support the view that the evolutionary antece-
dents of mitochondria are a subgroup of the al-
pha-Protobacteria [9], such as Rickettsia, Anaplasma,
and Ehrlichia [10]. In addition, molecular phylogenetic
studies showed that the closest bacterial homologs of
chloroplasts are cyanobacteria [11]. Recently, deviations
from Chargaff’s second parity rule in animal mitochon-
drial DNA were attributed to a different rule, and a sin-
gle origin of species was derived from these mathemati-
cal genomic analyses [12]. We have also examined nu-
clear and organelle DNA and shown that the nucleotide
compositions are correlated with each other, and are
correlated within the coding region of nuclear DNA [4].
Additionally, only homonucleotide contents are corre-
lated to each other between the coding or non- coding
regions and the single DNA strand in organelles [13].
These analyses indicate that biological evolution is ex-
pressed by linear formulae [4]. In the present study, we
have investigated the precise nucleotide relationships
between the coding or non-coding regions and the com-
plete single DNA that forms the double-stranded DNA.
These analyses included not only homonucleotides, but
also heteronucleotides, as Chargaff’s second parity rule
is linked to the double-stranded DNA structure [2,8]. In
fact, it would be interesting to determine whether Char-
gaff’s second parity rule is preserved, not only in the
complete genome, but also in the separated coding and
non-coding regions, to understand biological evolution.
2. MATERIALS AND METHODS
Genome data were obtained from the National Center for
Biotechnology Information (NCBI; http:/ /www.ncbi.nlm.
nih.gov/sites), and the list of organelles examined has
been described in our previous paper [13]. The same
species which were examined in our previous study were
used to compare the present result with the previous data
[13]. To evaluate the biological evolution of whole or-
ganelles, the coding region in the reverse strand was
incorporated into the coding region in the forward strand
as the complement [2]. Calculations were performed
using Microsoft Excel (version 2003).
3. RESULTS
3.1. Codon Evolution in Chloroplasts
The coding and non-coding regions were separated be-
cause their nucleotide alternations differ [4]. In the pre-
sent study, however, the coding region in the reverse
strand was incorporated into the forward strand as the
complement, and the nucleotide content in the coding
region was plotted against the complete single DNA
strand to understand whole genome evolution [2]. Ac-
cording to this process, each of the four nucleotide
components are expressed by four equations, and the
homonucleotide content is expressed by a regression line
whose regression coefficient is close to 1.0 in normal-
ized values. Similarly, when the nucleotide content of
the coding region were plotted against the total G con-
tent in the complete single DNA strand, the lines for
both G and C completely overlapped in chloroplasts.
Similarly, the lines for T and A also overlapped (Figure
1, upper panel). This suggests that G C and T A in
the coding region. Similar results were obtained for the
non-coding region (Figure 1, lower panel).
Figure 1. Nucleotide relationships in normalized chloroplast
values. Upper panel, coding region; lower panel, non-coding
region. Red squares, G; green triangles, C; blue diamonds, A;
and shallow blue crosses, T. The composition of each nucleo-
tide in the coding or non-coding region was plotted against the
G content in the complete single DNA strand. The vertical axis
represents the composition of the four nucleotides; the hori-
zontal axis represents the G content in the complete single
DNA strand.
K. Sorimachi / Natural Science 2 (2010) 846-854
Copyright © 2010 SciRes. OPEN ACCESS
848
Each line was computationally characterized and the
results are shown in Table 1. Using normalized values in
the four equations, as the summation of the four nucleo
tides is 1, the summation of the four equation slopes is 0
and that of the constant values at the vertical intercept is
1.0 in all cases [4]. This fact is based on mathematical
rule using normalized values. As shown in Figure 1, the
absolute values of the slopes of the lines for G and C or
the lines for T and A were mathematically similar for
both coding and non-coding regions, while the former
two slopes were positive but the latter two were negative.
That is, the G and C lines are symmetrical to the A and T
lines in both the coding and non-coding regions. In addi-
tion, the slopes differed between the coding and non-
coding regions, where the absolute values of the slopes
were 0.760 0.049 and 1.192 0.078 in the coding and
non-coding regions, respectively. Thus, the compositions
of the four nucleotides correlated well with the nucleo-
tide compositions in the complete single DNA strand.
Regression coefficients were more than 0.9 or close to
0.9, except those for the A and T contents against the
total T and A contents, which were 0.79 and 0.77, re-
spectively, in the coding region.
Based on Figure 1, the overlapped lines for G and C
clearly intersected with the overlapped lines for T and A.
The points of intersection for the overlapped lines of
regression were calculated based on the regression line
equations presented in Table 1. The combinations of the
two lines for calculations were either lines for G and A
(purines) or lines for C and T (pyrimidines). All combi-
nations were approximately 0.25 at the point of intersec-
tion for both the coding and non-coding regions in chlo-
roplasts (Table 2).
3.2. Codon Evolution in Plant Mitochondria
The nucleotide contents in the coding and non-coding
regions were plotted against those in the complete single
DNA strand for DNA obtained from plant mitochondria
(Figure 2). The G line overlapped with the C line, whe-
reas the T line slightly diverged from the A line in the
coding region compared (Figure 2, upper panel). Scat-
tering of the sample points was observed for each of the
four nucleotides, particularly in the high G content re-
gion of the complete single DNA strand. In the non-
coding region, the G line differed significantly from the
C line (Figure 2).
Furthermore, the C line was parallel to the G line.
Scattering of sample points was observed in the com-
plete genome, and was likely due to the small genome
sizes [12]. Both the G and C lines were almost symmet-
rical with to both the A and T lines, respectively, for both
the coding and non-coding regions.
Each line was computationally characterized and the
results are shown in Table 3. The absolute values of the
Table 1. Regression lines representing nucleotide contents in
the coding and non-coding regions against the nucleotide con-
tents in the complete single strand DNA based on 97 chloro-
plasts.
Coding R Non-coding R
Gc = 0.781 G + 0.045 0.93Gn = 1.247 G – 0.050 0.97
Cc = 0.792 G + 0.042 0.91Cn = 1.221 G – 0.039 0.94
Tc = –0.795 G + 0.4610.90Tn = –1.304 G + 0.556 0.95
Ac = –0.778 G + 0.4530.86An = –1.164 G + 0.533 0.95
Gc = 0.720 C + 0.054 0.88Gn = 1.156 C – 0.037 0.93
Cc = 0.809 C + 0.037 0.96Cn = 1.236 C – 0.046 0.97
Tc = –0.735 C + 0.4520.85Tn = –1.101 C + 0.525 0.92
Ac= –0.795 C + 0.4580.90A n= –1.291 C + 0.558 0.97
Gc = –0.742 T + 0.4230.88Gn = –1.220 T + 0.565 0.95
Cc = –0.786 T + 0.4360.90Cn = –1.206 T + 0.567 0.92
Tc = 0.831 T + 0.051 0.93Tn = 1.181 T – 0.054 0.96
Ac = 0.697 T + 0.090 0.77An = 1.246 T – 0.077 0.90
Gc = –0.700 A + 0.4070.90Gn = –1.093 A + 0.520 0.92
Cc = –0.753 A + 0.4230.93Cn = –1.156 A + 0.547 0.95
Tc = 0.650 A + 0.112 0.79Tn = 1.005 A + 0.006 0.88
Ac = 0.804 A + 0.058 0.96An = 1.244 A – 0.073 0.97
Xc and Xn mean the nucleotide content in the coding and non-coding
regions, respectively.
Table 2. Crossing points obtained from two regression lines
based on 97 chloroplasts.
Vs. Lines Coding Non-coding
G-A 0.262 0.242
G C-T 0.264 0.236
G-A 0.267 0.243
C C-T 0.269 0.244
G-A 0.231 0.260
T C-T 0.238 0.260
G-A 0.232 0.254
A C-T 0.222 0.250
G-A 0.248 0.019 0.250 0.009
Av. C-T 0.248 0.022 0.248 0.010
slopes were 0.857 0.168 and 0.840 0.131 in the cod-
ing and non-coding regions, respectively, and the values
similar between the both regions. The summation of the
four equation slopes is 0, and that of the constant values
at the vertical axis is 1 in all cases, as explained in Fig-
ure 1. The regression coefficients were around 0.9, ex-
cept for low regression coefficients of 0.57 and 0.45
from the T and A contents in the coding region.
The point of intersection of the two regression lines
was calculated based on the regression line equations
K. Sorimachi / Natural Science 2 (2010) 846-854
Copyright © 2010 SciRes. OPEN ACCESS
849
Figure 2. Nucleotide relationships in normalized plant mito-
chondrial values. Upper, coding region; lower, non-coding
region. Red squares, G; green triangles, C; blue diamonds, A;
and shallow blue crosses, T. The composition of each nucleo-
tide in the coding or non-coding region was plotted against the
G content in the complete single DNA strand. The vertical axis
represents the composition of the four nucleotides; the hori-
zontal axis represents the G content in the complete single
DNA strand.
presented in Table 3. All combinations due to G and A
lines or C and T lines were approximately 0.24 in both the
coding and non-coding regions for DNA obtained from
plant mitochondria (Table 4).
3.3. Codon Evolution in Vertebrate
Mitochondria
Nucleotide contents of the coding and non-coding re-
gions were plotted against nucleotide contents in the
complete single DNA strand (Figure 3). When the four
nucleotide compositions in the coding region we plotted
against the G content in the complete single DNA strand,
the G content in the coding region was expressed by a
linear regression line with a high regression coefficient
(Figure 3, upper panel). The nucleotide A content could
also be expressed by a linear regression line with a rela-
tively high regression coefficient (0.82) (Table 5). On
the other hand, C and T compositions were not corre-
lated with G content in the complete single DNA strand
(R-values of 0.24 and 0.01). Similar results were ob-
tained in the non-coding region (Figure 3, lower panel
and Table 5).
When nucleotide contents in the coding region or
non-coding region were plotted against nucleotide con-
tents in the complete single DNA strand, homonucleo-
tides and their analogs (purines or pyrimidines) showed
good correlations. However, heteronucleotides and their
Table 3. Regression lines representing nucleotide contents in
the coding and non-coding regions against the nucleotide con-
tents in the complete single strand DNA based on 47 plant
mitochondria.
Coding R Non-coding R
Gc = 0.993 G – 0.005 0.97Gn = 0.839 G + 0.040 0.90
Cc = 0.904 G – 0.002 0.86Cn = 0.981 G – 0.003 0.92
Tc = –0.770 G + 0.4800.69Tn = –0.803 G + 0.457 0.91
Ac = –1.127 G + 0.5270.87An= –1.018 G + 0.506 0.96
Gc = 0.808 C + 0.039 0.85Gn = 0.663 C + 0.081 0.77
Cc = 0.955 C + 0.002 0.98Cn = 0.956 C + 0.014 0.97
Tc = –0.797 C + 0.4740.77Tn = –0.749 C + 0.437 0.92
Ac = –0.966 C + 0.4840.81An = –0.870 C + 0.467 0.88
Gc = –0.793 T + 0.4340.82Gn = –0.560 T + 0.375 0.64
Cc = –0.890 T + 0.4540.90Cn = –0.916 T + 0.474 0.91
Tc = 0.984 T + 0.018 0.93Tn = 0.685 T + 0.088 0.83
Ac = 0.699 T + 0.094 0.57An = 0.790 T + 0.063 0.79
Gc = –0.767 A + 0.4230.87Gn = –0.722 A + 0.426 0.91
Cc = –0.746 A + 0.4040.83Cn = –0.784 A + 0.428 0.86
Tc = 0.435 A + 0.200 0.45Tn = 0.666 A + 0.096 0.88
Ac = 1.078 A– 0.027 0.98An = 0.840 A + 0.049 0.92
Xc and Xn mean the nucleotide content in the coding and non-coding
regions, respectively.
Table 4. Crossing points obtained from two regression lines
based on 47 plant mitochlondria.
Vs. Lines Coding Non-coding
G-A 0.251 0.251
G C-T 0.288 0.258
G-A 0.251 0.252
C C-T 0.269 0.248
G-A 0.228 0.231
T C-T 0.233 0.241
G-A 0.244 0.241
A C-T 0.173 0.229
G-A 0.244 0.011 0.244 0.009
Av. C-T 0.241 0.051 0.244 0.012
K. Sorimachi / Natural Science 2 (2010) 846-854
Copyright © 2010 SciRes. OPEN ACCESS
850
Figure 3. Nucleotide relationships in normalized vertebrate
mitochondrial values. Upper, coding region; lower, non-coding
region. Red squares, G; green triangles, C; blue diamonds, A;
and shallow blue crosses, T. The composition of each nucleo-
tide in the coding or non-coding region was plotted against the
G content in the complete single DNA strand. The vertical axis
represents the composition of the four nucleotides; the hori-
zontal axis represents the G content in the complete single
DNA strand.
analog relationships (i.e., G vs. C or T and A vs. C or T)
showed no correlation for vertebrate mitochondria (Ta-
ble 5). This rule was observed in all cases in vertebrate
mitochondria.
The calculated points of intersection of two regression
line equations are presented in Table 6. The G and A
(purines) lines intersected at 0.219 and 0.227 in the cod-
ing region and non-coding region, respectively, against
the G (purine) content in the complete single DNA
strand; while the C and T (pyrimidines) lines intersected
at 0.106 and 0.160 in the coding and non-coding regions,
respectively, against the G (purine) content (Table 6).
The former values were close to 0.250, whereas the lat-
ter were relatively far from this value. On the other hand,
the G and A (purines) lines intersected at 0.565 and
0.506 in the coding and non-coding regions, respectively,
against the C (pyrimidine) content in the complete single
Table 5. Regression lines representing nucleotide contents in
the coding and non-coding regions against the nucleotide con-
tents in the complete single strand DNA based on 45 vertebrate
mitochondria.
Coding R Non-coding R
Gc = 0.948 G – 0.004 0.96 Gn = 1.133 G + 0.007 0.87
Cc = 0.386 G + 0.233 0.24 Cn = 0.322 G + 0.192 0.30
Tc = 0.019 G + 0.272 0.01 Tn = –0.542 G + 0.330 0.50
Ac = –1.353 G + 0.5000.82An = –0.913 G + 0.471 0.73
Gc = 0.148 C + 0.093 0.21 Gn = 0.295 C + 0.091 0.31
Cc = 1.165 C – 0.029 0.99 Cn = 0.681 C + 0.053 0.87
Tc = –0.882 C + 0.5160.76 Tn = –0.562 C + 0.405 0.71
Ac = –0.431 C + 0.4200.36An = –0.414 C + 0.452 0.45
Gc = –0.068 T + 0.1520.26 Gn = –0.120 T + 0.203 0.12
Cc = –0.960 T + 0.5460.80 Cn = –0.533 T + 0.381 0.66
Tc = 1.167 T – 0.037 0.98 Tn = 0.647 T + 0.078 0.80
Ac = –0.139 T + 0.3400.11An = 0.006 T + 0.337 0.07
Gc = –0.505 A + 0.2920.75 Gn = –0.674 A + 0.383 0.76
Cc = –0.388 A + 0.4110.36 Cn = –0.295 A + 0.332 0.40
Tc = –0.212 A + 0.3420.20 T = 0.198 A + 0.189 0.27
Ac = 1.106 A – 0.045 0.99An = 0.771 A + 0.096 0.90
Xc and Xn mean the nucleotide content in the coding and non-coding
regions, respectively.
Table 6. Crossing points obtained from two regression lines
based on 45 vertebrates.
Vs. Lines Coding Non-coding
G-A 0.219 0.227
G C-T 0.106 0.160
G-A 0.565 0.509
C C-T 0.266 0.283
G-A 2.648 1.063
T C-T 0.274 0.257
G-A 0.209 0.199
A C-T 0.115 0.290
DNA strand. The C and T (pyrimidines) lines crossed at
0.266 and 0.283 in the coding and non-coding regions,
respectively, against the C (pyrimidine) content in the
complete single DNA strand (Table 6). The former two
values were significantly different from 0.250, whereas
the latter two values were close to 0.250.
When the A (purine) and T (pyrimidine) contents in
the complete single DNA strand were used instead of the
G (purine) and C (pyrimidine) contents, consistently
similar results were obtained (Table 6). Combinations of
regression line equations (G and A or C and T) against
heteronucleotide content in the complete single DNA
strand rarely attained 0.250 as a point of intersection.
K. Sorimachi / Natural Science 2 (2010) 846-854
Copyright © 2010 SciRes. OPEN ACCESS
851
3.4. Codon Evolution in Invertebrate
Mitochondria
As determined in a previous study [12], although nu-
cleotide content relationships in the complete inverte-
brate mitochondrial genome were heteroskedastic, they
were classified into two groups, I and II, based on their
distributions on the graph. Plotting the C content of the
coding region against the G content in the complete sin-
gle DNA strand in invertebrate mitochondria, it showed
that mitochondria could be clearly classified into two
groups (denoted by a dotted line on Figure 4). This is
consistent with the result obtained from the complete
genome [12].
Nucleotide content relationships were also investi-
gated in the classified invertebrate I mitochondria. Plot-
ting the four nucleotide compositions in the coding re-
gion against the G content in the complete single DNA
strand produced four lines of regression (Figure 5, upper
panel); however, all four lines differed from each other.
Similar results were obtained for the non-coding region
(Figure 5, lower panel). The values of their regression
coefficients, the slope, and constants for each equation
are shown in Table 7. Relationships between the coding
or non-coding region, the complete single DNA strand,
and the homonucleotides and their analogs contents,
correlated well for invertebrate I mitochondria (Table 7).
As shown in Figure 5, the lines for C and T against
the G content in the complete single DNA strand inter-
sected at around 0.250 for both the coding and
non-coding regions. The points of intersection of two
lines of regression equations are presented in Table 7
and were calculated and tabulated in Table 8. The points
Figure 4. Nucleotide relationships in invertebrate mitochon-
dria. Nucleotide contents were normalized, and the C content
in the coding region was plotted against the G content in the
complete single DNA strand. The vertical axis represents the G
and C compositions and the horizontal axis represents the G
content in the complete single DNA strand. The dotted line
represents the G content in the coding region against the G
content in the complete single DNA strand.
Figure 5. Nucleotide relationships in normalized invertebrate I
mitochondrial values. Upper, coding region; lower, non-coding
region. Red squares, G; green triangles, C; blue diamonds, A;
and shallow blue crosses, T. The composition of each nucleo-
tide in the coding or non-coding region was plotted against the
G content in the complete single DNA strand. The vertical axis
represents the composition of each of the four nucleotides, the
horizontal axis represents the G content in the complete single
DNA strand.
of intersection from the two lines of regression equations
(G and A or C and T) against homonucleotides or their
analog contents in the complete single DNA strand were
close to 0.250, while those against heteronucleotides or
their analogs contents were rarely 0.250 for invertebrate
I mitochondria (Table 8).
Additionally, the nucleotide composition relationships
observed between the coding or non-coding region and
the complete single DNA strand were also examined for
invertebrate II mitochondria. The characteristics of the
lines of regression are shown in Table 9. The points of
intersection for two lines of regression equations are
shown in Table 10. The results obtained from inverte-
brate II mitochondria were similar to those of inverte-
brate I mitochondria.
K. Sorimachi / Natural Science 2 (2010) 846-854
Copyright © 2010 SciRes. OPEN ACCESS
852
Table 7. Regression lines representing nucleotide contents in
the coding and non-coding regions against the nucleotide con-
tents in the complete single strand DNA based on 31 inverte-
brate I mitochondria.
Coding R Non-coding R
Gc = 0.781 G + 0.030 0.94 Gn = 1.364 G – 0.050 0.96
Cc = 1.496 G + 0.027 0.68 Cn = 1.645 G – 0.024 0.79
Tc = –1.014 G + 0.437 0.51 Tn = –1.628 G + 0.531 0.77
Ac = –1.263 G + 0.506 0.76 An = –1.380 G + 0.543 0.77
Gc = 0.229 C + 0.078 0.59 Gn = 0.513 C + 0.011 0.78
Cc = 1.006 C + 0.009 0.99 Cn = 0.916 C – 0.008 0.95
Tc = –0.740 C + 0.461 0.80 Tn = –0.866 C + 0.507 0.88
Ac = –0.495 C + 0.453 0.64 An = –0.562 C + 0.489 0.67
Gc = –0.224 T + 0.194 0.53 Gn = –0.459 T + 0.259 0.64
Cc = –0.961 T + 0.515 0.87 Gn = –0.825 T + 0.437 0.79
Tc = 0.984 T – 0.002 0.98 Tn = 1.016 T + 0.010 0.94
Ac = 0.201 T + 0.292 0.24 An = 0.268 T + 0.294 0.29
Gc = –0.327 A + 0.241 0.67 Gn = –0.659 A + 0.351 0.80
Cc = –0.809 A + 0.498 0.63 Cn = –0.899 A + 0.497 0.75
Tc = 0.197 A + 0.247 0.17 Tn = 0.563 A + 0.135 0.45
Ac = 0.939 A + 0.015 0.97 An = 0.995 A + 0.018 0.95
Xc and Xn mean the nucleotide content in the coding and non-coding
regions, respectively.
Table 8. Crossing points obtained from two regression lines
based on 31 invertebrate mitochondria.
Vs. Lines Coding Non-coding
G-A 0.233 0.216
G C-T 0.163 0.170
G-A 0.518 0.445
C C-T 0.259 0.289
G-A 0.231 0.048
T C-T 0.266 0.232
G-A 0.157 0.201
A C-T 0.250 0.248
4. DISCUSSION
The slopes for the lines of regression representing nu-
cleotide contents differ between the coding and non-
coding regions in nuclear DNA [4]. Comparing chloro-
plasts DNA with mitochondrial DNA, the slopes of the
regression lines were the same in the coding region, al-
though those values differed in the non-coding region
(Tables 1 and 3). Thus, the evolutionary differences ob-
served between chloroplasts and mitochondria are con-
trolled in the non-coding region. In fact, mitochondria
and chloroplasts have been proposed to be derived from
Table 9. Regression lines representing nucleotide contents in
the coding and non-coding regions against the nucleotide con-
tents in the complete single strand DNA based on 28 inverte-
brate II mitochondria.
Coding R Non-coding R
Gc = 1.004 G – 0.002 0.96 Gn = 0.904 G + 0.018 0.89
Cc = 0.306 G + 0.066 0.54 Cn = 0.190 G + 0.096 0.26
Tc = –0.041 G + 0.3960.05 Tn = –0.355 G + 0.413 0.35
Ac = –1.269 G + 0.5390.85An = –0.740 G + 0.472 0.77
Gc = 0.485 C + 0.126 0.30 Gn = 0.839 C + 0.083 0.53
Cc = 0.835 C + 0.017 0.94 Cn = 1.087 C – 0.006 0.93
Tc = –0.763 C + 0.4860.57 Tn = –1.169 C + 0.495 0.74
Ac = –0.558 C + 0.3710.24An = –0.757 C + 0.429 0.50
Gc = –0.055 T + 0.2090.05 Gn = –0.400 T + 0.339 0.35
Cc = –0.401 T + 0.2740.63 Cn = –0.640 T + 0.372 0.76
Tc = 0.913 T + 0.047 0.94 Tn = 1.033 T – 0.041 0.91
Ac = –0.457 T + 0.4700.27An = 0.007 T + 0.330 0.02
Gc = –0.727 A + 0.4130.88 Gn = –0.585 A + 0.370 0.73
Cc = –0.208 A + 0.1880.46 Cn = –0.081 A + 0.157 0.14
Tc = –0.230 A + 0.4600.34 Tn = 0.011 A + 0.343 0.88
Ac = 1.165 A – 0.061 0.98An = 0.654 A + 0.130 0.86
Xc and Xn mean the nucleotide content in the coding and non-coding
regions, respectively.
Table 10. Crossing points obtained from two regression lines
based on 28 invertebrate II mitochondria.
Vs. Lines Coding Non-coding
G-A 0.238 0.276
G C-T 0.951 0.934
G-A 0.235 0.217
C C-T 0.293 0.222
G-A 0.510 0.022
T C-T 0.173 0.247
G-A 0.251 0.194
A C-T 0.621 –2.022
proteobacteria [9,10] and cyanobacteria [11]. A compari-
son of the human genome [14,15] with the sea urchin
genome [16] has revealed that the number of protein
coding genes is similar between the two species, while
the non-coding region of the former is much larger than
that of the latter. This fact also suggests that the non-
coding region plays an important role in developmental
biology. In chloroplasts and plant mitochondria, the rule
that G C, T A and [(G + A) (C + T)] is not only
observed in the complete genome, but also in the coding
or non-coding region in plant organelles, based on nu-
cleotide content relationships between the coding or
non-coding region and the complete single DNA strand.
K. Sorimachi / Natural Science 2 (2010) 846-854
Copyright © 2010 SciRes. OPEN ACCESS
853
On the other hand, the nucleotide content relationships
for either the coding or non-coding regions did not obey
Chargaff’s second parity rule in nuclear genomes [4],
instead, (G + A) > (C + T) in the coding region [17]. In
addition, animal mitochondrial evolution seems to differ,
not only from nuclear, but also from plant organelles.
Plasmids, which are not compartmentalized from the
nucleus, showed codon frequencies that resemble those
of the host [18]. Thus, the compartmentalization of cel-
lular organelles is likely to strongly influence organelle
evolution.
To understand the establishment of Chargaff’s second
parity rule, the existence of both forward and reverse
strands is necessary [2,8]. Namely, it is clear that the
second parity rule is based on the double helical struc-
ture of DNA [19], where the complementary relationship
between the two strands plays a role. Primitive genomes
might be constructed by double-stranded DNA and mu-
tations that occur synchronously over the genome [20]
are governed by linear formulae [4]. In addition, Char-
gaff’s parity rules are alternated to four linear formulae
based on single nucleotide content, as shown above.
Thus, biological evolution is likely to be based on the
nucleotide contents expressed by linear formulae.
Chargaff’s first parity rule [5], G = C, A = T, and [(G
+ A) = (C + T)], is well known and uses the four nucleo-
tide contents that are normalized as follows: G + C + A +
T = 1. Therefore, 2G + 2T = 1 or 2G + 2A = 1. Finally, T
= 0.5 – G or A = 0.5 – G. Eventually, four nucleotide
contents are expressed by just G content: G = G, C = G,
T = 0.5 – G, and A = 0.5 – G. Namely, each of the four
nucleotide contents are expressed by linear formulae
based on just one nucleotide content (G). Thus lines for
G and C or for lines T and A overlap. In addition, the G
line intersects the A line at 0.250 and the C line crosses
the T line at 0.250. Thus, the four regression lines ob-
tained from the sample that obeys Chargaff’s first parity
rule cross exactly at 0.250. In addition, the four regres-
sion lines based on a sample that obeys Chargaff’s sec-
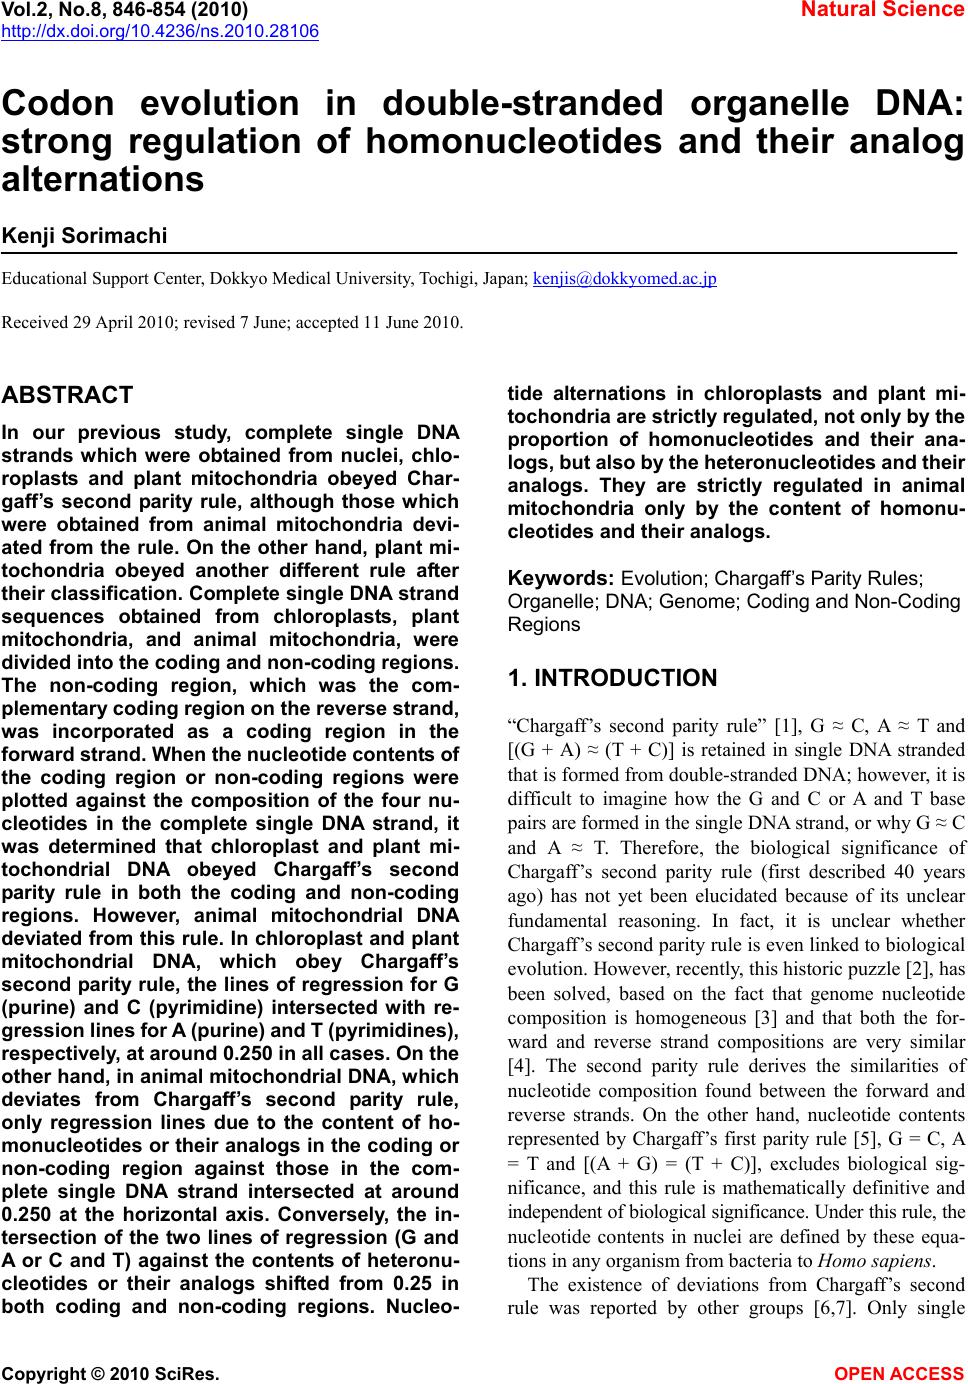
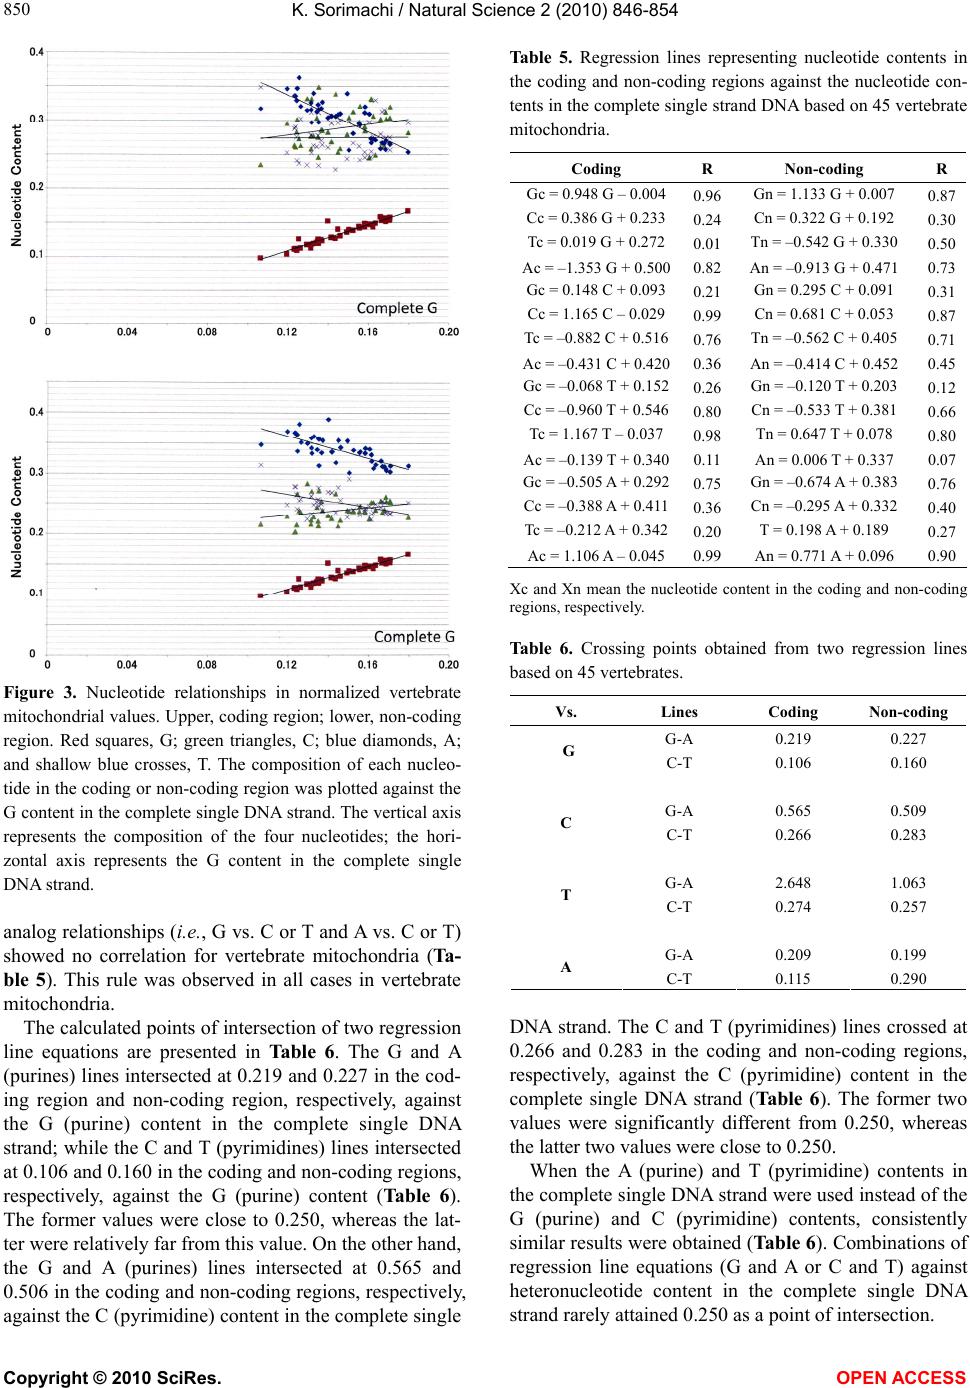
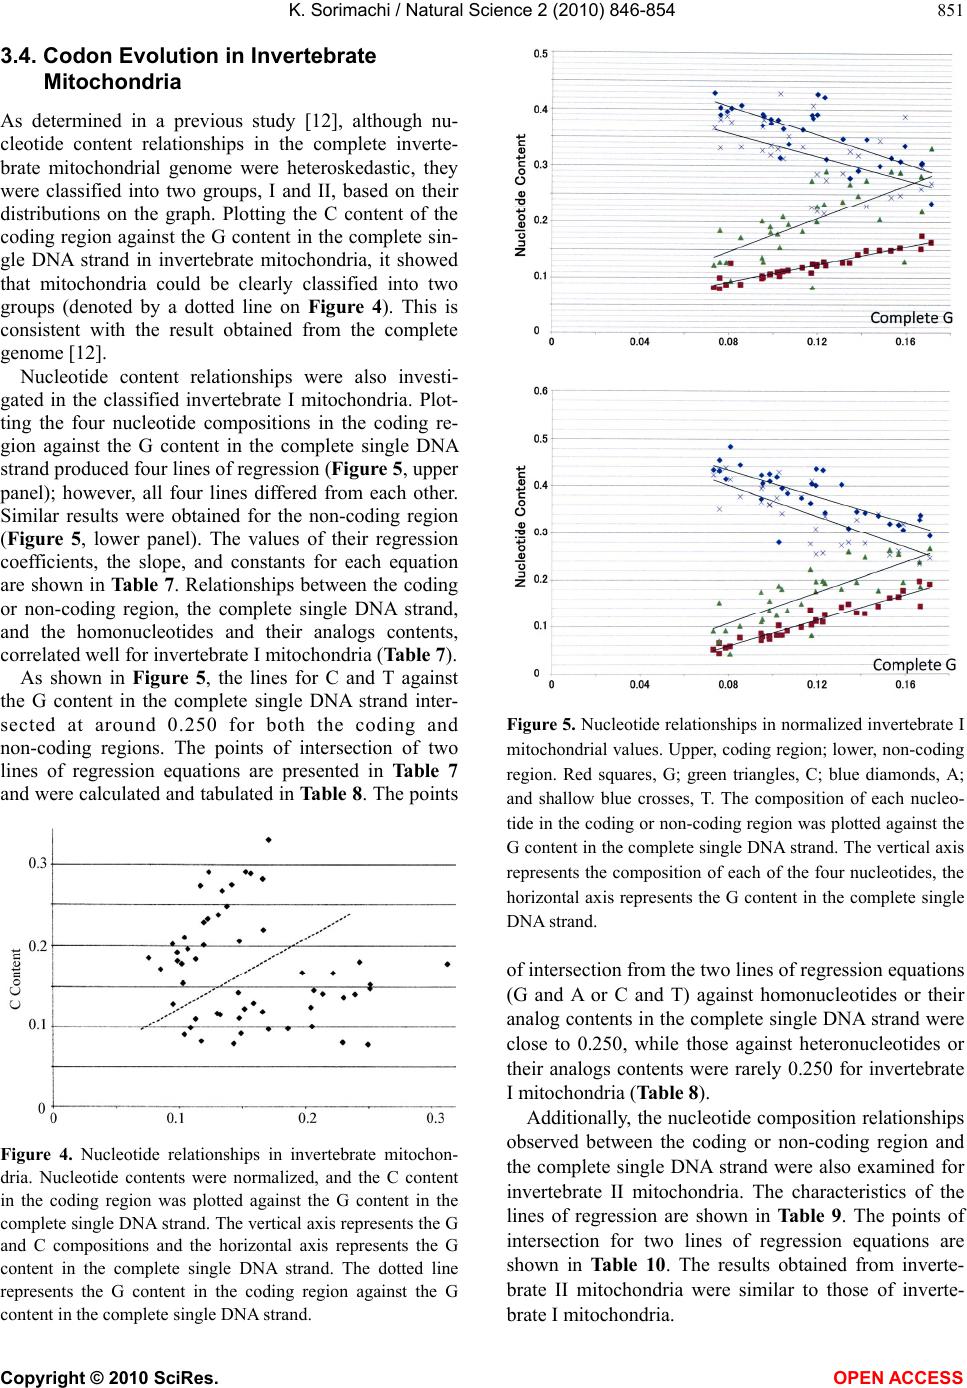
ond parity rule will intersect at around 0.250. In the pre-
sent study, four regression lines based on chloroplasts
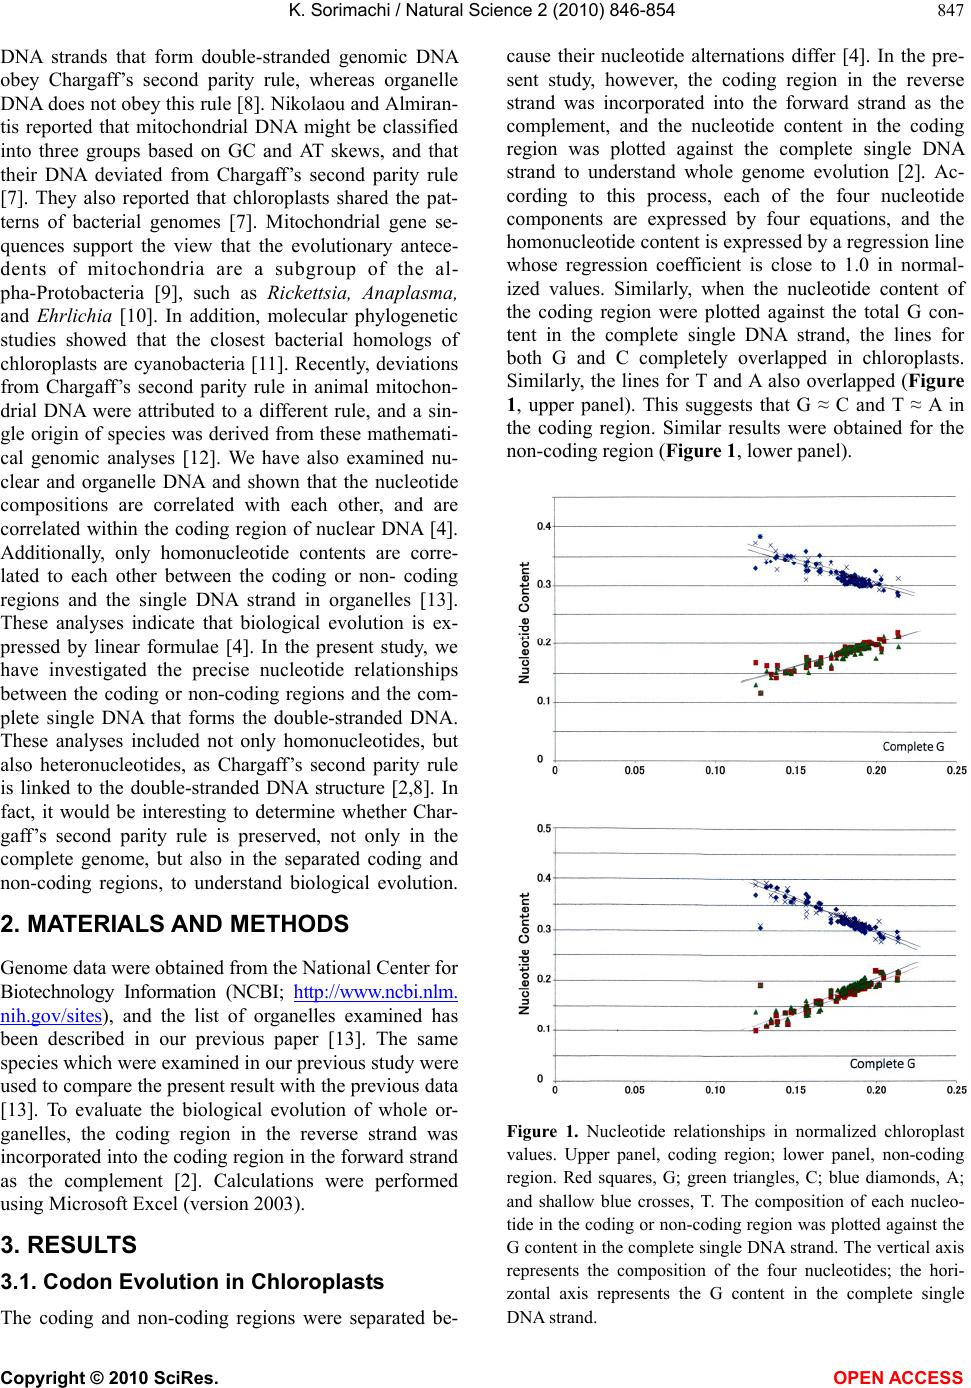
(Figure 1 and Table 1) and plant mitochondria (Figure
2 and Table 3), which both obey Chargaff’s second par-
ity rule, intersect at around 0.250 (Tables 2 and 4). On
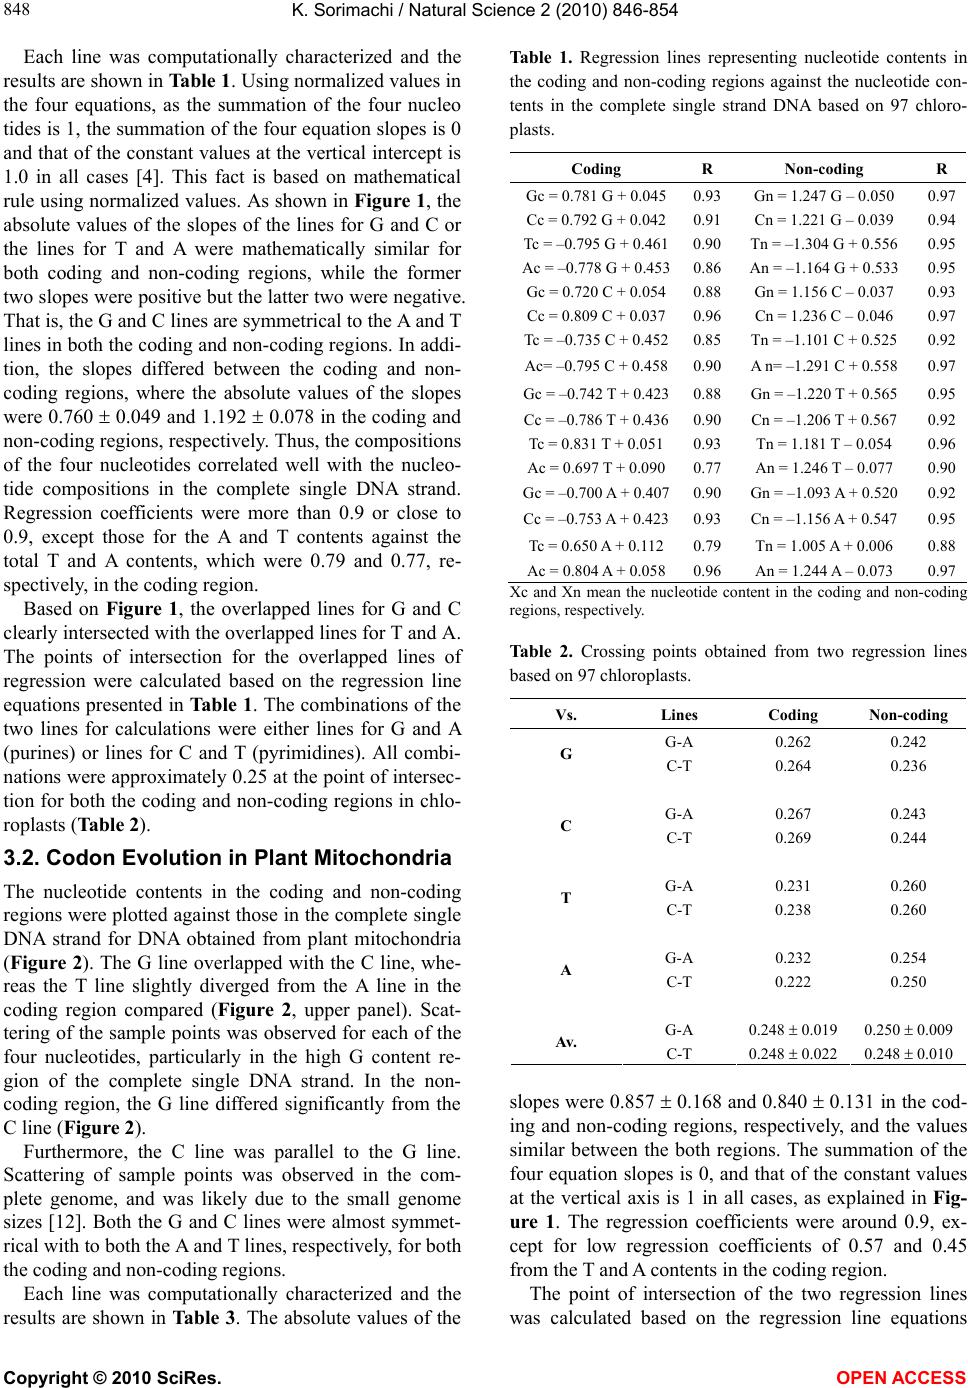
the other hand, for animal mitochondria, only two re-
gression lines due to homonucleotides or their analogs in
the complete single DNA strand intersect around 0.250,
while the other two regression lines due to heteronucleo-
tides or their analogs in the complete single DNA strand
rarely intersect at 0.250. Thus, nucleotide alternations,
not only in homonucleotides and their analogs but also
in heteronucleotides and their analogs, are strictly regu-
lated against the complete single DNA strand in samples
that obey Chargaff’s second parity rule; namely, chloro-
plasts and plant mitochondria. However, only alterna-
tions of homonucleotides and their analogs are strictly
regulated in both coding and non-coding regions against
the complete single DNA strand in animal mitochondria.
These results indicate that the evolutionary process of
animal mitochondria differs from that of chloroplasts
and plant mitochondria, possibly due to deviations from
Chargaff’s second parity rule. This is consistent with the
previous conclusion that provided evidence for a single
origin of life [12].
REFERENCES
[1] Rudner, R., Karkas, J.D. and Chargaff, E. (1968) Separa-
tion of B. subtilis DNA into complementary strands. 3.
Direct analysis. Proceedings of the National Academy
Sciences, 60(3), 921-922.
[2] Sorimachi, K. (2009) A proposed solution to the historic
puzzle of Chargaff’s second parity rule. The Open Ge-
nomics Journal, 2(3), 12-14.
[3] Sorimachi, K. and Okayasu, T. (2004) An evaluation of
evolutionary theories based on genomic structures in
Saccharomyces cerevisiae and Encephalitozoon cuniculi.
Mycoscience, 45(5), 345-350.
[4] Sorimachi, K. and Okayasu, T. (2008) Codon evolution is
governed by linear formulas. Amino Acids, 34(4), 661-
668.
[5] Chargaff, E. (1950) Chemical specificity of nucleic acids
and mechanism of their enzymatic degradation. Experi-
mentia, 6(6), 201-209.
[6] Bell, S.J. and Forsdyke, D.R. (1999) Deviations from
Chargaff’s second parity rule with direction of transcrip-
tion. The Journal of Theoretical Biology, 197(1), 63-76.
[7] Nikolaou, C. and Almirantis, Y. (2006) Deviations from
Chargaff’s second parity rule in organelle DNA insights
into the evolution of organelle genomes. Gene, 381,
34-41.
[8] Mitchell, D. and Bridge, R. (2006) A test of Chargaff’s
second rule. Biochemical and Biophysical Research
Communications, 340(1), 90-94.
[9] Yang, D., Oyaizu, Y., Oyaizu, H., Olsen, G.J. and Woese,
C.R. (1985) Mitochondrial origins. Proceedings of Na-
tional Academy Sciences, 82(13), 4443-4447.
[10] Lang, B.F., Burger, G., O’Kelly, C.J., Cedergren, R.,
Golding, B., Lemieux, C., et al. (1997) An ancestral mi-
tochondrial DNA resembling a eubacterial genome in
miniature. Nature, 387(6632), 493-497.
[11] Raven, J.A. and Douglas, A.E. (2003) Genomes at the
interface between bacteria and organelles. Philosophical
Transactions of Royal Society London. Series B, Bio-
logical Science, 358(1429), 5-18.
[12] Sorimachi, K. (2010) Genomic data provides simple
evidence for a single origin of life. Natural Science, 2(5),
521-527.
[13] Sorimachi, K. and Okayasu, T. (2008) Universal rules
governing genome evolution expressed by linear formu-
las. The Open Genomics Journal, 1(11), 33-43.
[14] Lander, E.S., Linton, L.M., Birren, B., Nusbaum, C.,
Zody, M.C., Baldwin, J., Devon, K., et al. (2001) Initial
K. Sorimachi / Natural Science 2 (2010) 846-854
Copyright © 2010 SciRes. OPEN ACCESS
854
sequencing and analysis of the human genome. Nature,
409(6822), 860-921.
[15] Venter, J.C., Adams, M.D., Myers, E.W., Li, P.W., Mural,
R.J., Sutton, G.G., et al. (2001) The sequence of the hu-
man genome. Science, 291(5507), 1304-1351.
[16] Sea urchin genome sequencing consortium. (2006) The
genome of the sea urchin strongylocentrotus purpuratus.
Science, 314(5801), 941-952.
[17] Szybalski, W., Kubinski, H. and Sheldrick, P. (1966)
Pyrimidine clusters on the transcribing strand of DNA
and their possible role in the initiation of RNA synthesis.
Cold Spring Harbor Symposia on Quantitative Biology,
31, 123-127.
[18] Sorimachi, K. and Okayasu, T. (2004) Classification of
eubacteria based on their complete genome: Where
does mycoplasmataceae belong? Proceedings of the
Royal Society of London. B (Supplement), 271(4),
S127-S130.
[19] Watson, J.D. and Crick, F.H.C. (1953) Genetical implica-
tions of the structure of deoxyribonucleic acid. Nature,
171(4361), 964-967.
[20] Sorimachi, K. and Okayasu, T. (2003) Gene assembly
consisting of small units with similar amino acid compo-
sition in the Saacharomyces cerevisiae genome. Myco-
science, 44(5), 415-417.