Paper Menu >>
Journal Menu >>
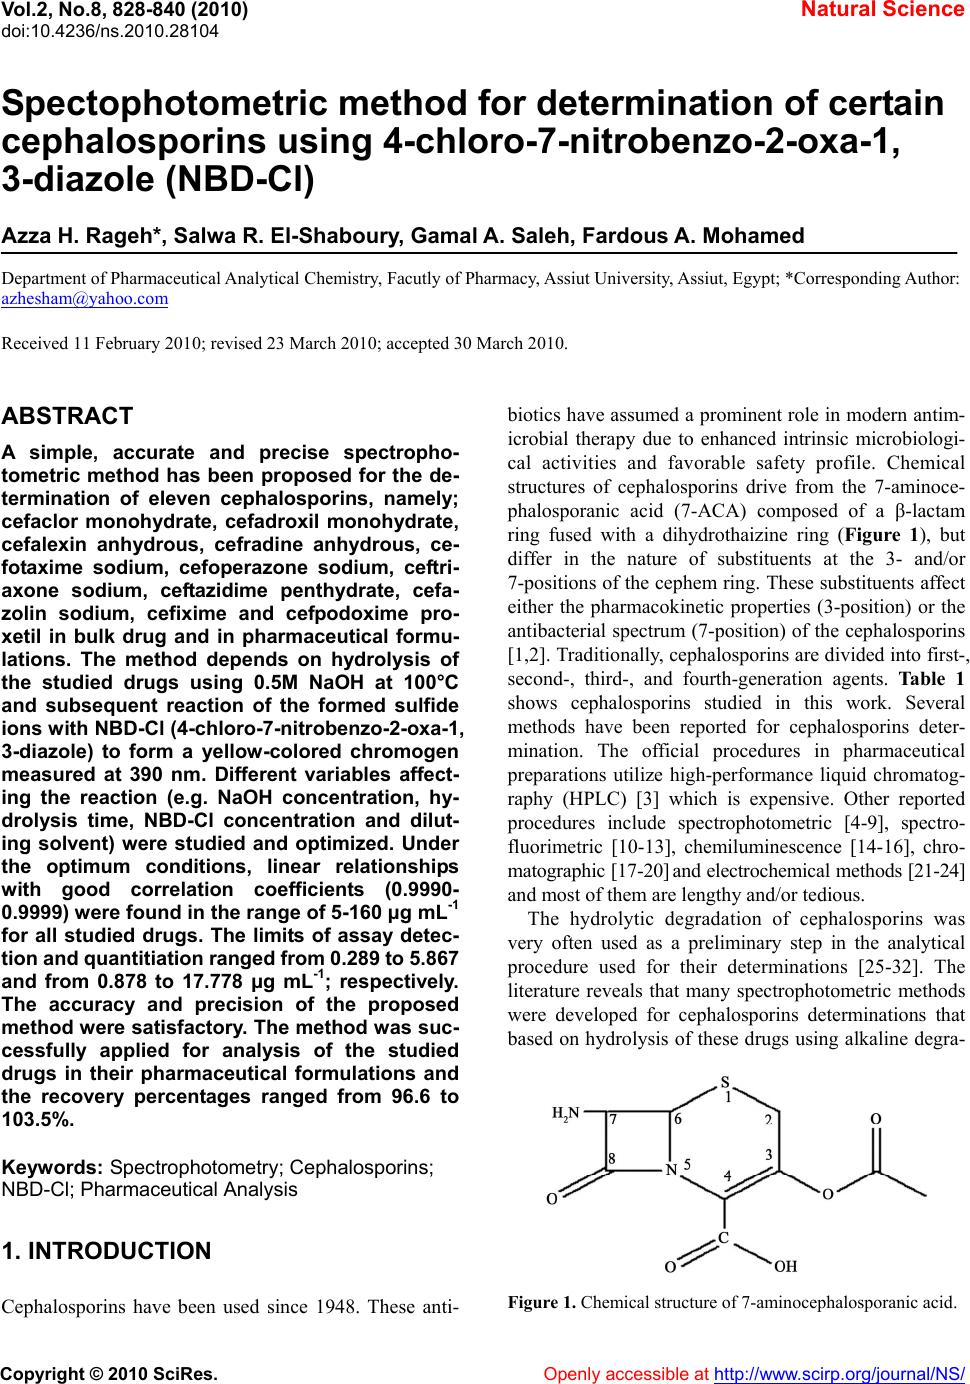 Vol.2, No.8, 828-840 (2010) Natural Science doi:10.4236/ns.2010.28104 Copyright © 2010 SciRes. Openly accessible at http://www.scirp.org/journal/NS/ Spectophotometric method for determination of certain cephalosporins using 4-chloro-7-nitrobenzo-2-oxa-1, 3-diazole (NBD-Cl) Azza H. Rageh*, Salwa R. El-Shaboury, Gamal A. Saleh, Fardous A. Mohamed Department of Pharmaceutical Analytical Chemistry, Facutly of Pharmacy, Assiut University, Assiut, Egypt; *Corresponding Author: azhesham@yahoo.com Received 11 February 2010; revised 23 March 2010; accepted 30 March 2010. ABSTRACT A simple, accurate and precise spectropho- tometric method has been proposed for the de- termination of eleven cephalosporins, namely; cefaclor monohydrate, cefadroxil monohydrate, cefalexin anhydrous, cefradine anhydrous, ce- fotaxime sodium, cefoperazone sodium, ceftri- axone sodium, ceftazidime penthydrate, cefa- zolin sodium, cefixime and cefpodoxime pro- xetil in bulk drug and in pharmaceutical formu- lations. The method depends on hydrolysis of the studied drugs using 0.5M NaOH at 100°C and subsequent reaction of the formed sulfide ions with NBD-Cl (4-chloro-7-nitrobenzo-2-oxa-1, 3-diazole) to form a yellow-colored chromogen measured at 390 nm. Different variables affect- ing the reaction (e.g. NaOH concentration, hy- drolysis time, NBD-Cl concentration and dilut- ing solvent) were studied and optimized. Under the optimum conditions, linear relationships with good correlation coefficients (0.9990- 0.9999) were found in the range of 5-160 μg mL-1 for all studied drugs. The limits of assay detec- tion and quantitiation ranged from 0.289 to 5.867 and from 0.878 to 17.778 μg mL-1; respectively. The accuracy and precision of the proposed method were satisfactory. The method was suc- cessfully applied for analysis of the studied drugs in their pharmaceutical formulations and the recovery percentages ranged from 96.6 to 103.5%. Keywords: Spectrophotometry; Cephalo spo rins; NBD-Cl; Pharmaceutical Analysis 1. INTRODUCTION Cephalosporins have been used since 1948. These anti- biotics have assumed a prominent role in modern antim- icrobial therapy due to enhanced intrinsic microbiologi- cal activities and favorable safety profile. Chemical structures of cephalosporins drive from the 7-aminoce- phalosporanic acid (7-ACA) composed of a β-lactam ring fused with a dihydrothaizine ring (Figure 1), but differ in the nature of substituents at the 3- and/or 7-positions of the cephem ring. These substituents affect either the pharmacokinetic properties (3-position) or the antibacterial spectrum (7-position) of the cephalosporins [1,2]. Traditionally, cephalosporins are divided into first-, second-, third-, and fourth-generation agents. Table 1 shows cephalosporins studied in this work. Several methods have been reported for cephalosporins deter- mination. The official procedures in pharmaceutical preparations utilize high-performance liquid chromatog- raphy (HPLC) [3] which is expensive. Other reported procedures include spectrophotometric [4-9], spectro- fluorimetric [10-13], chemiluminescence [14-16], chro- matographic [17-20] and electrochemical methods [21-24] and most of them are lengthy and/or tedious. The hydrolytic degradation of cephalosporins was very often used as a preliminary step in the analytical procedure used for their determinations [25-32]. The literature reveals that many spectrophotometric methods were developed for cephalosporins determinations that based on hydrolysis of these drugs using alkaline degra- Figure 1. Chemical structure of 7-aminocephalosporanic acid.  A. H. Rageh et al. / Natural Science 2 (2010) 828-840 Copyright © 2010 SciRes. Openly accessible at http://www.scirp.org/journal/NS/ 829 Table 1. Chemical structures of the investigated cephalosporin antibiotics. S NR2 C OOR 3 O NC O R1 H No. Name R1 R 2 R 3 Generation 1. Cefalexin anhydrous H C NH2 -CH3 -H First 2. Cefradine anhydrous H C NH2 -CH3 -H First 3. Cefadroxil monohy- drate H C NH2 HO -CH3 -H First 4. Cefazolin sodium NN NNCH 2 NN SCH3 SC H2 -Na First 5. Cefaclor monohy- drate H C NH2 -Cl -H Second 6. Cefpodoxime proxetil S N H2N NOCH3 C CH2OCH3 CHOCOCH(CH 3)2 CH3 O Third 7. Cefixime S N H2NC NOCH2CO2 H C HCH2 -H Third 8. Cefoperazone so- dium HO H C NH CO N NO O C2H5 NN N NSC H2 CH3 -Na Third 9. Cefotaxime sodium S NC NOCH3 H2NCH2OCCH3 O -Na Third 10. Ceftazidime penta- hydrate S NC N H2N O CCO 2HH3C CH3 NC H2 + -H Third 11. Ceftriaxone sodium S NC NOCH3 H2N N N N O H3C SC H2 OH -Na Third  A. H. Rageh et al. / Natural Science 2 (2010) 828-840 Copyright © 2010 SciRes. Openly accessible at http://www.scirp.org/journal/NS/ 830 dation and subsequent reaction of the formed sulfide ions with chromogenic reagents [26,27]. NBD-Cl (Figure 2) has been reported as fluorogenic reagent for determination of amines [33] and for spec- trophotometric determination of many compounds [34-41]. Thiocompounds have been reported to form intensely colored products in an alkaline medium with NBD-Cl which could be used for their colorimetric de- termination [42]. It is always required to develop ana- lytical methods using low cost techniques. UV-Vis spec- trophotometry is still considered a convenient and eco- nomical technique for routine analysis of drugs in phar- maceutical formulations. On the basis of the aforemen- tioned reasons, it was decided to develop a quantitative method for the determination of the studied cepha- losporins based on their alkaline hydrolysis and subse- quent reaction of the resulting hydrolysates with NBD-Cl, which may be used for their analysis either in pure forms or in pharmaceutical formulations. This method is selective for cephalosporins, since other β-lactam antibiotics such as penicillins do not give sul- fide ions under the degradation conditions employed [27,43-45]. 2. EXPERIMENTAL 2.1. Apparatus Shimadzu UV-1700 PC, UV-Visible Spectrophotometer (Tokyo, Japan), ultrasonic cleaner (Cole-Parmer, Chi- cago, USA), sartorious handy balance-H51 (Hannover, Germany) and MLV type thermostatically controlled water bath (Salvis AG Emmenbruck, Luzern, Germany). 2.2. Materials and Reagents All solvents used were of analytical-reagent grade, so- dium hydroxide (El-Nasr Chemical Co. Cairo, Egypt) 0.5 M aqueous solution, hydrochloric acid (El-Nasr Chemical Co. Cairo, Egypt), 4-cholor-7-nitrobenzo- furazan [NBD-Cl] (Fluka Chemie AG, Switzerland) freshly prepared (3 × 10⁻³ M) equivalent to 0.060% w/v in acetone, samples of cephalosporins were generously supplied by their respective manufacturers and were used as supplied: cefaclor monohydrate and cefradine H N N H O Cl NO2 Figure 2. Chemical structure of NBD-Cl. anhydrous (Sigma Chemical Co., St. Louis, USA), ce- fadroxil monohydrate (Amoun Pharmaceutical Industries Co., APIC, Cairo, Egypt), cefalexin anhydrous (Gal- axoWellcome, S.A.E., El Salam City, Cairo, Egypt), ce- fotaxime sodium (CID, Cairo, Egypt), cefoperazone so- dium (Pfizer Co., Egypt), ceftazidime pentahydrate and ceftriaxone sodium (T3A Pharma Group, Assiut, Egypt), cefpodoxime proxetil (Hoechst Marion Roussel, S. A. E., Cairo, Egypt), cefixime (El-Hekma Co., Cairo, Egypt) and cefazolin sodium (Bristol-Myers Squibb Pharma- ceutical Co., Cairo, Egypt) and pharmaceutical formula- tions containing the studied drugs were purchased from local market. 2.3. Preparation of Standard Solutions Stock solutions containing 100 mg mL-1 of each cepha- losporin were prepared in double distilled water (methanol was used in case of cefadroxil monohydrate, cefalexin anhydrous, cefaclor monohydrate, cefradine anhydrous, cepodoxime proxetil and cefixime). Working standard solutions containing 0.5-2.5 mg mL-1 (in case of cefadroxil monohydrate and cefalexin anhydrous), 1- 6 mg mL-1 (in case of cefradine anhydrous), 2-8 mg mL-1 (in case of cefaclor monohydrate, cefazolin sodium, ce- fotaxime sodium, ceftriaxone sodium and cefpodoxime proxetil), 2-10 mg mL-1 (in case of cefixime) and 2- 16 mg mL-1 (in case of cefoperazone sodium and cef- tazidime pentahydrate) were prepared by suitable dilu- tion of the stock solution with double distilled water (in case of cefadroxil monohydrate, cefalexin anhydrous, cefaclor monohydrate, cepodoxime proxetil and ce- fixime, dilution was made using methanol). The stock and working standard solutions must be freshly pre- pared. 2.4. Preparation of Sample Solutions Tablets and capsules. Twenty tablets or the contents of 20 capsules were weighed, finely powdered and mixed thoroughly. An accurately weighed amount of the pow- der obtained from tablets or capsules equivalent to 250 mg of each drug was transferred into a 25-mL volumetric flask, dissolved in about 10 mL double distilled water (10 mL methanol was used in case of cefadroxil mono- hydrate, cefalexin anhydrous, cefaclor monohydrate, cefradine anhydrous, cepodoxime proxetil and cefixime), sonicated for 15 min, diluted to the mark with double distilled water (in case of cefadroxil monohydrate, ce- falexin anhydrous, cefaclor monohydrate, cefradine an- hydrous, cefpodoxime proxetil and cefixime, dilution was made using methanol), mixed well and filtered; the first portion of the filtrate was rejected. Further dilutions with the same solvent were made to obtain sample solu- tion containing the specified concentration for each drug  A. H. Rageh et al. / Natural Science 2 (2010) 828-840 Copyright © 2010 SciRes. Openly accessible at http://www.scirp.org/journal/NS/ 831 as mentioned under the preparation of standard solutions and then the general procedure was followed. Vials and powder for oral suspension. An accurately weighed amount of powder equivalent to 250 mg of each drug was transferred into a 25-mL volumetric flask, then the procedure was followed as under tablets and capsules beginning from (dissolved in about 10 mL double dis- tilled water……….). 2.5. General Procedure Accurately measured one milliliter aliquot volume of the standard or sample solutions was transferred into 10-mL volumetric flask. 5 mL of 0.5 M NaOH were added and the flask was heated in a boiling water-bath for 30 min, cooled to room temperature and completed to volume with double distilled water. One milliliter of the resulting drug hydrolysate was pipetted into 10-mL volumetric flask, 1.0 mL of 3 × 10⁻³ M NBD-Cl was added followed by 1 mL of concentrated HCl. The resulting solution was mixed well and the flask was completed to volume with ethanol. The absorbance was measured at 390 nm against reagent blank treated similarly. 3. RESULTS AND DISCUSSION 3.1. Absorption Spectra As shown in Figure 3, the absorption spectrum of NBD-Cl in acetone shows a maximum absorption at 340 nm. All the investigated drugs after alkaline hy- drolysis give a very weak absorption taking cefalexin anhydrous hydrolysate as a representative example which gives a very broad absorption maximum at 350 nm. The interaction colored product of cefalexin anhydrous hydrolysate with NBD-Cl shows absorption maximum at 390 nm (Figure 3). Figure 3. Absorption spectra of (a) NBD-Cl (3 × 10⁻³ M), (b) cefalexin anhydrous hydrolysate alone (20 µg mL-1) and (c) the reaction colored product between NBD-Cl and cefalexin anhydrous hydro- lysate. 3.2. Optimization of Reaction Variables Since the developed method depends on the formation of colored product by the interaction of NBD-Cl with sul- fide ions resulted from the alkaline degradation of cephalosporins so, optimization studies were carried out extensively to find the optimum conditions for the alka- line degradation and subsequently the optimum yield of sulfide ions and the maximum stability of the chromogen formed taking cefalexin anhydrous (15 μg mL-1) as a representative example for these studies. These variables include: Effect of NaOH concentration. The influence of so- dium hydroxide concentration on producing the maxi- mum absorption intensity was investigated using 0.1- 1.0 M NaOH keeping other factors constant. Maximum absorption readings were obtained upon using 0.5 M NaOH; above this concentration and up to 1 M NaOH, the absorbance remains constant. So, this concentration was selected for further work (Figure 4). Effect of hydrolysis time. The effect of hydrolysis time on the absorption intensity was studied using different heating times in a boiling water bath (at 100°C) starting from 10 min until 2 hours and the reaction was carried out as usual. The obtained absorbance readings were plotted against hydrolysis time. The maximum absorp- tion intensity was attained after 20 min and remained stable for at least 100 min. Thirty minutes hydrolysis time was used in all subsequent experiments as shown in Figure 5. Effect of NBD-Cl concentration. The concentration of NBD-Cl, for the maximum color development was var- ied in the range of 0.75 × 10⁻³-4 × 10⁻³ M. It was found that 1 mL of 3 × 10⁻³ M NBD-Cl was the most suitable con- 0 0.1 0.2 0.3 0.4 0.5 0.6 00.1 0.20.3 0.4 0.5 0.6 0.7 0.80.911.1 NaOH concentration (M) Absorbance, 390 nm Figure 4. Effect of NaOH concentration on the absorbance of the reaction colored product at 390 nm.  A. H. Rageh et al. / Natural Science 2 (2010) 828-840 Copyright © 2010 SciRes. Openly accessible at http://www.scirp.org/journal/NS/ 832 0 0.1 0.2 0.3 0.4 0.5 0.6 0 20406080100120140 Hydrolysis time (min) Absorbance, 390 nm Figure 5. Effect of hydrolysis time on the absorbance of the reaction colored product at 390 nm. Figure 6. Effect of NBD-Cl concentration on the ab- sorbance of the reaction colored product at 390 nm. centration for determination of the studied drugs as shown in Figure 6. Owing to the presence of labile chlo- ride, a daily fresh solution is recommended. Effect of type and concentration of acid. Different ac- ids such as sulfuric, hydrochloric, perchloric, nitric and acetic acids were tested to determine the most suitable acid for the reaction. One milliliter of concentrated hy- drochloric acid was selected in this study as it gave the highest absorbance readings taking cefalexin anhydrous (15 μg mL-1) as a representative example (Table 2). Further investigations were carried out in order to find the most suitable concentration of hydrochloric acid. It was observed that higher absorbance readings and more reproducible results were obtained upon increasing hy- drochloric acid concentration. As a result of these inves- tigations, 1 mL of concentrated hydrochloric acid was used for subsequent work. Effect of reaction time. The reaction between the in- vestigated drugs hydrolysates and NBD-Cl was very Table 2. Effect of different acids on the absorbance readings of the reaction colored product of cefalexin anhydrousa with NBD-Cl. Acid (1mL) Absorbanceb Hydrochloric acid 0.460 Sulfuric acid 0.400 Perchloric acid 0.413 Acetic acid 0.210 Nitric acid 0.315 aCefalexin anhydrous concentration used is 15 μg mL-1; bAverage of three determinations. rapid and the interaction colored product can survive before dilution unchanged for at least 1 hour. However, measurements were achieved instantaneously. Effect of diluting solvent. Different solvents were tested in order to select the most appropriate solvent for optimum color development. The results given in Table 3 show small shifts in the position of the maximum ab- sorption peak. The absorption intensities were slightly influenced. Ethanol was used throughout this work be- cause it gave the highest absorbance readings and the most reproducible results. Stability of the reaction colored product. Stability time was obtained by following the absorbance readings of the developed reaction product for 24 hours at room temperature (25 ± 5°C). It was found that the produced color was stable for 24 hours for all studied drugs. 3.3. Calibration Curves Linear relationship was obtained for all studied drugs by applying the developed method (Table 4). Good linear- ity of the calibration curves were clearly evident by ex- cellent correlation coefficients which ranged from 0.9990 to 0.9999 and coefficients of determination ranged from 0.9978 to 0.9998. This wide variation in the linearity range may be attributed to the different yields Table 3. Effect of solvent on λ max and the absorbance of the formed chromogen between cefalexin anhydrousa and NBD-Cl. Solvent λmax(nm) Ab Water 404 0.404 Ethanol 390 0.470 Methanol 391 0.401 Acetone 392 0.427 Acetonitrile 398 0.456 Propan-1-ol 390 0.467 Propan-2-ol 389 0.463 Dimethylformamaide 393 0.425 Dimehtylsulfoxide 401 0.458 aCefalexin anhydrous concentration is 15 μg mL-1; bAverage of 3 determinations.  A. H. Rageh et al. / Natural Science 2 (2010) 828-840 Copyright © 2010 SciRes. Openly accessible at http://www.scirp.org/journal/NS/ 833 Table 4. Summary of quantitative parameters and statistical data using the proposed procedure. Drug Intercept (a) ± SDa Slope (b) ± SDa Linear- ity Range (µg mL-1) Correlation coefficient (r) Determina- tion coeffi- cient (r2) LODb (µg mL-1) LOQc (µg mL-1) Cefadroxil monhy- drate -0.013 ± (3.6 × 10⁻³) 0.041 ± (0.2 × 10⁻³)5-25 0.9999 0.9998 0.29 0.88 Cefalexin anhydrous -0.126 ± (5.0 × 10⁻²) 0.398 ± (1.2 × 10⁻³)5-25 0.9999 0.9998 0.42 1.26 Cefradine anhydrous 0.076 ± (7.5 × 10⁻³) 0.013 ± (1.5 × 10⁻⁴)10-60 0.9999 0.9998 1.90 5.77 Cefaclor monohy- drate 0.055 ± (1.3 × 10⁻²) 0.010 ± (2.1 × 10⁻⁴)20-80 0.9996 0.9992 4.29 13.00 Cefazolin sodium 0.016 ± (4.3 × 10⁻³) 0.009 ± (1.9 × 10⁻⁴)20-80 0.9994 0.9988 1.58 4.78 Ceftriaxone sodium 0.033 ± (5.3 × 10⁻³) 0.010 ± (0.5 ×10⁻⁴) 20-80 0.9996 0.9992 1.75 5.30 Cefotaxime sodium 0.056 ± (1.2 × 10⁻²) 0.010 ± (1.5 × 10⁻⁴)20-80 0.9990 0.9980 3.96 12.00 Cefpodoxime proxetil 0.046 ± (1.6 × 10⁻²) 0.009 ± (1.3 × 10⁻⁴)20-80 0.9990 0.9980 5.87 17.78 Cefixime 0.095 ± (3.2 × 10⁻³) 0.007 ± (0.2 × 10⁻⁴)20-100 0.9989 0.9978 1.51 4.57 Cefoperazone sodium 0.019 ± (8.3 × 10⁻³) 0.005 ± (0.6 × 10⁻⁴)20-160 0.9998 0.9996 5.48 16.60 Ceftazidime penta- hydrate 0.048 ± (7.4 × 10⁻³) 0.005 ± (0.7 × 10⁻⁴)20-160 0.9994 0.9988 4.88 14.80 aAverage of six determinations; b Limit of detection; c Limit of quantitation. of sulfide ions from the studied cephalosporins [45]. 3.4. Method Validation Study The method was validated according ICH guidelines on the validation of analytical methods [46] and complied with USP 31 validation guidelines [3]. All results were expressed as percentages, where n represents the number of values. For the statistical analysis Excel 2003 (Mi- crosoft Office) was used. A 5% significance level was selected. LOD and LOQ. The limits of detection and quantita- tion for all studied drugs ranged from 0.29 to 5.87 and from 0.88 to 17.78 μg mL-1; respectively which indicate high sensitivity of the proposed method (Table 4). Accuracy. The accuracy of the method was deter- mined by investigating the recovery of each of the stud- ied drugs at three concentration levels covering the spe- cified range (six replicates of each concentration). The results shown in Table 5 depict good accuracy and re- covery percentage ranged from 98.0 to 102.3%. Precision. As shown in Table 6, the small values of SD and % RSD point to high precision of the proposed method. Selectivity. The effect of the presence of common ex- cipients such as; starch, talc, lactose, glucose, sucrose, magnesium-stearate and gum acacia was studied. It was found that no interference was introduced by any of them. Robustness. Robustness was examined by evaluating the influence of small variation in the experimental pa- rameters on the analytical performance of the proposed method [47]. The studied parameters were: NaOH con- centration, NBD-Cl concentration, heating temperature and heating time on the method suitability and sensitivity. It was found that none of these variables significantly affects the performance of the method (Table 7) which indicates the robustness of the proposed method. 3.5. Applications to the Analysis of Pharmaceutical Dosage Forms The proposed method was applied successfully for de- termination of the studied drugs in their pharmaceutical dosage forms. Six replicate measurements were made in each case, the results obtained were validated by com- parison with a previously reported method [48]. No sig- nificant difference was found by applying t- and F-tests at 95% confidence level indicating good accuracy and precision (Table 8). Recovery studies were also carried out by standard addition method [49]. The results in Ta- ble 9 indicate good recoveries (96.0 to 103.8%) and confirm that there is no interference from frequently encountered excipients or additives. 3.6. Suggested Reaction Mechanism Cephalosporins were previously reported to produce sulfide ions upon alkaline degradation and it was found to be one of their major degradation products [43-45, 50-55]. NBD-Cl is an active halide derivative, which was considered as a likely target for good nuclophiles, under alkaline conditions, such as amines, amino acids and thiocompounds [40-42]. In the proposed method, sulfide ions were allowed to react with NBD-Cl via SN2 mechanism. The high nu- cleophilicity of sulfide ions, the presence of Cl– anion as  A. H. Rageh et al. / Natural Science 2 (2010) 828-840 Copyright © 2010 SciRes. Openly accessible at http://www.scirp.org/journal/NS/ 834 Table 5. Accuracy of the proposed method for analysis of the studied drugs at three concentration levels. Recovery (%) ± SD a Drug 25 µg mL-1 50 µg mL-1 75 µg mL-1 Cefaclor monohydrate 100.6 ± 0.93 101.4 ± 0.75 102.1 ± 0.30 Ceftriaxone sodium 99.3 ± 0.52 100.6 ± 0.96 100.2 ± 0.51 Cefotaxime sodium 99.7 ± 1.35 101.5 ± 0.83 101.3 ± 1.16 Cefixime 98.3 ± 1.24 98.7 ± 0.58 98.6 ± 0.73 Cefazolin sodium 101.1 ± 1.08 98.9 ± 0.60 102.3 ± 0.68 Cefpodoxime proxetil 99.4 ± 0.35 99.4 ± 0.47 99.0 ± 0.29 Recovery (%) ± SD a Drug 10 µg mL-1 15 µg mL-1 20 µg mL-1 Cefadroxil monohydrate 99.9 ± 1.31 100.4 ± 0.83 99.1 ± 0.90 Cefalexin anhydrous 98.6 ± 0.26 102.2 ± 1.29 98.0 ± 0.41 Recovery (%) ± SD a Drug 40 µg mL-1 80 µg mL-1 120 µg mL-1 Ceftazidime pentahydrate 102.3 ± 0.86 98.9 ± 1.25 99.6 ± 0.82 Cefoperazone sodium 98.0 ± 0.70 100.3 ± 1.11 101.4 ± 1.03 Recovery (%) ± SD a Drug 15 µg mL-1 30 µg mL-1 45 µg mL-1 Cefradine anhydrous 98.3 ± 0.51 100.8 ± 0.66 100.7 ± 0.87 aAverage of six replicates. Table 6. Intra- and inter-day precision of the proposed spectrophotometric method. Intra-day precision Inter-day precision Drug Drug Conc. (µg mL-1) Mean ± SDa % RSD Mean ± SDa % RSD Cefaclor monohydrate 25 99.6 ± 0.93 0.93 99.4 ± 1.29 1.30 50 99.9 ± 1.65 1.66 98.5 ± 0.90 0.91 75 100.1 ± 1.40 1.40 100.7 ± 1.12 1.12 Cefalexin anhydrous 10 100.3 ± 1.17 1.16 98.9 ± 1.23 1.25 15 100.4 ± 1.53 1.52 99.0 ± 0.97 0.98 20 100.1 ± 1.16 1.16 100.5 ± 0.88 0.88 Cefadroxil monohydrate 10 99.4 ± 0.99 1.00 101.0 ± 1.09 1.08 15 99.9 ± 0.85 0.85 100.5 ± 0.77 0.76 20 100.2 ± 1.37 1.37 98.7 ± 0.68 0.69 Cefradine anhydrous 15 100.1 ± 1.03 1.02 99.5 ± 1.13 1.14 30 100.0 ± 1.15 1.15 98.4 ± 0.85 0.86 45 100.6 ± 1.16 1.15 100.4 ± 1.54 1.54 Cefoperazone sodium 40 99.6 ± 0.93 0.93 101.3 ± 1.43 1.41 80 99.7 ± 0.67 0.67 101.7 ± 1.63 1.61 120 100.3 ± 1.35 1.34 99.1 ± 1.40 1.41 Ceftazidime pentahydrate 40 100.0 ± 1.39 1.39 100.9 ± 0.99 0.98 80 99.6 ± 1.30 1.31 101.3 ± 1.27 1.25 120 99.9 ± 1.04 1.05 98.9 ± 1.12 1.13  A. H. Rageh et al. / Natural Science 2 (2010) 828-840 Copyright © 2010 SciRes. Openly accessible at http://www.scirp.org/journal/NS/ 835 Table 6. (Continued). Intra-day precision Inter-day precision Drug Drug Conc. (µg mL-1) Mean ± SDa % RSD Mean ± SDa % RSD Ceftriaxone sodium 25 100.4 ± 1.57 1.56 99.2 ± 0.99 1.00 50 101.0 ± 1.27 1.26 100.8 ± 1.15 1.14 75 99.8 ± 1.38 1.39 98.6 ± 1.54 1.57 Cefotaxime sodium 25 99.3 ± 1.05 1.06 99.0 ± 0.77 0.78 50 98.8 ± 0.78 0.79 101.4 ± 1.46 1.44 75 99.4 ± 1.29 1.30 98.5 ± 0.91 0.93 Cefixime 25 99.5 ± 0.81 0.81 100.9 ± 0.99 0.98 50 99.8 ± 1.02 1.03 99.7 ± 1.17 1.17 75 99.6 ± 1.48 1.48 98.3 ± 1.65 1.67 Cefazolin sodium 25 100.5 ± 1.15 1.14 100.6 ± 0.68 0.67 50 100.6 ± 1.36 1.35 99.6 ± 1.35 1.35 75 101.4 ± 0.74 0.73 98.8 ± 1.12 1.14 Cefpodoxime proxetil 25 100.4 ± 0.89 0.89 101.3 ± 0.77 0.76 50 100.5 ± 1.15 1.15 99.7 ± 1.55 1.55 75 100.0 ± 1.70 1.70 100.6 ± 1.63 1.62 aAverage of six determinations. Table 7. Robustness of the proposed spectrophotometric method. Recovery (%) ± SDa Experimental parameter variationCefadroxil monohydrate (20 µg mL-1) Cefalexin anhydrous (20 µg mL-1) Cefradine anhydrous (40 µg mL-1) Cefaclor monohydrate (60 µg mL-1) Cefopera- zone sodium (80 µg mL-1) Ceftazidime pentahydrate (80 µg mL-1) No variationb 99.4 ± 1.21 99.8 ± 0.31 99.5 ± 1.82 99.5 ± 1.13 99.2 ± 0.56 99.5 ± 0.47 1- NaOH concentration 0.45 M 0.55 M 98.3 ± 0.85 98.6 ± 1.19 97.9 ± 1.20 100.9 ± 1.15 101.5 ± 1.32 98.2 ± 0.52 97.5 ± 0.54 101.3 ± 0.77 101.8 ± 1.11 99.4 ± 1.31 97.4 ± 1.12 98.3 ± 1.34 2- NBD-Cl concentration 2.8 × 10⁻³M 3.2 × 10⁻³M 102.0 ± 0.25 98.5 ± 1.31 100.3 ± 1.35 100.9 ± 0.92 98.2 ± 1.56 98.0 ± 1.15 102.1 ± 0.35 98.5 ± 0.91 100.9 ± 1.58 98.5 ± 0.83 100.9 ± 1.15 102.0 ± 0.88 3- Heating temperature 95°C 100°C 98.8 ± 0.78 99.6 ± 1.35 97.9 ± 1.20 100.8 ± 1.60 102.4 ± 156 100.4 ± 0.90 102.7 ± 2.21 99.8 ± 1.02 101.0 ± 1.27 101.3 ± 1.27 101.4 ± 2.04 98.0 ± 2.15 4- Heating time 25 min 35 min 100.5 ± 1.23 100.1 ± 1.40 99. 2 ± 0.99 100.4 ± 1.53 98.5 ± 1.57 98.7 ± 0.68 97.5 ± 1.98 99.6 ± 0.93 99.1 ± 1.40 100.9 ± 0.99 99.4 ± 1.29 98.5 ± 0.90 Table 7. (Continued). Recovery (%) ± SDa Experimental parameter variationCeftriaxone so- dium (60 µg mL-1) Cefotaxime sodium (60 µg mL-1) Cefixime (60 µg mL-1) Cefazolin sodium (60 µg mL-1) Cefpodoxime proxetil (60 µg mL-1) No variationb 99.5 ± 0.66 97.6 ± 1.55 100.7 ± 0.98 99.5 ± 1.23 99.5 ± 1.01 1- NaOH concentration 0.45 M 0.55 M 100.2 ± 1.35 98.7 ± 0.98 99.5 ± 0.67 98.3 ± 0.49 99.6 ± 1.27 98.4 ± 0.73 98.6 ± 0.88 102.4 ± 1.145 98.1 ± 0.60 99.5 ± 1.27 2- NBD-Cl concentration 2.8 × 10⁻³M 3.2 × 10⁻³M 99.6 ± 1.15 98.0 ± 0.75 102.0 ± 0.71 102.3 ± 0.58 102.3 ± 1.30 99.5 ± 0.69 99.7 ± 1.35 101.5 ± 0.70 98.4 ± 1.40 99.9 ± 0.49 3- Heating temperature 95°C 100°C 99.0 ± 1.30 97.5 ± 0.68 99.4 ± 0.66 98.4 ± 1.13 98.7 ± 0.66 101.9 ± 1.35 100.6 ± 0.48 97.5 ± 1.44 100.8 ± 0.72 99.1 ± 0.65 4- Heating time 25 min 35 min 101.1 ± 1.44 98.1 ± 0.81 97.8 ± 0.90 101.4 ± 1.41 99.6 ± 0.56 100.8 ± 1.27 99.7 ± 0.70 101.9 ± 0.72 97.8 ± 0.49 98.0 ± 1.34 aAverage of three determinations; bFollowing the general assay procedure conditions.  A. H. Rageh et al. / Natural Science 2 (2010) 828-840 Copyright © 2010 SciRes. Openly accessible at http://www.scirp.org/journal/NS/ 836 Table 8. Determination of the studied drugs in their pharmaceutical dosage forms. Recovery % ± SD Drug Pharmaceutical product Proposed method (n = 6) Reported methodb (n = 6) Cefaclor monohydrate Ceclor® suspensionc 250 mg of cefaclor monohydrate/5 mL 97.8 ± 0.5, t = 0.382a F = 1.562a 97.7 ± 0.40 Bacticlor® suspensiond 250 mg of cefaclor anhydrous/5 mL 97.2 ± 0.5, t = 1.913 F = 1.562 96.7 ± 0.40 Cefadroxil monohydrate Duricef® tabletse 1 g of cefadroxil monohydrate/tablet 98.7 ± 0.3, t = 2.038 F = 2.250 99.0 ± 0.20 Duricef® suspensione 250 mg of cefadroxil monohydrate/5 mL 96.6 ± 1.3, t = 1.605 F = 2.641 97.6 ± 0.80 Duricef® capsulese 500 mg of cefadroxil monohydrate/capsule 97.9 ± 1.3, t = 1.332 F = 1.032 98.9 ± 1.30 Biodroxil® capsulesf 500 mg of cefadroxil monohydrate/capsule 102.4 ± 1.4, t = 0.930 F = 1.361 101.7 ± 1.20 Biodroxil® suspensionf 250 mg of cefadroxil monohydrate/5 mL 103.1 ± 0.6, t = 1.359 F = 2.250 102.7 ± 0.40 Cefalexin anhydrous Ceporex® tabletsg 500 mg of cefalexin anhydrous/tablet 99.3 ± 1.6, t = 0.646 F = 1.778 98.7 ± 1.20 Ceporex® suspensiong 250 mg of cefalexin anhydrous/5 mL 99.0 ± 1.5, t = 0.735 F = 3.516 98.5 ± 0.80 Ospexin® suspensionh 250 mg of cefalexin anhydrous/5 mL 103.5 ± 1.5, t = 0.576 F = 3.516 103.1 ± 0.80 Cefradine anhydrous Velosef® capsulese 250 mg of cefradine anhydrous/capsule 97.7 ± 0.5, t = 1.530 F = 1.562 97.3 ± 0.40 Velosef® tabletse 1 g of cefradine anhydrous/tablet 103.3 ± 1.2, t = 1.019 F = 2.250 102.7 ± 0.80 Velosef® suspensione 205 mg of cefradine anhydrous/5mL 99.0 ± 1.5, t = 0.588 F = 3.516 98.5 ± 0.80 Velosef® vialse 1 g of cefradine anhydrous/vial 97.9 ± 1.2, t = 0.267 F = 1.778 97.7 ± 0.90 Cefotax® vialsi 500 mg of cefotaxime sodium/vial 98.2 ± 1.8, t = 0.365, F = 3.932; 97.9 ± 0.90 Cefotaxime sodium Claforan® vialsj 500 mg of cefotaxime sodium/vial 97.9 ± 1.2, t = 0.326, F = 1.778; 97.7 ± 0.90 Ceftazidime pentahydrate Fortum® vialsk 500 mg of ceftazidime pentahydrate/vial 98.9 ± 0.6, t = 1.460, F = 4.001; 98.5 ± 0.30 Cefoperazone sodium Cefozon® vialsl 500 mg of cefoperazone sodium/vial 102.3 ± 1.4, t = 1.721, F = 4.003; 101.2 ± 0.70 Ceftriaxone sodium Ceftriaxone® vialsm 500 mg of ceftriaxone sodium/vial 97.7 ± 0.4, t = 1.643, F = 4.002; 98.0 ± 0.20 Cefixime Xi macef® capsulesn 400 mg of cefixime/capsule 102.1 ± 1.4, t = 0.797 F = 1.361 101.5 ± 1.20 Cefazolin sodium Zinol® vialso 500 mg of cefazolin sodium/vial 98.9 ± 1.3, t = 1.493 F = 3.449 98.0 ± 0.70 Cefpodoxime proxetil Orelox® tabletsq 100 mg of cefpodoxime proxetil/tablet 98.2 ± 1.8, t = 0.298 F = 3.932 97.9 ± 0.90 a Theoretical value for t and F at 95% confidence limit, t = 2.228 and F = 5.053; b Reference 48; cEgyptian Pharmaceuticals and chemicals in- dustries Co., S.A.E., Bayad El-Arab, Beni Suef, Egypt; d Pharco Pharmaceuticals, Alexandria under license from Ranbaxy UK; e Bristol-Myers Squibb Pharmaceutical Co., Cairo, Egypt; f Kahira Pharm. & Chem. Ind. Co. under license from Novartis Pharma S.A.E., Cairo, Egypt; 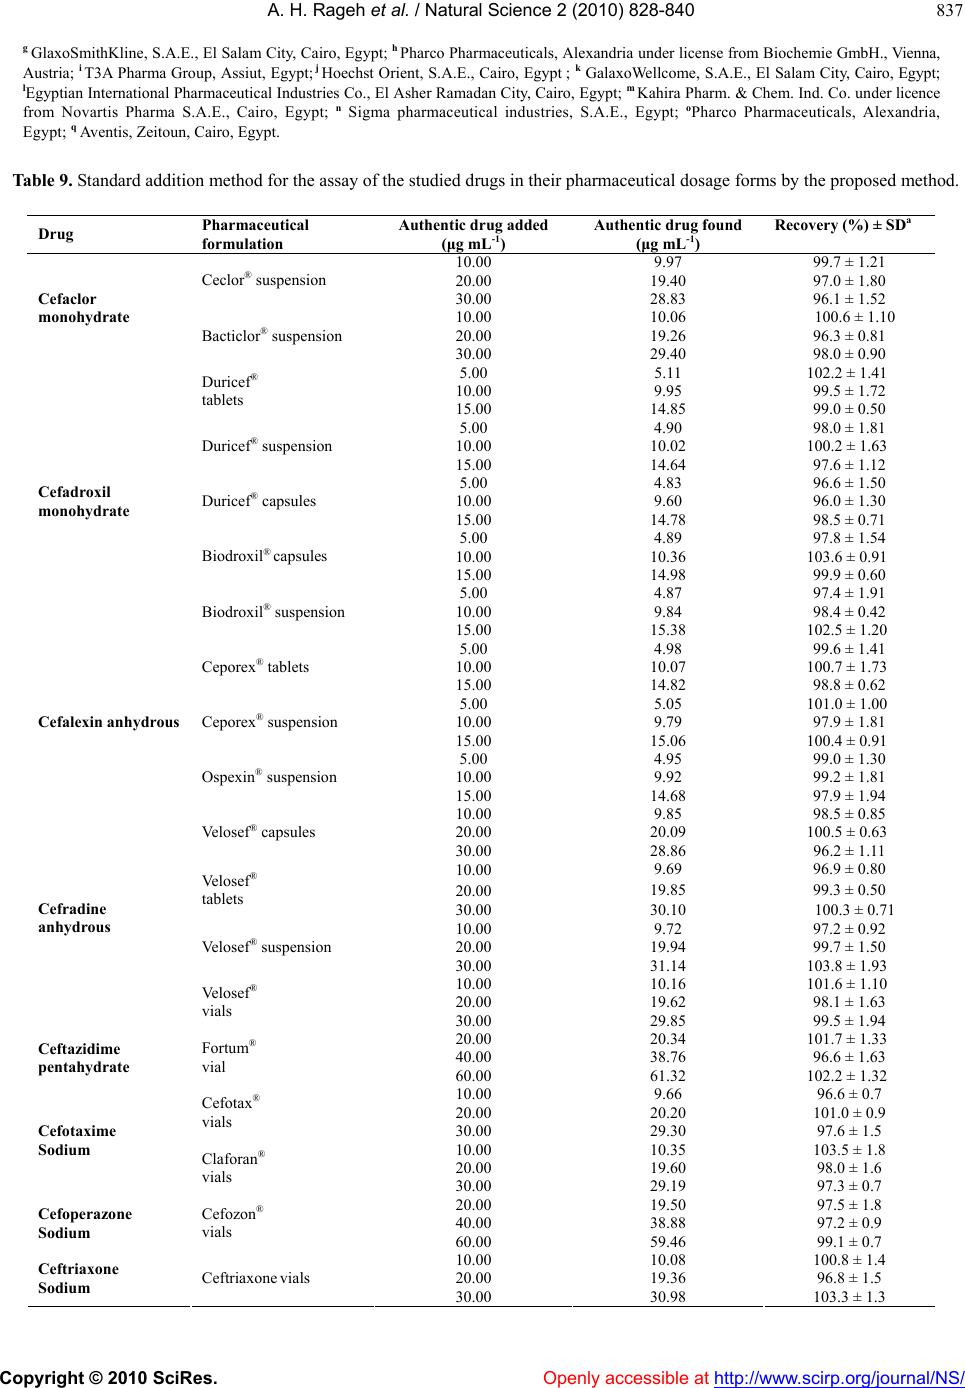 A. H. Rageh et al. / Natural Science 2 (2010) 828-840 Copyright © 2010 SciRes. Openly accessible at http://www.scirp.org/journal/NS/ 837 g GlaxoSmithKline, S.A.E., El Salam City, Cairo, Egypt; h Pharco Pharmaceuticals, Alexandria under license from Biochemie GmbH., Vienna, Austria; i T3A Pharma Group, Assiut, Egypt; j Hoechst Orient, S.A.E., Cairo, Egypt ; k GalaxoWellcome, S.A.E., El Salam City, Cairo, Egypt; lEgyptian International Pharmaceutical Industries Co., El Asher Ramadan City, Cairo, Egypt; m Kahira Pharm. & Chem. Ind. Co. under licence from Novartis Pharma S.A.E., Cairo, Egypt; n Sigma pharmaceutical industries, S.A.E., Egypt; oPharco Pharmaceuticals, Alexandria, Egypt; q Aventis, Zeitoun, Cairo, Egypt. Table 9. Standard addition method for the assay of the studied drugs in their pharmaceutical dosage forms by the proposed method. Drug Pharmaceutical formulation Authentic drug added (μg mL-1) Authentic drug found (μg mL-1) Recovery (%) ± SDa 10.00 9.97 99.7 ± 1.21 20.00 19.40 97.0 ± 1.80 Ceclor® suspension 30.00 28.83 96.1 ± 1.52 10.00 10.06 100.6 ± 1.10 20.00 19.26 96.3 ± 0.81 Cefaclor monohydrate Bacticlor® suspension 30.00 29.40 98.0 ± 0.90 5.00 5.11 102.2 ± 1.41 10.00 9.95 99.5 ± 1.72 Duricef® tablets 15.00 14.85 99.0 ± 0.50 5.00 4.90 98.0 ± 1.81 10.00 10.02 100.2 ± 1.63 Duricef® suspension 15.00 14.64 97.6 ± 1.12 5.00 4.83 96.6 ± 1.50 10.00 9.60 96.0 ± 1.30 Duricef® capsules 15.00 14.78 98.5 ± 0.71 5.00 4.89 97.8 ± 1.54 10.00 10.36 103.6 ± 0.91 Biodroxil® capsules 15.00 14.98 99.9 ± 0.60 5.00 4.87 97.4 ± 1.91 10.00 9.84 98.4 ± 0.42 Cefadroxil monohydrate Biodroxil® suspension 15.00 15.38 102.5 ± 1.20 5.00 4.98 99.6 ± 1.41 10.00 10.07 100.7 ± 1.73 Ceporex® tablets 15.00 14.82 98.8 ± 0.62 5.00 5.05 101.0 ± 1.00 10.00 9.79 97.9 ± 1.81 Ceporex® suspension 15.00 15.06 100.4 ± 0.91 5.00 4.95 99.0 ± 1.30 10.00 9.92 99.2 ± 1.81 Cefalexin anhydrous Ospexin® suspension 15.00 14.68 97.9 ± 1.94 10.00 9.85 98.5 ± 0.85 20.00 20.09 100.5 ± 0.63 Velosef® capsules 30.00 28.86 96.2 ± 1.11 10.00 9.69 96.9 ± 0.80 20.00 19.85 99.3 ± 0.50 Velosef® tablets 30.00 30.10 100.3 ± 0.71 10.00 9.72 97.2 ± 0.92 20.00 19.94 99.7 ± 1.50 Velosef® suspension 30.00 31.14 103.8 ± 1.93 10.00 10.16 101.6 ± 1.10 20.00 19.62 98.1 ± 1.63 Cefradine anhydrous Velosef® vials 30.00 29.85 99.5 ± 1.94 20.00 20.34 101.7 ± 1.33 40.00 38.76 96.6 ± 1.63 Ceftazidime pentahydrate Fortum® vial 60.00 61.32 102.2 ± 1.32 10.00 9.66 96.6 ± 0.7 20.00 20.20 101.0 ± 0.9 Cefotax® vials 30.00 29.30 97.6 ± 1.5 10.00 10.35 103.5 ± 1.8 20.00 19.60 98.0 ± 1.6 Cefotaxime Sodium Claforan® vials 30.00 29.19 97.3 ± 0.7 20.00 19.50 97.5 ± 1.8 40.00 38.88 97.2 ± 0.9 Cefoperazone Sodium Cefozon® vials 60.00 59.46 99.1 ± 0.7 10.00 10.08 100.8 ± 1.4 20.00 19.36 96.8 ± 1.5 Ceftriaxone Sodium Ceftriaxone vials 30.00 30.98 103.3 ± 1.3 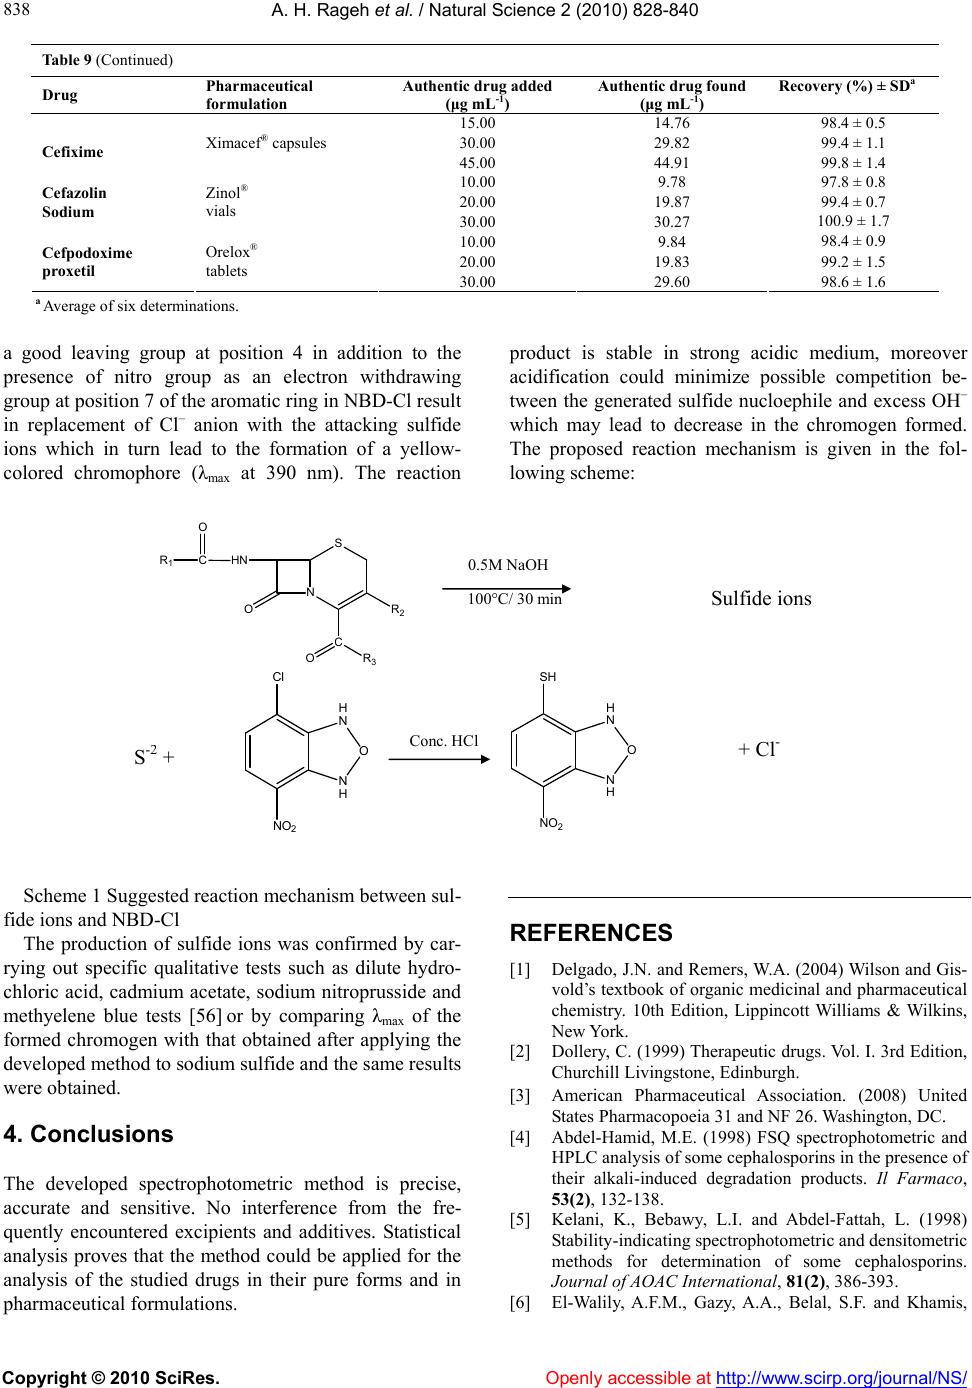 A. H. Rageh et al. / Natural Science 2 (2010) 828-840 Copyright © 2010 SciRes. Openly accessible at http://www.scirp.org/journal/NS/ 838 Table 9 (Continued) Drug Pharmaceutical formulation Authentic drug added (μg mL-1) Authentic drug found (μg mL-1) Recovery (%) ± SDa 15.00 14.76 98.4 ± 0.5 30.00 29.82 99.4 ± 1.1 Cefixime Ximacef® capsules 45.00 44.91 99.8 ± 1.4 10.00 9.78 97.8 ± 0.8 20.00 19.87 99.4 ± 0.7 Cefazolin Sodium Zinol® vials 30.00 30.27 100.9 ± 1.7 10.00 9.84 98.4 ± 0.9 20.00 19.83 99.2 ± 1.5 Cefpodoxime proxetil Orelox® tablets 30.00 29.60 98.6 ± 1.6 a Average of six determinations. a good leaving group at position 4 in addition to the presence of nitro group as an electron withdrawing group at position 7 of the aromatic ring in NBD-Cl result in replacement of Cl– anion with the attacking sulfide ions which in turn lead to the formation of a yellow- colored chromophore (λmax at 390 nm). The reaction product is stable in strong acidic medium, moreover acidification could minimize possible competition be- tween the generated sulfide nucloephile and excess OH– which may lead to decrease in the chromogen formed. The proposed reaction mechanism is given in the fol- lowing scheme: N H O H N Cl NO2 0.5M NaOH 100°C/ 30 min Conc. HCl N H O H N SH NO2 S N R2 C OR 3 O HNC O R1 Sulfide ions Scheme 1 Suggested reaction mechanism between sul- fide ions and NBD-Cl The production of sulfide ions was confirmed by car- rying out specific qualitative tests such as dilute hydro- chloric acid, cadmium acetate, sodium nitroprusside and methyelene blue tests [56] or by comparing λmax of the formed chromogen with that obtained after applying the developed method to sodium sulfide and the same results were obtained. 4. Conclusions The developed spectrophotometric method is precise, accurate and sensitive. No interference from the fre- quently encountered excipients and additives. Statistical analysis proves that the method could be applied for the analysis of the studied drugs in their pure forms and in pharmaceutical formulations. REFERENCES [1] Delgado, J.N. and Remers, W.A. (2004) Wilson and Gis- vold’s textbook of organic medicinal and pharmaceutical chemistry. 10th Edition, Lippincott Williams & Wilkins, New York. [2] Dollery, C. (1999) Therapeutic drugs. Vol. I. 3rd Edition, Churchill Livingstone, Edinburgh. [3] American Pharmaceutical Association. (2008) United States Pharmacopoeia 31 and NF 26. Washington, DC. [4] Abdel-Hamid, M.E. (1998) FSQ spectrophotometric and HPLC analysis of some cephalosporins in the presence of their alkali-induced degradation products. Il Farmaco, 53(2), 132-138. [5] Kelani, K., Bebawy, L.I. and Abdel-Fattah, L. (1998) Stability-indicating spectrophotometric and densitometric methods for determination of some cephalosporins. Journal of AOAC International, 81(2), 386-393. [6] El-Walily, A.F.M., Gazy, A.A., Belal, S.F. and Khamis, + Cl- S- 2 +  A. H. Rageh et al. / Natural Science 2 (2010) 828-840 Copyright © 2010 SciRes. Openly accessible at http://www.scirp.org/journal/NS/ 839 E.F. (2000) Quantitative determination of some thiazole cephalosporins through complexation with palladium (II) chloride. Journal of Pharmaceutical and Biomedical Analysis, 22(2), 385-392. [7] Agbaba, D., Eric, S., Karljikovic-Rajic, K., Vladimirov, S. and Zivanov-Stakic, D. (1997) Spectrophotometric de- termination of certain cephalosporins using ferrihydrox- amate method. Spectroscopy Letters, 30(2), 309-319. [8] El-Walily, A.F.M., Gazy, A.A., Belal, S.F. and Khamis, E.F. (2000) Use of cerium (IV) in the spectrophotometric and spectrofluorimetric determinations of penicillins and cephalosporins in their pharmaceutical preparations. Spec- troscopy Letters, 33(6), 931-948. [9] Yang, J., Zhou, G.J., Cao, X.H., Ma, Q.L. and Dong, J. (1998) Study on the fluorescence characteristics of alka- line degradation of cefadroxil, cefradine, cefotaxime so- dium and amoxicillin. Analytical Letters, 31(6), 1047- 1060. [10] Aly, F.A., Hefnawy, M.M. and Belal, F. (1996) A selec- tive spectrofluorimetric method for the determination of some α-aminocephalosporins in formulations and bio- logical fluids. Analytical Letters, 29(1), 117-130. [11] Yang, J.H, Ma, Q.L., Wu, X., Sun, L.M. and Cao, X.H. (1999) A new luminescence spectrometry for the deter- mination of some β-lactamic antibiotics. Analytical Let- ters, 32(3), 471-480. [12] Hefnawy, M., El-Shabrawy, Y. and Belal, F. (1999) Spec- trofluorometric determination of alpha-aminocephalosporins in biological fluids and pharmaceutical preparations. Journal of Pharmaceutical and Biomedical Analysis, 21(4), 703-707. [13] El-Walily, A.F.M., Gazy, A.A., Belal, S.F. and Khamis, E.F. (1999) Selective spectrofluorimetric determination of phenolic β-lactam antibiotics through the formation of their coumarin derivatives. Journal of Pharmaceutical and Biomedical Analysis, 20(4), 643-653. [14] Li, Y. and Lu, J. (2006) Chemiluminescence flow- injection analysis of β-lactam antibiotics using the lumi- nol-permanganate reaction. Luminescence, 21(4), 251- 255. [15] Yao, H., Tang, Y., Li, Y. and Sun, Y. (2003) Flow injec- tion chemiluminescence determination of cephalosporin antibiotics by their enhancing effects on luminal-po- tassium periodate system. Analytical Letters, 36(14), 2975-2983. [16] Thongpoon, C., Liawruangrath, B., Liawruangrath, S., Wheatley, R.A. and Townshend, A. (2006) Flow injection chemiluminescence determination of cefadroxil using po- tassium permanganate and formaldehyde system. Journal of Pharmaceutical and Biomedical Analysis, 42(2), 277- 282. [17] Shinde, V.M. and Shabadi, C.V. (1997) Simultaneous determination of cefadroxil and cefalexin from capsules by reversed phase HPLC. Indian Drugs, 34, 399-402. [18] Misztal, G. (1998) Determination of cefotaxime and ce- fotriaxone in pharmaceuticals by HPLC. Pharmazie, 53, 723-724. [19] Shinde, V.M. and Shabadi, C.V. (1998) Simultaneous determination of ceazolin and cefotaxime from injections by reversed phase HPLC. Indian Journal of Pharmaceu- tical Sciences, 60(5), 313-315. [20] LaCourse, W.R. and Dasenbrock C.O. (1999) Pulsed electrochemical detection of sulfur-containing antibiotics following high performance liquid chromatography. Journal of Pharmaceutical and Biomedical Analysis, 19(1-2), 239-252. [21] Özkan, S.A., Erk, N., Uslu, B., Yilmaz, N. and Biryol, I. (2000) Study on electrooxidation of cefadroxil monohy- drate and its determination by differential pulse voltam- metry. Journal of Pharmaceutical and Biomedical Analy- sis, 23(2-3), 263-273. [22] Rodrigues, L.N.C., Zanoni, M.B.V. and Fogg, A.G. (1999) Indirect polarographic and cathodic-stripping voltammetric determination of cefaclor as an alkaline degradation product. Journal of Pharmaceutical and Biomedical Analysis, 21(3), 497-505. [23] El-Maali, N.A., Ali, A.M.M. and Ghandour, M.A. (1993) Electrochemical reduction and oxidation of two cepha- losporin antibiotics: Ceftriaxone (Rocephin) and cefop- erazone (Cefobid). Electroanalysis (N. Y.), 5(7), 599-604. [24] Ferreira, V.S., Zanoni, M.V.B. and Fogg, A.G. (1999) Cathodic stripping voltammetric determination of cef- tazidime with reactive accumulation at a poly-L-lysine modified hanging mercury drop electrode. Analytia Chimica Acta, 384(2), 159-166. [25] El-Obeid, H.A., Gad-Kariem, E.A., Al-Rashood, K.A., Al-Khames, H.A., El-Shafie, F.S. and Bawaseer, G.A.M. (1999) A selective colorimetric method for the determi- nation of penicillins and cephalosporins with α-ami- noacyl functions. Analytical Letters, 32(14), 2809-2823. [26] Mohamed, F.A. (1998) Spectrophotoemtric determina- tion of sulphide and some sulphide producing com- pounds. In Proceedings of Assiut University 1st Pharma- ceutical Science Conference, Faculty of Pharmacy, As- siut, 1998, 1-18. [27] Metwally, F.H., Alwarthan, A.A. and Al-Tamimi, S.A. (2001) Flow-injection spectrophotometric determination of certain cephalosporins based on the formation of dyes. Il Farmaco, 56(8), 601-607. [28] Sastry, C.S.P., Rao, S.G., Naidu, P.Y. and Srinivas, K.R. (1998) New spectrophotometric method for the deter- mination of some drugs with iodine and wool fast blue BL. Talanta, 45(6), 1227-1234. [29] Helaleh, M.I.H. and Abu-Nameh, E.S.M. (1998) A ki- netic approach for determination of cefadroxil in phar- maceuticals by alkaline hydrolysis. Journal of AOAC International, 81(3), 528-533. [30] Ivama, V.M., Rodrigues, L.N.C., Guaratini, C.C.I. and Zanoni, M.V.B. (1999) Spectrophotometric determination of cefaclor in pharmaceutical preparations. Quimica Nova, 22(2), 201-204. [31] Al-Momani, I.F. (2004) Flow-Injection spectrophotomet- ric determination of amoxycillin, cefalexin, ampicillin, and cefradine in pharmaceutical formulations. Analytical Letters, 37(10), 2099-2110. [32] Amin, A.S. and Shama, S.A. (2000) Vanadophosphoric acid as a modified reagent for the spectrophotometric de- termination of certain cephalosporins and their dosage forms. Monatshefte fur Chemie, 131(4), 313-319. [33] Omai, K., Toyo'oka, T. and Miyano, H. (1984) Fluori- genic reagents for primary and secondary amines and thiols in high-performance liquid chromatography. A re- view. The Analyst (London), 109(11), 1365-1372. [34] Olgun, N., Erturk, S. and Atmaca, S. (2002) Spectro-  A. H. Rageh et al. / Natural Science 2 (2010) 828-840 Copyright © 2010 SciRes. Openly accessible at http://www.scirp.org/journal/NS/ 840 fluorimetric and spectrophotometric methods for the de- termination of vigabatrin in tablets. Journal of Pharma- ceutical and Biomedical Analysis, 29(1-2), 1-5. [35] Onal, A., Kepekci, S.E. and Oztunc, A. (2005) Spectro- photometric methods for the determination of an- tidepressant drug paroxetine hydrochloride in tab- lets. Journal of AOAC International, 88(2), 490-495. [36] Olojo, R.O., Xia, R.H. and Abramson, J.J. (2005) Spec- trophotometric and fluorometric assay of superoxide ion using 4-chloro-7-nitrobenzo-2-oxa-1,3-diazole. Analytical Biochemistry, 339(2), 338-344. [37] El-Emam, A.A., Hansen, S.H., Moustafa, M.A., El- Ashry, S.M. and El-Sherbiny, D.T. (2004) Determination of lisinopril in dosage forms and spiked human plasma through derivatization with 7-chloro-4-nitrobenzo-2-oxa- 1,3-diazole (NBD-Cl) followed by spectrophotometry or HPLC with fluorimetric detection. Journal of Pharma- ceutical and Biomedical Analysis, 34(1), 35-44. [38] Taha, E.A. (2003) Kinetic spectrophotometric methods for the determination of dothiepin hydrochloride in bulk and in drug formulation. Analytical and Bioanalytical Chemistry, 376(7), 1131-1136. [39] Amin, A.S., Ragab, G.H. and Saleh, H. (2002) Colorimet- ric determination of β-blockers in pharmaceutical formu- lations. Journal of Pharmaceutical and Biomedical Analysis, 30(4), 1347-1353. [40] Abdellatef, H.E. (2002) Kinetic spectrophotometric de- termination of tramadol hydrochloride in pharmaceutical formulation. Journal of Pharmaceutical and Biomedical Analysis, 29(5), 835-842. [41] El-Enany, N., Belal F. and Rizk, M. (2004) Spectropho- tometric determination of salbutamol in bulk and dosage forms after derivatization with 4 Chloro-7-nitrobenzo-2- oxa-1,3-diazole (NBD Cl). Chemia Analityczna (War- saw), 49(2), 261-269. [42] Askal, H.F., Abdelmaged, O.H. and Kashaba, P.Y. (1995) Egyptian Journal of Analytical Chemistry, 4, 89-103. [43] Alwarthan, A.A., Metwally, F.H. and Al-Tamimi, S.A. (1993) Spectrophotometric assay of certain cephalosporins based on formation of ethylene blue. Analytical Letters, 26(12), 2619-2635. [44] Fogg, A.G. and Abdalla, M.A. (1985) Visible spectropho- tometric determination of cephalosporins and penicillins by indophenol derivatisation with and without alkaline degradation to ammonia. Journal of Pharmaceutical and Biomedical Analysis, 3(4), 315-321. [45] Abdalla, M.A., Fogg, A.G. and Burgess, C. (1982) Selec- tive spectrophotometric determination of cephalosporins by alkaline degradation to hydrogen sulphide and forma- tion of methylene blue. Analyst (London), 107(1273), 213-217. [46] Topic Q2 (R1). (2005) Validation of analytical proce- dures: Text and methodology. International Conference on Harmonisation (ICH). http://www.emea.europa.eu/ pdfs/human/ich/038195en.pdf [47] Heyden, Y.V., Nijhuis, A., Smeyers-Verbeke, J., Vandegin- ste, B.G.M. and Massart D.L. (2004) Guidance for ru- bustness/ruggedness test in method validation. Journal of Pharmaceutical and Biomedical Analysis, 24(5-6), 723- 753. [48] Saleh, G.A., Askal, H., Darwish, I. and El-Shorbagi, A. (2003) Spectroscopic analytical study for the charge- transfer complexation of certain cephalosporins with chloranilic acid. Analytical Sciences, 19(2), 281-287. [49] Harvey, D. (2000) Modern analytical chemistry. McGraw- Hill, Boston, MA. [50] Fogg, A.G., Fayad, N.M., Burgess, C. and McGlynn, A. (1979) Differential pulse polarographic determination of cephalosporins and their degradation products. Analytica Chimica Acta, 108, 205-211. [51] Fogg, A.G., Fayad, N.M. and Burgess, C. (1979) Differ- ential pulse polarographic study of the degradation of cephalexin: Determination of hydrogen sulphide and other degradation products. Analytica Chimica Acta, 110 (1), 107-115. [52] Fogg, A.G. and Martin, M.J. (1981) Differential pulse polarographic determination of degradation products of cephalosporins: Comparison of the degradation of cepha- loglycin in neutral solution with that of cephalexin. Ana- lyst (London), 106(1268), 1213-1217. [53] Fogg, A.G., Abdalla, M.A. and Henriques, H.P. (1982) Titrimetric determination of the yield of sulphide formed by alkaline degradation of cephalosporins. Analyst (Lon- don), 107(1273), 449-452. [54] Abdalla, M.A., Fogg, A.G., Baber, J.G. and Burgess, C. (1983) Air-segmented continuous-flow visible spectro- photometric determination of cephalosporins in drug for- mulations by alkaline degradation to hydrogen sulphide and formation of methylene blue and determination of sulphide-producing impurities including cephalosporins in penicillin samples. Analyst (London), 108(1282), 53-57. [55] Grekas, N. and Calokerinos, A.C. (1990) Continuous flow molecular emission cavity analysis of cepha- losporins by alkaline degradation to sulphide. Analyst (London), 115(5), 613-616. [56] Svehla, G. (1979) Vogel’s textbook of macro and semim- icro qualitative inorganic analysis. 5th Edition, The Chaucer Press, Great Britain. |