 Atmospheric and Climate Sciences, 2012, 2, 441-453 http://dx.doi.org/10.4236/acs.2012.24038 Published Online October 2012 (http://www.SciRP.org/journal/acs) Aerosol Optical Properties at Four Sites in Thailand Serm Janjai1*, Manuel Nunez2, Itsara Masiri1, Rungrat Wattan1, Sumaman Buntoung1, Treenuch Jantarach1, Worrapass Promsen1 1Department of Physics, Faculty of Science, Silpakorn University, Nakhon Pathom, Thailand 2School of Geography and Environment Studies, University of Tasmania, Sandy Bay, Australia Email: *serm@su.ac.th Received June 5, 2012; revised July 8, 2012; accepted July 18, 2012 ABSTRACT This paper presents column integrated aerosol optical properties including aerosol optical depth (AOD), Angstrom wavelength exponent (), single scattering albedo (SSA), and size distribution from ground-based measurements at four sites in Thailand: Chiang Mai (18.78˚N, 98.98˚E), Ubon Ratchathani (15.25˚N, 104.87˚E), Nakhon Pathom (13.82˚N, 100.04˚E), and Songkhla (7.2˚N, 100.60˚E). Results show a marked seasonal trend in AOD at 500 nm for the first three stations, with the monthly average maxima of 0.92, 0.78 and 0.61 for Chiang Mai, Ubon Ratchathani and Nakhon Pathom, respectively. These maxima occur in the dry season (November-April). Minimum values for these stations were recorded during the wet season (May-October). A similar pattern is exhibited in the for the three stations, with maxima in the dry season and minima in the wet season. The lowest SSA values occur at Chiang Mai, which means this station has the highest absorption, with the highest SSA values occurring at Songkhla which corresponds to the lowest absorption. The southern station at Songkhla differs from the other three as it has less local pollution sources and is subjected to the influence of the tropical maritime environment. AOD at Songkhla maintains a low and more constant value year round with the maximum monthly average AOD of 0.27 and the minimum of 0.16. Diurnal changes in AOD at the four stations are discussed and related to various external variables. Keywords: Erosol Optical Properties; Measurements; Sunphotometers; Thailand; Tropical Environments 1. Introduction Aerosols are small solid or liquid airborne mass, or parti- cles, that remain suspended in the air and move with the motion of the air within broad limits [1]. They typically range in size from sub-micron for the smallest size to 10 - 100 microns for the giant particles. Their composition may consist of sulphates, organics, black carbon and dust, or a combination of them [2]. Biomass burning and fossil fuel emissions contribute to the formation of black car- bon aerosols. Sulphate aerosols can be both natural and anthropogenic. Aerosols affect the global radiative bal- ance and they may have a crucial role in affecting re- gional and global climates. Sulphate aerosols predomi- nantly scatter radiation, while organic and black carbon aerosols both absorb and scatter solar radiation. At the regional scale, they may affect atmospheric sta- bility and the rate of photosynthesis by reducing the amount of solar radiation reaching the earth’s surface. At the global scale, they are believed to be efficient scatter- ing agents, cooling the globe and partly counteracting the effect of global warming [3]. The short residence time of aerosols in the atmosphere, in the order of seven days, and the complexity of aerosol impacts on cloud dynamics and regional circulation make modeling of these pro- cesses difficult [2,4]. An estimation of aerosol optical properties from ground based measurements often involves sunphotome- ter measurements of direct and diffuse solar radiation in distinct narrow spectral bands. Relevant optical proper- ties such as aerosol optical depth (AOD), Angstrom ex- ponent ( ), single scattering albedo (SSA), and size dis- tribution can be derived from these measurements [5-8]. These properties are known to be highly variable in space and time, making it difficult to obtain regional climatol- ogy. Due to the importance of aerosol optical properties, a number of studies have been carried out for many parts of the world [9-36]. However, limited works were fo- cused on Southeast Asia [37-39]. In the case of Thailand, a systematic investigation of aerosol optical properties has been undertaken only for the Bangkok area [40]. The information on aerosol optical properties in this tropical country is still very limited, and not sufficient for at- mospheric research and environmental studies. In respo- nse to the demand for this information, we have estab- lished four sunphotometer stations in four main regions *Corresponding author. C opyright © 2012 SciRes. ACS 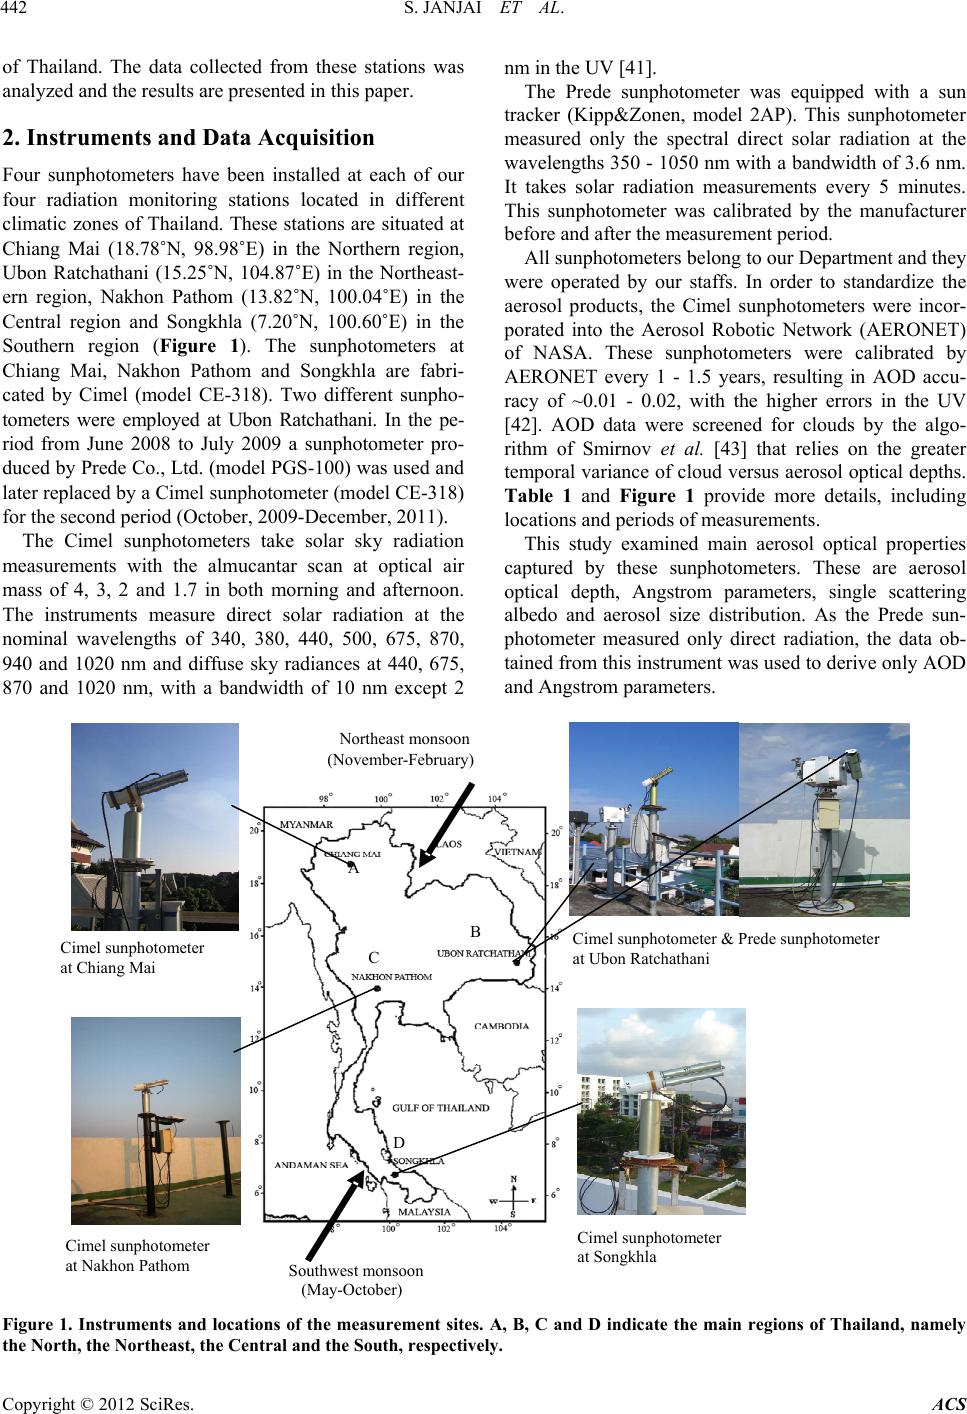 S. JANJAI ET AL. 442 of Thailand. The data collected from these stations was analyzed and the results are presented in this paper. 2. Instruments and Data Acquisition Four sunphotometers have been installed at each of our four radiation monitoring stations located in different climatic zones of Thailand. These stations are situated at Chiang Mai (18.78˚N, 98.98˚E) in the Northern region, Ubon Ratchathani (15.25˚N, 104.87˚E) in the Northeast- ern region, Nakhon Pathom (13.82˚N, 100.04˚E) in the Central region and Songkhla (7.20˚N, 100.60˚E) in the Southern region (Figure 1). The sunphotometers at Chiang Mai, Nakhon Pathom and Songkhla are fabri- cated by Cimel (model CE-318). Two different sunpho- tometers were employed at Ubon Ratchathani. In the pe- riod from June 2008 to July 2009 a sunphotometer pro- duced by Prede Co., Ltd. (model PGS-100) was used and later replaced by a Cimel sunphotometer (model CE-318) for the second period (October, 2009-December, 2011). The Cimel sunphotometers take solar sky radiation measurements with the almucantar scan at optical air mass of 4, 3, 2 and 1.7 in both morning and afternoon. The instruments measure direct solar radiation at the nominal wavelengths of 340, 380, 440, 500, 675, 870, 940 and 1020 nm and diffuse sky radiances at 440, 675, 870 and 1020 nm, with a bandwidth of 10 nm except 2 nm in the UV [41]. The Prede sunphotometer was equipped with a sun tracker (Kipp&Zonen, model 2AP). This sunphotometer measured only the spectral direct solar radiation at the wavelengths 350 - 1050 nm with a bandwidth of 3.6 nm. It takes solar radiation measurements every 5 minutes. This sunphotometer was calibrated by the manufacturer before and after the measurement period. All sunphotometers belong to our Department and they were operated by our staffs. In order to standardize the aerosol products, the Cimel sunphotometers were incor- porated into the Aerosol Robotic Network (AERONET) of NASA. These sunphotometers were calibrated by AERONET every 1 - 1.5 years, resulting in AOD accu- racy of ~0.01 - 0.02, with the higher errors in the UV [42]. AOD data were screened for clouds by the algo- rithm of Smirnov et al. [43] that relies on the greater temporal variance of cloud versus aerosol optical depths. Table 1 and Figure 1 provide more details, including locations and periods of measurements. This study examined main aerosol optical properties captured by these sunphotometers. These are aerosol optical depth, Angstrom parameters, single scattering albedo and aerosol size distribution. As the Prede sun- photometer measured only direct radiation, the data ob- tained from this instrument was used to derive only AOD and Angstrom parameters. (May-October) ortheast monsoon (November-February) A B C D Southwest monsoon Cimel sunphotometer at Chiang Mai Cimel sunphotometer at Nakhon Pathom Cimel sunphotometer at Songkhla Cimel sunphotometer & Prede sunphotometer at Ubon Ratchathani Figure 1. Instruments and locations of the measurement sites. A, B, C and D indicate the main regions of Thailand, namely the North, the Northeast, the Central and the South, respectively. Copyright © 2012 SciRes. ACS 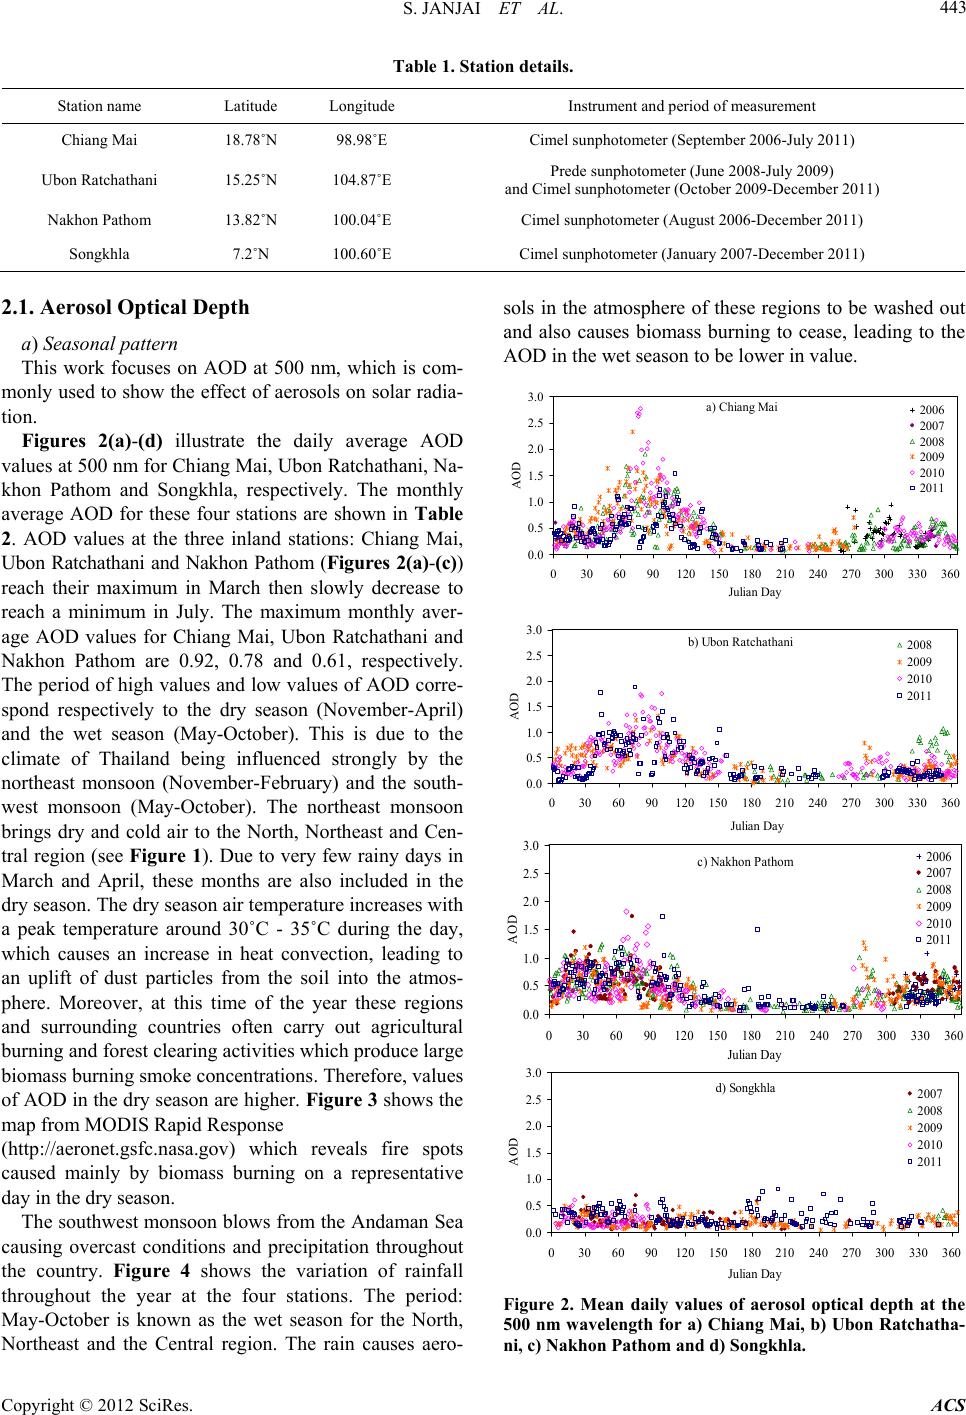 S. JANJAI ET AL. 443 Table 1. Station details. Station name Latitude Longitude Instrument and period of measurement Chiang Mai 18.78˚N 98.98˚E Cimel sunphotometer (September 2006-July 2011) Ubon Ratchathani 15.25˚N 104.87˚E Prede sunphotometer (June 2008-July 2009) and Cimel sunphotometer (October 2009-December 2011) Nakhon Pathom 13.82˚N 100.04˚E Cimel sunphotometer (August 2006-December 2011) Songkhla 7.2˚N 100.60˚E Cimel sunphotometer (January 2007-December 2011) 2.1. Aerosol Optical Depth a) Seasonal pattern This work focuses on AOD at 500 nm, which is com- monly used to show the effect of aerosols on solar radia- tion. Figures 2(a)-(d) illustrate the daily average AOD values at 500 nm for Chiang Mai, Ubon Ratchathani, Na- khon Pathom and Songkhla, respectively. The monthly average AOD for these four stations are shown in Table 2. AOD values at the three inland stations: Chiang Mai, Ubon Ratchathani and Nakhon Pathom (Figures 2(a)-(c)) reach their maximum in March then slowly decrease to reach a minimum in July. The maximum monthly aver- age AOD values for Chiang Mai, Ubon Ratchathani and Nakhon Pathom are 0.92, 0.78 and 0.61, respectively. The period of high values and low values of AOD corre- spond respectively to the dry season (November-April) and the wet season (May-October). This is due to the climate of Thailand being influenced strongly by the northeast monsoon (November-February) and the south- west monsoon (May-October). The northeast monsoon brings dry and cold air to the North, Northeast and Cen- tral region (see Figure 1). Due to very few rainy days in March and April, these months are also included in the dry season. The dry season air temperature increases with a peak temperature around 30˚C - 35˚C during the day, which causes an increase in heat convection, leading to an uplift of dust particles from the soil into the atmos- phere. Moreover, at this time of the year these regions and surrounding countries often carry out agricultural burning and forest clearing activities which produce large biomass burning smoke concentrations. Therefore, values of AOD in the dry season are higher. Figure 3 shows the map from MODIS Rapid Response (http://aeronet.gsfc.nasa.gov) which reveals fire spots caused mainly by biomass burning on a representative day in the dry season. The southwest monsoon blows from the Andaman Sea causing overcast conditions and precipitation throughout the country. Figure 4 shows the variation of rainfall throughout the year at the four stations. The period: May-October is known as the wet season for the North, Northeast and the Central region. The rain causes aero- sols in the atmosphere of these regions to be washed out and also causes biomass burning to cease, leading to the AOD in the wet season to be lower in value. a) Chiang Mai 0.0 0.5 1.0 1.5 2.0 2.5 3.0 0306090120 150 180210 240270 300330 360 Julian Da AOD 2006 2007 2008 2009 2010 2011 b) Ubon Ratchathani 0.0 0.5 1.0 1.5 2.0 2.5 3.0 0306090120 150180 210 240270 300 330 360 Julian Da AOD 2008 2009 2010 2011 c) Nakhon Pathom 0.0 0.5 1.0 1.5 2.0 2.5 3.0 0306090120150 180 210 240 270300 330 360 Julian Da AOD 2006 2007 2008 2009 2010 2011 d) Songkhla 0.0 0.5 1.0 1.5 2.0 2.5 3.0 0306090120 150 180 210240 270 300330 360 Julian Day AOD 2007 2008 2009 2010 2011 Figure 2. Mean daily values of aerosol optical depth at the 500 nm wavelength for a) Chiang Mai, b) Ubon Ratchatha- ni, c) Nakhon Pathom and d) Songkhla. Copyright © 2012 SciRes. ACS  S. JANJAI ET AL. 444 Table 2. Monthly average aerosol optical depth (AOD) at 500 nm for the entire period of records. The maximum val- ues are marked in bold. Month Chiang Mai Ubon Ratchathani Nakhon Pathom Songkhla January February March April May June July August September October November December 0.33 0.51 0.92 0.86 0.36 0.20 0.13 0.13 0.22 0.34 0.30 0.32 0.22 0.59 0.78 0.65 0.36 0.21 0.18 0.16 0.14 0.35 0.21 0.24 0.59 0.58 0.61 0.43 0.31 0.30 0.15 0.13 0.20 0.44 0.40 0.44 0.27 0.23 0.22 0.23 0.25 0.18 0.27 0.18 0.27 0.25 0.16 0.22 Chiang Mai Ubon Ratchathani Nakhon Pathom Songkhla Figure 3. Map from MODIS showing fire spots in the dry season on 7 March, 2010. 0 100 200 300 400 500 600 700 800 900 1000 JanFeb Mar AprMayJunJulAugSepOctNovDec Month Rainfall (mm) Chiang Mai Nakhon Pathom Ubon Ratchathani Songkhla Figure 4. Monthly average of rainfall for the four sites. Contrary to the pattern for the inland stations, the southern station at Songkhla (Figure 2(d)) maintains a low and more constant value of AOD all year round, with the maximum monthly average of 0.27 and the minimum of 0.16. It may be explained by the geography of the re- gion which consists of a thin peninsula along the entire length of southern Thailand, bordered on the west by the Andaman Sea and the east by the Gulf of Thailand (see Figure 1). This leads to an influx of maritime aerosols carried by the northeast and southwest monsoons. In ad- dition, the region also has longer period of the wet season, which lasts until December due to the northeast monsoon which brings moisture from the Gulf of Thailand to this region. Consequently, the rain continuously removes aerosols from the atmosphere during the wet season. Ad- ditionally, this site is far to the south of the primary bio- mass burning regions and it is unusual for the regional wind systems to transport the aerosols to this far south. b) Diurnal pattern We used the observational data to compute the diurnal variation of aerosol optical depth as a percentage depar- ture from the daily mean during 8:00 - 16:00 h. The method was similar to that used by Smirnov et al. [44] and Peterson et al. [45]. Hourly departures from the daily mean were calculated on a daily basis and further aver- aged for each hour. The averaging periods for all stations were performed over the entire years from 2006 to 2011 for Chiang Mai and Nakhon Pathom, 2009 to 2011 for Ubon Ratchathani and 2007 to 2011 for Songkhla. Diurnal variations at Chiang Mai (Figu re 5(a)) feature peak values in the morning between 9:00 to 10:00 fol- lowed by a slight decrease in optical depths. There are several possible reasons for this pattern. Mid-morning hours are usually associated with the break-up of the daytime inversion which is featured in south-east Asia [46,47]. This process may lead to rapid convection and ejection of surface dust into the atmosphere at this time. At later times concentrations may be governed by the pattern of deposition vs ejection and is probably de- pendent on the temperature structure and degree of tur- bulence. A second possibility is that the departures are related to motor vehicle emissions. As Chiang Mai is the largest city in the North of Thailand with a population of about 1.6 million inhabitants a correspondingly large number of vehicles are found on its roadways for trans- portation of goods, tourists and inhabitants. This leads to the AOD in rush hours to be higher in value as the greater number of vehicles at these busy times create higher emissions. The results for Ubon Ratchathani station is shown in Figure 5(b). The AOD values is low in the morning with slight decreases throughout the day until a slight increase again in the late afternoon. Ubon Ratchathani is a sub- rural city located in the Northeast of Thailand. The in- Copyright © 2012 SciRes. ACS 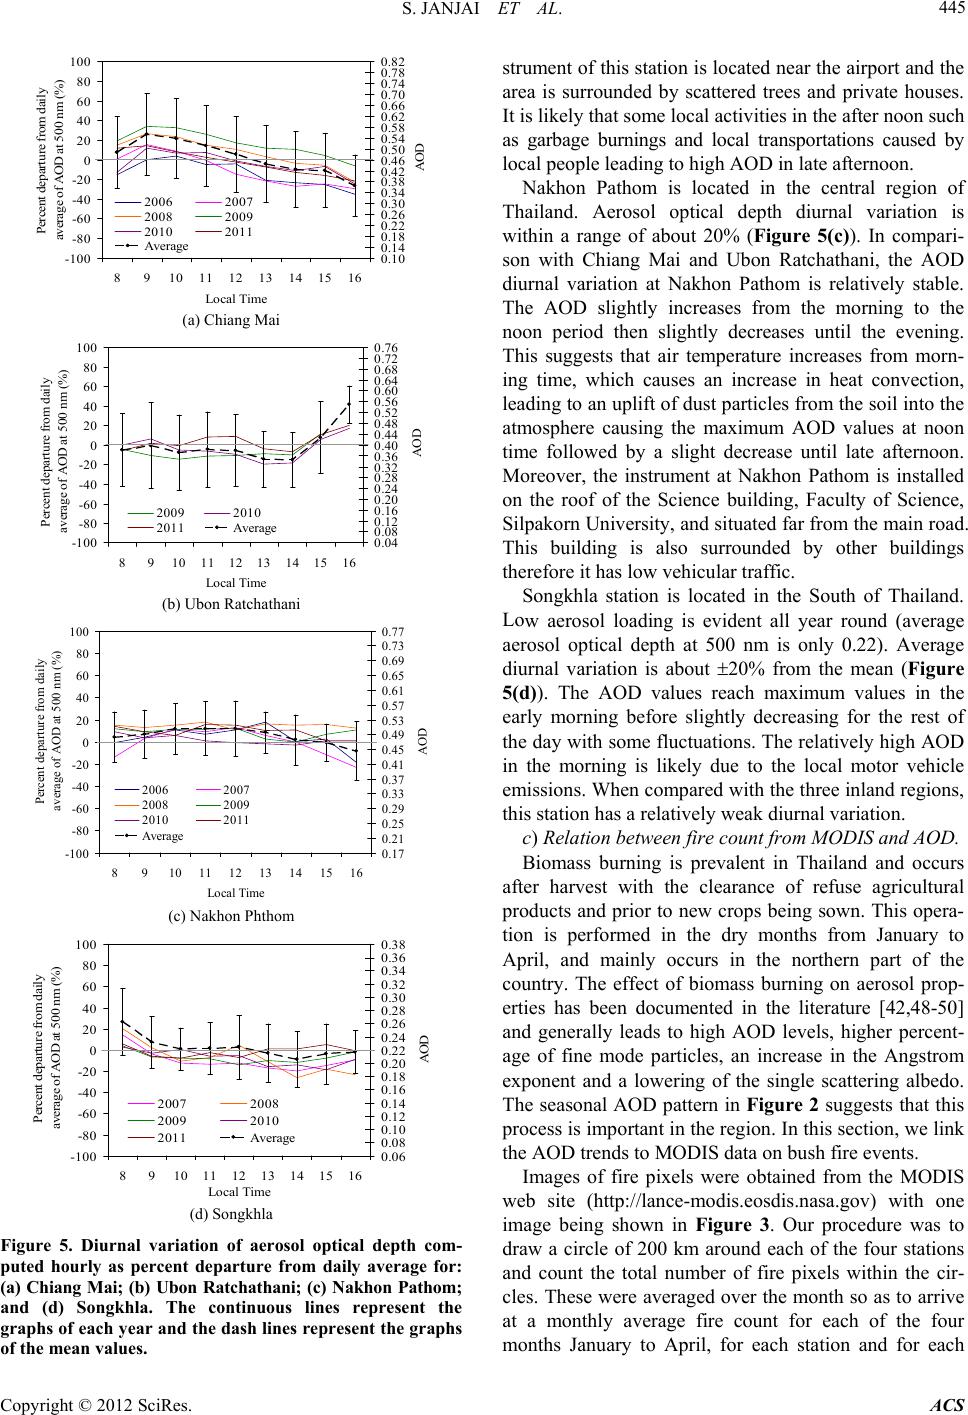 S. JANJAI ET AL. 445 -10 0 -80 -60 -40 -20 0 20 40 60 80 100 891011 12 13 1415 16 Local Time Percent eparture rom a y average of AOD at 500 nm (% 0.10 0.14 0.18 0.22 0.26 0.30 0.34 0.38 0.42 0.46 0.50 0.54 0.58 0.62 0.66 0.70 0.74 0.78 0.82 AOD 2006 2007 2008 2009 2010 2011 Ave ra e (a) Chiang Mai (a) Chiang Mai -10 0 -80 -60 -40 -20 0 20 40 60 80 100 891011 12 131415 16 Percent departure from daily average of AOD at 500 nm (% 0.04 0.08 0.12 0.16 0.20 0.24 0.28 0.32 0.36 0.40 0.44 0.48 0.52 0.56 0.60 0.64 0.68 0.72 0.76 AOD 2009 2010 2011 Avera e (b) Ubon Ratchathani (b) Ubon Ratchathani -100 -80 -60 -40 -20 0 20 40 60 80 100 891011 12 13 1415 16 Local Time Percent departure from daily average of AOD at 500 nm (%) 0.17 0.21 0.25 0.29 0.33 0.37 0.41 0.45 0.49 0.53 0.57 0.61 0.65 0.69 0.73 0.77 AOD 2006 2007 2008 2009 2010 2011 Avera e (c) Nakhon Pathom (c) Nakhon Phthom -100 -80 -60 -40 -20 0 20 40 60 80 100 8910 11 12 13 141516 Local Time Percent departure from daily average of AOD at 500 nm (% 0.06 0.08 0.10 0.12 0.14 0.16 0.18 0.20 0.22 0.24 0.26 0.28 0.30 0.32 0.34 0.36 0.38 AOD 2007 2008 2009 2010 2011 Average (d) Songkhla (d) Songkhla Figure 5. Diurnal variation of aerosol optical depth com- puted hourly as percent departure from daily average for: (a) Chiang Mai; (b) Ubon Ratchathani; (c) Nakhon Pathom; and (d) Songkhla. The continuous lines represent the graphs of each year and the dash line s represent the graphs strument of this stat of the mean values. ion is located near the airport and the n of Th outh of Thailand. Lo AOD. af DIS w area is surrounded by scattered trees and private houses. It is likely that some local activities in the after noon such as garbage burnings and local transportations caused by local people leading to high AOD in late afternoon. Nakhon Pathom is located in the central regio ailand. Aerosol optical depth diurnal variation is within a range of about 20% (Figure 5(c)). In compari- son with Chiang Mai and Ubon Ratchathani, the AOD diurnal variation at Nakhon Pathom is relatively stable. The AOD slightly increases from the morning to the noon period then slightly decreases until the evening. This suggests that air temperature increases from morn- ing time, which causes an increase in heat convection, leading to an uplift of dust particles from the soil into the atmosphere causing the maximum AOD values at noon time followed by a slight decrease until late afternoon. Moreover, the instrument at Nakhon Pathom is installed on the roof of the Science building, Faculty of Science, Silpakorn University, and situated far from the main road. This building is also surrounded by other buildings therefore it has low vehicular traffic. Songkhla station is located in the S w aerosol loading is evident all year round (average aerosol optical depth at 500 nm is only 0.22). Average diurnal variation is about 20% from the mean (Figure 5(d)). The AOD values reach maximum values in the early morning before slightly decreasing for the rest of the day with some fluctuations. The relatively high AOD in the morning is likely due to the local motor vehicle emissions. When compared with the three inland regions, this station has a relatively weak diurnal variation. c) Relation between fire count from MODIS and Biomass burning is prevalent in Thailand and occurs ter harvest with the clearance of refuse agricultural products and prior to new crops being sown. This opera- tion is performed in the dry months from January to April, and mainly occurs in the northern part of the country. The effect of biomass burning on aerosol prop- erties has been documented in the literature [42,48-50] and generally leads to high AOD levels, higher percent- age of fine mode particles, an increase in the Angstrom exponent and a lowering of the single scattering albedo. The seasonal AOD pattern in Figure 2 suggests that this process is important in the region. In this section, we link the AOD trends to MODIS data on bush fire events. Images of fire pixels were obtained from the MO eb site (http://lance-modis.eosdis.nasa.gov) with one image being shown in Figure 3. Our procedure was to draw a circle of 200 km around each of the four stations and count the total number of fire pixels within the cir- cles. These were averaged over the month so as to arrive at a monthly average fire count for each of the four months January to April, for each station and for each Copyright © 2012 SciRes. ACS 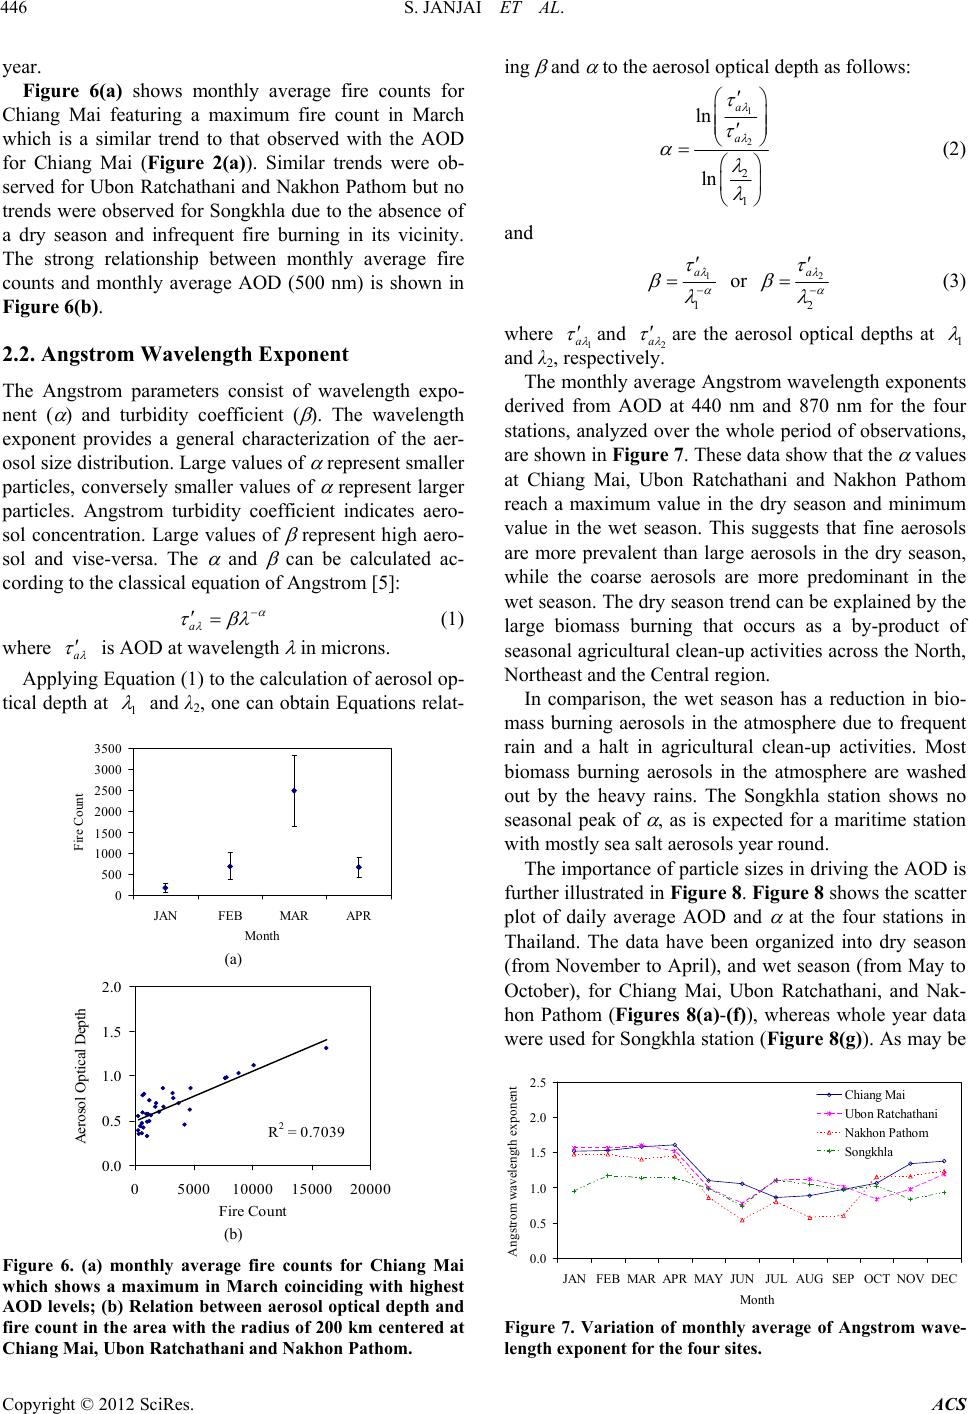 S. JANJAI ET AL. 446 year. Figure 6(a) shows monthly average fire counts for C 2.2. Angstrom Wavelength Exponent length expo- hiang Mai featuring a maximum fire count in March which is a similar trend to that observed with the AOD for Chiang Mai (Figure 2(a)). Similar trends were ob- served for Ubon Ratchathani and Nakhon Pathom but no trends were observed for Songkhla due to the absence of a dry season and infrequent fire burning in its vicinity. The strong relationship between monthly average fire counts and monthly average AOD (500 nm) is shown in Figure 6(b). The Angstrom parameters consist of wave nent ( ) and turbidity coefficient ( ). The wavelength exponent provides a general characterization of the aer- osol size distribution. Large values of represent smaller particles, conversely smaller values of represent larger particles. Angstrom turbidity coefficient indicates aero- sol concentration. Large values of represent high aero- sol and vise-versa. The and can be calculated ac- cording to the classical equation of Angstrom [5]: a (1) where a is AOD at wavelengt yinosol op- tic h in microns. Applg Equation (1) to the calculation of aer al depth at 1 and λ2, one can obtain Equations relat- 0 500 1000 1500 2000 2500 3000 3500 JANFEB MAR APR Mo n th Fire Count a) (a) R 2 = 0.7039 0.0 0.5 1.0 1.5 2.0 0500010000 15000 20000 Fire Count Aerosol Optical Dept b) (b) Figure 6. (a) monthly averaire counts for Chiang Mai ge f which shows a maximum in March coinciding with highest AOD levels; (b) Relation between aerosol optical depth and fire count in the area with the radius of 200 km centered at Chiang Mai, Ubon Ratchathani and Nakhon Pathom. ing and to the aerosol optical depth as follows: 1 ln a 2 2 1 ln a (2) and 1 1 a or 2 2 a (3) where 1 a and 2 a are thsol opte aeroical depths at 1 and λ mon verts t 440 nm and 870 nm for the four st sphere due to frequent ra ows the scatter pl 2 The thly aage Angstrom wavelength exponen derived from AOD a , respectively. ations, analyzed over the whole period of observations, are shown in Figure 7. These data show that the values at Chiang Mai, Ubon Ratchathani and Nakhon Pathom reach a maximum value in the dry season and minimum value in the wet season. This suggests that fine aerosols are more prevalent than large aerosols in the dry season, while the coarse aerosols are more predominant in the wet season. The dry season trend can be explained by the large biomass burning that occurs as a by-product of seasonal agricultural clean-up activities across the North, Northeast and the Central region. In comparison, the wet season has a reduction in bio- mass burning aerosols in the atmo in and a halt in agricultural clean-up activities. Most biomass burning aerosols in the atmosphere are washed out by the heavy rains. The Songkhla station shows no seasonal peak of , as is expected for a maritime station with mostly sea salt aerosols year round. The importance of particle sizes in driving the AOD is further illustrated in Figure 8. Figure 8 sh ot of daily average AOD and at the four stations in Thailand. The data have been organized into dry season (from November to April), and wet season (from May to October), for Chiang Mai, Ubon Ratchathani, and Nak- hon Pathom (Figures 8(a)-(f)), whereas whole year data were used for Songkhla station (Figure 8(g)). As may be 0.0 0.5 1.0 1.5 2.0 2.5 JANFEB MAR APR MAY JUNJULAUGSEPOCT NOV DEC M n h Angstrom wavelength exponent Chiang Mai Ubon Ratchathani Nakhon Pathom So n khl a Figure 7. Variation of monthly average of Angstrom wave length exponent for the four sites. - Copyright © 2012 SciRes. ACS 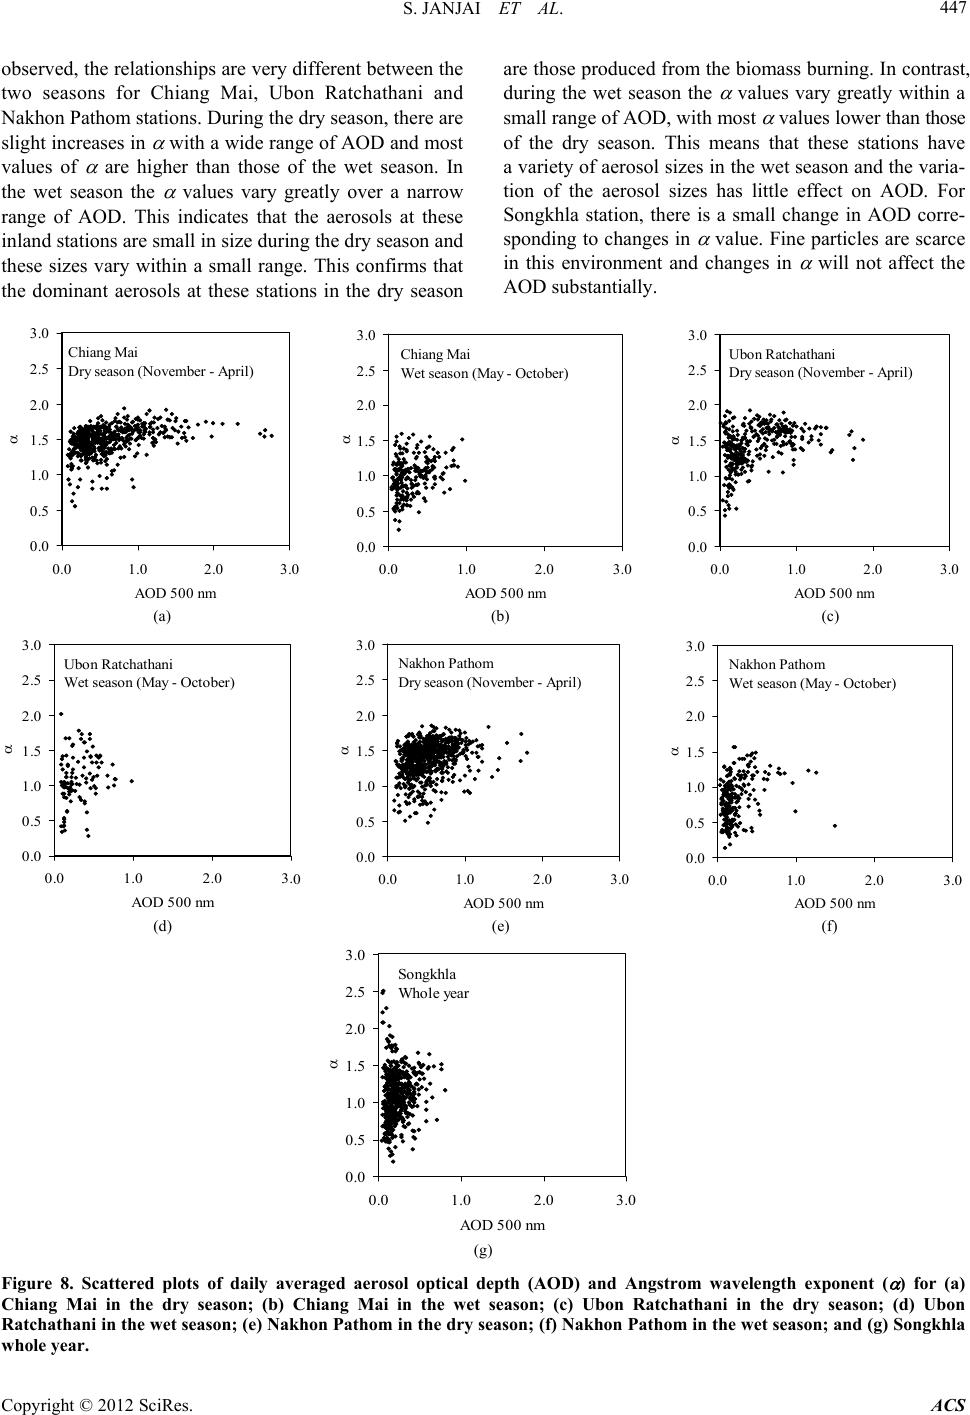 S. JANJAI ET AL. Copyright © 2012 SciRes. ACS 447 observed, the relationships are very different between the two seasons for Chiang Mai, Ubon Ratchathani and Nakhon Pathom stations. During the dry season, there are slight increases in with a wide range of AOD and most values of are higher than those of the wet season. In the wet season the values vary greatly over a narrow range of AOD. This indicates that the aerosols at these inland stations are small in size during the dry season and these sizes vary within a small range. This confirms that the dominant aerosols at these stations in the dry season are those produced from the biomass burning. In contrast, during the wet season the values vary greatly within a small range of AOD, with most values lower than those of the dry season. This means that these stations have a variety of aerosol sizes in the wet season and the varia- tion of the aerosol sizes has little effect on AOD. For Songkhla station, there is a small change in AOD corre- sponding to changes in value. Fine particles are scarce in this environment and changes in will not affect the AOD substantially. 0.0 0.5 1.0 1.5 2.0 2.5 3.0 0.01.0 2.03.0 AOD 500 n Chiang Mai Dry season (November - April) 0.0 0.5 1.0 1.5 2.0 2.5 3.0 0.0 1.0 2.0 3.0 AOD 500 n Chiang Mai Wet season (May - October) 0.0 0.5 1.0 1.5 2.0 2.5 3.0 0.0 1.0 2.0 3.0 AOD 500 n Ubon Ratchathani Dry season (November - April) (a) (b) (c) 0.0 0.5 1.0 1.5 2.0 2.5 3.0 0.01.02.03. AOD 500 n Ubon Ratchathani Wet season (May - October) 0.0 0.5 1.0 1.5 2.0 2.5 3.0 0.01.02.03.0 AOD 500 n akhon Patho Dry season (November - April) 0.0 0.5 1.0 1.5 2.0 2.5 3.0 0.0 1.0 2.0 3.0 AOD 500 n akhon Patho Wet season (May - October) (d) (e) (f) 0.0 0.5 1.0 1.5 2.0 2.5 3.0 0 .01.02.03.0 AOD 500 n So ngkhla Whole year (g) Figure 8. Scattered plots of daily averaged aerosol optical th (AOD) and Angstrom wavelength exponent ( ) for (a) dep Chiang Mai in the dry season; (b) Chiang Mai in the wet season; (c) Ubon Ratchathani in the dry season; (d) Ubon Ratchathani in the wet season; (e) Nakhon Pathom in the dry season; (f) Nakhon Pathom in the wet season; and (g) Songkhla who le year. 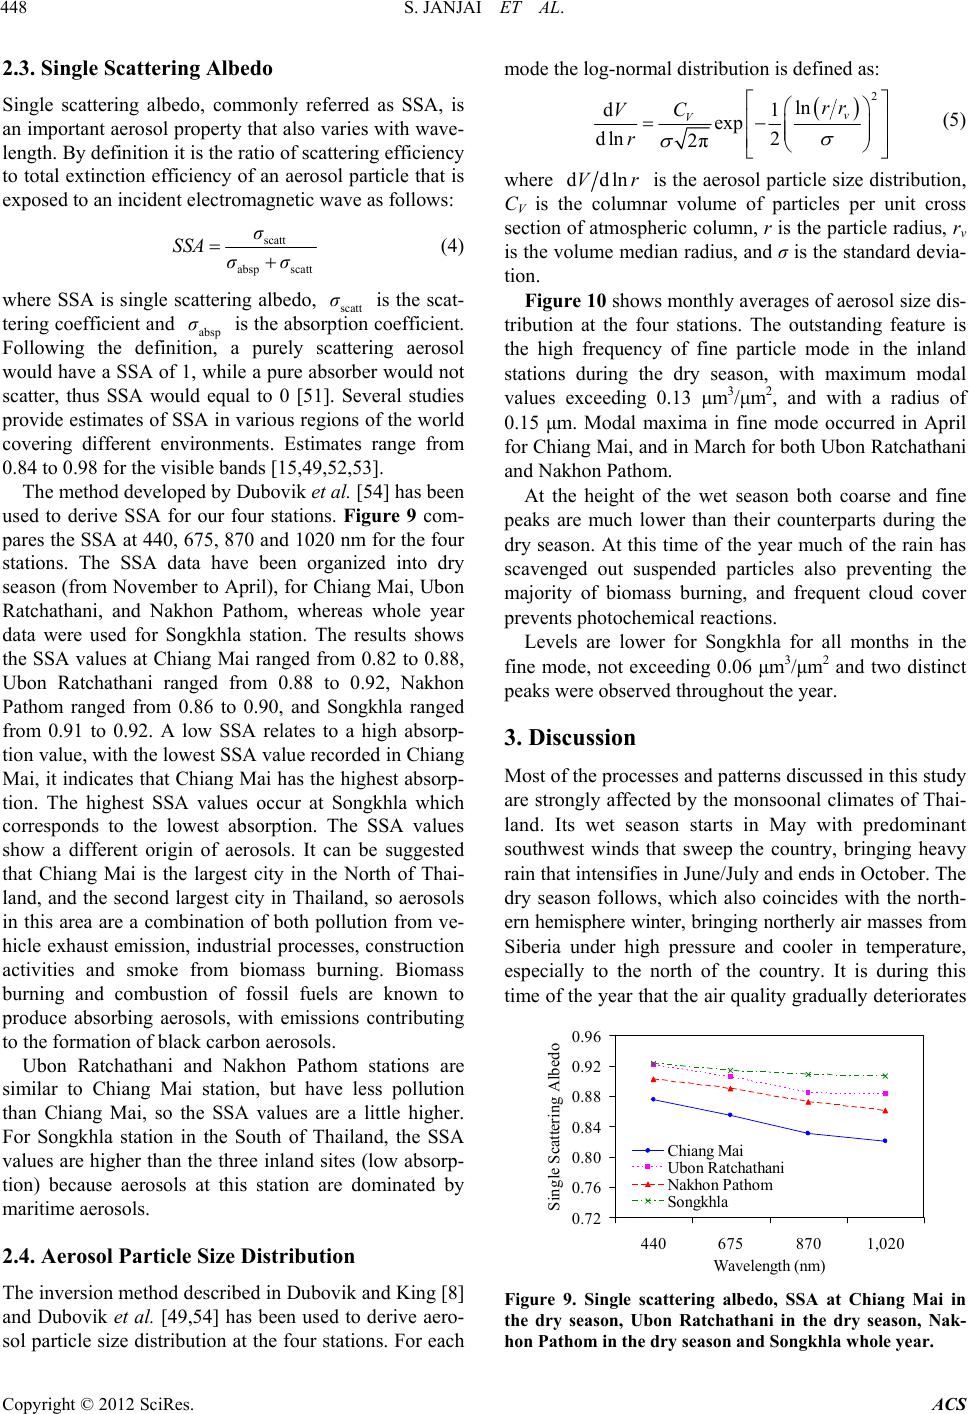 S. JANJAI ET AL. 448 2.3. Single Scattering Albedo ly referred as SSA, is Single scattering albedo, common an important aerosol property that also varies with wave- length. By definition it is the ratio of scattering efficiency to total extinction efficiency of an aerosol particle that is exposed to an incident electromagnetic wave as follows: scatt σ SSA (4) absp scatt σσ where SSA is single scattering albedo, is the scat- icle Size Distribution nd King [8] mode the log-normal distribution is defined as: scatt σ tering coefficient and absp σ is the absorption coefficient. Following the definitin, a purely scattering aerosol would have a SSA of 1, while a pure absorber would not scatter, thus SSA would equal to 0 [51]. Several studies provide estimates of SSA in various regions of the world covering different environments. Estimates range from 0.84 to 0.98 for the visible bands [15,49,52,53]. The method developed by Dubovik et al. [54] has been us o ed to derive SSA for our four stations. Figure 9 com- pares the SSA at 440, 675, 870 and 1020 nm for the four stations. The SSA data have been organized into dry season (from November to April), for Chiang Mai, Ubon Ratchathani, and Nakhon Pathom, whereas whole year data were used for Songkhla station. The results shows the SSA values at Chiang Mai ranged from 0.82 to 0.88, Ubon Ratchathani ranged from 0.88 to 0.92, Nakhon Pathom ranged from 0.86 to 0.90, and Songkhla ranged from 0.91 to 0.92. A low SSA relates to a high absorp- tion value, with the lowest SSA value recorded in Chiang Mai, it indicates that Chiang Mai has the highest absorp- tion. The highest SSA values occur at Songkhla which corresponds to the lowest absorption. The SSA values show a different origin of aerosols. It can be suggested that Chiang Mai is the largest city in the North of Thai- land, and the second largest city in Thailand, so aerosols in this area are a combination of both pollution from ve- hicle exhaust emission, industrial processes, construction activities and smoke from biomass burning. Biomass burning and combustion of fossil fuels are known to produce absorbing aerosols, with emissions contributing to the formation of black carbon aerosols. Ubon Ratchathani and Nakhon Pathom stations are similar to Chiang Mai station, but have less pollution than Chiang Mai, so the SSA values are a little higher. For Songkhla station in the South of Thailand, the SSA values are higher than the three inland sites (low absorp- tion) because aerosols at this station are dominated by maritime aerosols. 2.4. Aerosol Part The inversion method described in Dubovik a and Dubovik et al. [49,54] has been used to derive aero- sol particle size distribution at the four stations. For each 2 ln d1 exp dln 2 2π v Vrr C V r (5) ddlnVr e column where is the aerosol particle size distribution, CV is thar volume of particles per u section of atmospheric column, r is the particle radius, rv olume me sc d in this study by the monsoonal climates of Thai- son starts in May with predominant nit cross is the vdian radius, and σ is the standard devia- tion. Figure 10 shows monthly averages of aerosol size dis- tribution at the four stations. The outstanding feature is the high frequency of fine particle mode in the inland stations during the dry season, with maximum modal values exceeding 0.13 μm3/μm2, and with a radius of 0.15 μm. Modal maxima in fine mode occurred in April for Chiang Mai, and in March for both Ubon Ratchathani and Nakhon Pathom. At the height of the wet season both coarse and fine peaks are much lower than their counterparts during the dry season. At this time of the year much of the rain has avenged out suspended particles also preventing the majority of biomass burning, and frequent cloud cover prevents photochemical reactions. Levels are lower for Songkhla for all months in the fine mode, not exceeding 0.06 μm3/μm2 and two distinct peaks were observed throughout the year. 3. Discussion Most of the processes and patterns discusse are strongly affected land. Its wet sea southwest winds that sweep the country, bringing heavy rain that intensifies in June/July and ends in October. The dry season follows, which also coincides with the north- ern hemisphere winter, bringing northerly air masses from Siberia under high pressure and cooler in temperature, especially to the north of the country. It is during this time of the year that the air quality gradually deteriorates 0.72 0.76 0.80 0.84 0.88 0.92 0.96 Albedo 440 6758701,020 Wavelength (nm) Single Scattering Chiang Mai Ubon Ratchathani Nakhon Pathom Son khla Figure 9. Single scattering albedo, SSA at Chiang Mai in the dry season, Ubon Ratchathani in the dry season, Nak- hon Pathom in the dry season and Songkhla w hole yea r. Copyright © 2012 SciRes. ACS 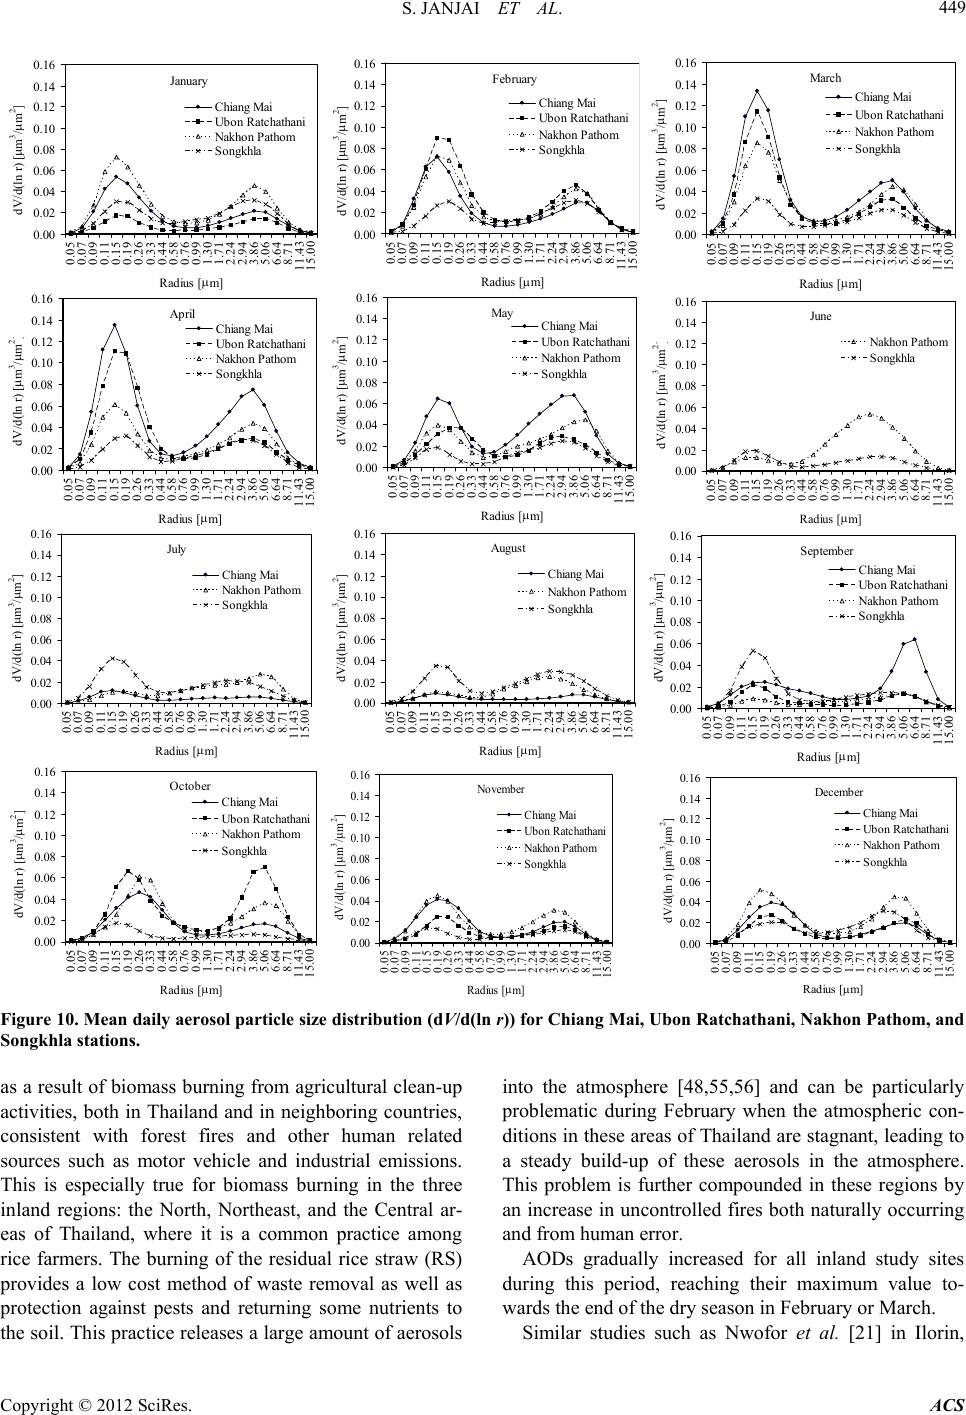 S. JANJAI ET AL. 449 0.00 0.02 0.04 0.06 0.08 0.10 0.12 0.14 0.16 0.05 0.07 0.09 0.11 0.15 0.19 0.26 0.33 0.44 0.58 0.76 0.99 1.30 1.71 2.24 2.94 3.86 5.06 6.64 8.71 11.43 15.00 Radius [m] dV/d(ln r) [m 3 /m 2 Chiang Mai Ubon Ratchathani Nakhon Pathom Son khla Januar y 0.00 0.02 0.04 0.06 0.08 0.10 0.12 0.14 0.16 0.05 0.07 0.09 0.11 0.15 0.19 0.26 0.33 0.44 0.58 0.76 0.99 1.30 1.71 2.24 2.94 3.86 5.06 6.64 8.71 11.43 15.00 dV/d(ln r) [m3/m2 Radius [m] Chiang Mai Ubon Ratchathani Nakhon Pathom Son khla F ebruary 0.00 0.02 0.04 0.06 0.08 0.10 0.12 0.14 0.16 0.05 0.07 0.09 0.11 0.15 0.19 0.26 0.33 0.44 0.58 0.76 0.99 1.30 1.71 2.24 2.94 3.86 5.06 6.64 8.71 11.43 15.00 Radius m dV/d(ln r) [m 3 /m 2 Chiang Mai Ubon Ratchathani Nakhon Pathom S ongkhla Mar ch 0.00 0.02 0.04 0.06 0.08 0.10 0.12 0.14 0.16 0.05 0.07 0.09 0.11 0.15 0.19 0.26 0.33 0.44 0.58 0.76 0.99 1.30 1.71 2.24 2.94 3.86 5.06 6.64 8.71 11.43 15.00 Radius [m] dV/d(ln r) [m 3 /m 2 Chiang Mai Ubon Ratchathani Nakhon Pathom Son khla April 0.00 0.02 0.04 0.06 0.08 0.10 0.12 0.14 0.16 0.05 0.07 0.09 0.11 0.15 0.19 0.26 0.33 0.44 0.58 0.76 0.99 1.30 1.71 2.24 2.94 3.86 5.06 6.64 8.71 11.43 15.00 Radius [m] dV/d(ln r) [m 3 /m 2 Chiang Mai Ubon Ratchathani Nakhon Pathom S ongkhla May 0.00 0.02 0.04 0.06 0.08 0.10 0.12 0.14 0.16 0.05 0.07 0.09 0.11 0.15 0.19 0.26 0.33 0.44 0.58 0.76 0.99 1.30 1.71 2.24 2.94 3.86 5.06 6.64 8.71 11.43 15.00 Radius [m] dV/d(ln r) [m 3 /m 2 Nakhon Pathom S ongkhla June 0.00 0.02 0.04 0.06 0.08 0.10 0.12 0.14 0.16 0.05 0.07 0.09 0.11 0.15 0.19 0.26 0.33 0.44 0.58 0.76 0.99 1.30 1.71 2.24 2.94 3.86 5.06 6.64 8.71 11.43 15.00 Radius [m] dV/d(ln r) [m 3 /m 2 Chiang Mai Nakhon Pathom S ongkhla July 0.0 0 0.0 2 0.0 4 0.0 6 0.0 8 0.1 0 0.1 2 0.1 4 0.1 6 0.05 0.07 0.09 0.11 0.15 0.19 0.26 0.33 0.44 0.58 0.76 0.99 1.30 1.71 2.24 2.94 3.86 5.06 6.64 8.71 11.43 15.00 Radius [m] dV/d(ln r) [m 3 /m 2 Chiang Mai Nakhon Pathom S ongkh la August 0.00 0.02 0.04 0.06 0.08 0.10 0.12 0.14 0.16 0.05 0.07 0.09 0.11 0.15 0.19 0.26 0.33 0.44 0.58 0.76 0.99 1.30 1.71 2.24 2.94 3.86 5.06 6.64 8.71 11.43 15.00 Radius [m] dV/d(ln r) [m 3 /m 2 Chiang Mai Ubon Ratchathani Nakhon Pathom S ongkhla September 0. 00 0. 02 0. 04 0. 06 0. 08 0. 10 0. 12 0. 14 0. 16 0.05 0.07 0.09 0.11 0.15 0.19 0.26 0.33 0.44 0.58 0.76 0.99 1.30 1.71 2.24 2.94 3.86 5.06 6.64 8.71 11.43 15.00 Radius [m] dV/d(ln r) [m 3 /m 2 Chiang Mai Ubon Ratchathani Nakhon Pathom Son khla October 0.00 0.02 0.04 0.06 0.08 0.10 0.12 0.14 0.16 0.05 0.07 0.09 0.11 0.15 0.19 0.26 0.33 0.44 0.58 0.76 0.99 1.30 1.71 2.24 2.94 3.86 5.06 6.64 8.71 11.43 15.00 Radius [m] dV/d(ln r) [m 3 /m 2 Chiang Mai Ubon Ratchathani Nakhon Pathom Songkhla 0.00 0.02 0.04 0.06 0.08 0.10 0.12 0.14 0.16 0.05 0.07 0.09 0.11 0.15 0.19 0.26 0.33 0.44 0.58 0.76 0.99 1.30 1.71 2.24 2.94 3.86 5.06 6.64 8.71 11.43 15.00 Radius [m] dV/d(ln r) [m 3 /m 2 Chiang Mai Ubon Ratchathani Nakhon Pathom S ongkhla December ovember Figure 10. Mean daily aerosol particle siztribution (dV/d(ln r)) for Chiang Mai, Ubon Ratchathani, Nakhon Pathom, an Songkhla stations. ass burning from agricultural clean-up into the atmosphere [48,55,56] and can be particularly Nwofor et al. [21] in Ilorin, e disd as a result of biom activities, both in Thailand and in neighboring countries, consistent with forest fires and other human related sources such as motor vehicle and industrial emissions. This is especially true for biomass burning in the three inland regions: the North, Northeast, and the Central ar- eas of Thailand, where it is a common practice among rice farmers. The burning of the residual rice straw (RS) provides a low cost method of waste removal as well as protection against pests and returning some nutrients to the soil. This practice releases a large amount of aerosols problematic during February when the atmospheric con- ditions in these areas of Thailand are stagnant, leading to a steady build-up of these aerosols in the atmosphere. This problem is further compounded in these regions by an increase in uncontrolled fires both naturally occurring and from human error. AODs gradually increased for all inland study sites during this period, reaching their maximum value to- wards the end of the dry season in February or March. Similar studies such as Copyright © 2012 SciRes. ACS  S. JANJAI ET AL. 450 Ni r the fin 9]. Th il or March for the three inland stations. lower th r positioned at four Thailand. They are located in the try (Chiang Mai), in the Northeast r environment, the AODs and α values ar erosols, but also involves synoptic an geria, Ogunjobi et al. [25] in West Africa and Pinker et al. [57] in southwestern US also reported summer maximum of AOD in late spring and summer. Most of the increase in AODs for the three inland sta- tions appears to be dominated by fine particles modes as evidenced by the high seasonal range in monthly α and the large changes in the modal maximum values fo e particle mode. Maximum α values are largest in March, at the end of the dry season, correlating closely to the monthly highest AOD, and are lowest in June or July during the wet season. These maximum monthly esti- mates of α (1.68 - 1.52) are at the top when compared to similar studies, such as Pinker et al. [57] in southwestern United States (α = 1.60), Masmoudi et al. [6] in north Africa (α = 0.88), Nwofor et al. [21] in Ilorin, Nigeria (α = 0.70) Ogunjobi et al. [25] in five west African sites (α = 1.07-0.93 for urban pollution), Eck et al. [58] in south- ern Africa (α > 1.80 for biomass burning season) and Schafer et al. [50] in Amazonia (α > 1.80 for smoke). The lowest SSA (highest absorption) was observed at 440, 675, 870 and 1,020 nm at Chiang Mai (SSA ~0.88 - 0.82) which is similar to the African savanna, Zambia region (SSA ~0.88 - 0.78) studies by Dubovik et al. [4 e SSA values for Nakhon Pathom (SSA ~0.90 - 0.86) and Ubon Ratchathani (SSA ~0.92 - 0.88) are very simi- lar to other biomass burning regions, such as Dubovik et al. [49] in South American cerrado (SSA ~0.91 - 0.85). In comparison with other biomass regions, the SSA measured at Chiang Mai, Ubon Ratchathani, and Nakhon Pathom are not very high. For example, the SSA at 440, 670, 870 and 1020 nm in the Amazonian forest of Brazil has a range of 0.92 - 0.90 and Boreal forests of the United States and Canada have a range of 0.94 - 0.91 [49]. This suggests that the values of SSA depend on the type and origin of the smoke particles. For example, in the South American cerrado regions smoke originates from the combustion of cerrado vegetation and agricul- tural pasture, while in both Brazil and Africa smoke originates from savanna ecosystems [49]. For the three inland regions of Thailand there is a combination of smo- ke from forest fires and open burning of agricultural residues such as paddy fields during the dry season as well as pollution originating from traffic and anthropo- genic activities. This leads to the values of SSA varying according to the amount of each type of smoke presented. For Songkhla station in the South of Thailand the SSA values are higher than Chiang Mai, Ubon Ratchathani, and Nakhon Pathom because aerosols at this station are dominated by maritime aerosols. In comparison with other oceanic regions, the SSA measured at Songkhla is lower in value (SSA ~0.92 - 0.91) such as in Lanai, Ha- waii, which has a range of 0.98 - 0.97 [49]. This can be explained by biomass burning in Indonesia which causes a smoke haze to reach and affect the South of Thailand [59-62]. In agreement with the seasonal trends in α, the fine mode dominates the pattern of the aerosol size distribu- tion. Modal maximum values in the fine mode are high- est in Apr Songkhla shows different patterns from the rest of the stations as it is a maritime station with no distinct dry season. As a result, there is no pronounced maximum in AOD during the dry season, AOD and α are much an the other three stations, and fine particles do not dominate the AOD. It is also interesting to note the sea- sonal pattern of SSA is related to the higher scatter and lack of a distinct seasonal minimum. 4. Conclusions This study has examined data from four Cimel sunpho- tometers and one Prede sunphotomete different regions in North of the coun (Ubon Ratchathani), the Central part (Nakhon Pathom) and the South (Songkhla). The AOD, Angstrom wave- length exponent, SSA and aerosol size distribution over a time span of about four to five years have been derived from data obtained from these instruments. Results show that for the three inland stations (Chiang Mai, Ubon Ratchathani, and Nakhon Pathom), all optical data are strongly influenced by the wet/dry climates of the region. AODs reach their maximum towards the end of the dry season in March or April, and their minimum in the wet season from June to September. A similar pattern is ob- served for the α with highest values in February or March and lowest in June to September. Furthermore, the AOD is governed by the fine particle mode, as evidenced by the strong dependence of AOD on α for high values of AOD and the large seasonal range in the modal maxima of fine particles. Different statistics were obtained for the maritime southern station of Songkhla. It is not subject to the dry season influences nor significant biomass burning and it is a much cleane e lower and do not show seasonal trends. Similarly, the SSA does not exhibit a winter minima as does for the other three stations. These results point to the variability in aerosol proper- ties that exist in the tropical environment of Thailand. This variability stems not only from anthropogenic and natural emissions of a d regional weather patterns which are influenced by the landscape and topography. Eventually, climatologies need to be developed which will map this variability and its relationship to the local geography. Until that time, it is important to maintain and to expand sunphotometer networks, such as the one described here, which provide much needed data. Copyright © 2012 SciRes. ACS  S. JANJAI ET AL. 451 5. Acknowledgements The authors would like to thank the Thailand Research Fund for providing financial support to this research work. The authors would also like to thank Dr. Brent [2] V. Ramanathan, P. J. Crutzen, J. Lelieveld, A. P. Mitra, D. Althausen, J. AOcean Experiment: An Integratede Forcing and Ef- Holben for valuable advice. REFERENCES [1] M. Iqbal, “An Introduction to Solar Radiation,” Academic, New York, 1983. nderson, et al., “Indian Analysis of the Climat fects of the Great Indo-Asian Haze,” Journal Of Geophy- sical Research, Vol. 106, No. D22, 2001, pp. 28371- 28398. doi:10.1029/2001JD900133 [3] J. Xin, S. Wang, Y. Wang, J. Yuan, W. Zhang and Y. Sun, “Optical Properties and Size Distribution of Aerosols over the Tengger Desert in Northern China,” Atmospheric Environment, Vol. 39, No. 32, 2005, pp. 5971-5978. doi:10.1016/j.atmosenv.2005.06.027 [4] Y. J. Kaufman and I. Koren, “Smoke and Pollution Aero- sol Effect on Cloud Cover,” Science, Vol. 313, 2006, pp. 655-658. doi:10.1126/science.1126232 [5] A. Angstrom, “On the Atmospheric Transmission of S Radiation and on Dust in the Air,” G un eografiska Annaler , Vol. 11, 1929, pp. 156-166. doi:10.2307/519399 [6] M. Masmoudi, M. Chaabane, K. Medhioub and F. Elleuch, “Variability of Aerosol Optical Thickness and Atmospheric Turbidity in Tunisia,” Atmospheric Research, Vol. 66, No. 3, 2003, pp. 175-188. doi:10.1016/S0169-8095(02)00175-8 [7] S. Ramachandran and A. Jayaraman, “Spectral Aerosol Optical Depths over Bay of Bengal and Chennai: I-Meas- urements,” Atmospheric Environment, Vol. 37, No. 14, 2003, pp. 1941-1949. doi:10.1016/S1352-2310(03)00082-7 [8] O. Dubovik and M. D. King, “A Flexible Inversion Algo- rithm for Retrieval of Aerosol Optical Properties from Sun and Sky Radiance Measurements,” Journal of Geo- physical Research, Vol. 105, No. D16, 2000, pp. 20673- 20696.doi:10.1029/2000JD900282 [9] S. Bhaskaran, N. Phillip, A. Rahman and J. Mallick, “Applications of Satellite Data for Aerosol Optical Depth (AOD) Retrievals and Validation with Aeronet Data,” Atmospheric and Climate Sciences, Vol. 1, No. 2, 2011, pp. 61-67. doi:10.4236/acs.2011.12007 [10] K. Praseed, T. Nishanth and M. Kumar, “Spectral Varia- tions of AOD and Its Validation Using MODIS: First Cut Results from Kannur, India,” Atmospheric and Climate Sciences, Vol. 2, No. 1, 2012, pp. 94-100. doi:10.4236/acs.2012.21011 [11] D. Sharma, M. Singh and D. Singh, “Impact of Post- Harvest Biomass Burning on Aerosol Characteristics and Radiative Forcing over Patiala, North-West region of In- dia,” Journal of the Institute of Engineering, Vol. 8, No. 3, 2011, pp. 11-24. [12] F. Esposito, L. Leone, G. Pavese, R. Restieri and C. Serio, osenv.2003.12.011 “Seasonal Variation of Aerosols Properties in South Italy: A Study on Aerosol Optical Depth, Angstrom Turbidity Parameters and Aerosol Size Distributions,” Atmospheric Environment, Vol. 38, No. 11, 2004, pp. 1605-1614. doi:10.1016/j.atm [13] S. Dey, S. N. Tripathi, R. P. Singh and B. N. Holben, “Sea- sonal Variability of the Aerosol Parameters over Kanpur, an Urban Site in Indo-Gangetic Basin,” Advances in Space Research, Vol. 36, No. 5, 2005, pp. 778-782. doi:10.1016/j.asr.2005.06.040 [14] D. Six, M. Fily, L. Blarel and P. Goloub, “First Aerosol Optical Thickness Measurements at Dome C (East Ant- arctica), Summer Season 2003-2004,” Atmospheric En- vironment, Vol. 39, No. 28, 2005, pp. 5041-5050. doi:10.1016/j.atmosenv.2005.05.010 [15] M. R. Perrone, M. Santese, A. M. Tafuro, B. N. Holben, and A. Smirnov, “Aerosol Load Characterization over South-East Italy for One Year of AERONET Sun Pho- tometer Measurements,” Atmospheric Research, Vol. 75, No. 1-2, 2005, pp. 111-133. doi:10.1016/j.atmosres.2004.12.003 [16] G. M. Giavis, H. D. Kambezidis, N. Sifakis, Z. Toth, A. D. Adamopoulos and D. Zevgolis, “Diurnal Variation of the Aerosol Optical Depth for Two Distinct Cases in the Athens Area, Greece,” Atmospheric Research, Vol. 78, No. 1-2, 2005, pp. 79-92. doi:10.1016/j.atmosres.2005.03.003 [17] X. Yu, T. Cheng, J. Chen and Y. Liu, “Climatology of Aerosol Radiative Properties in Northern China,” Atmos- pheric Research, Vol. 84, No. 2, 2007, pp. 132-141. doi:10.1016/j.atmosres.2006.06.003 [18] X. Yu, B. Zhu and M. Zhang, “Seasonal Vari Aerosol Optical Properties over Be ability of ijing,” Atmospheric Environment, Vol. 43, No. 26, 2009, pp. 4095-4101. doi:10.1016/j.atmosenv.2009.03.061 [19] X. Yu, B. Zhu, Y. Yin, J. Yang, Y. Li and X. Bu, Comparative Analysis of Aerosol Pr “A operties in Dust and Haze-Fog Days in a Chinese Urban Region,” Atmos- pheric Research, Vol. 99, No. 2, 2010, pp. 241-247. doi:10.1016/j.atmosres.2010.10.015 [20] I. Behnert, V. Matthias and R. Doerffer, “Aerosol Clima- tology from Ground-Based Measurements for the South- ern North Sea,” Atmospheric Research, Vol. 84, No. 3, 2007, pp. 201-220. doi:10.1016/j.atmosres.2006.05.006 [21] O. K. Nwofor, T. Chidiezie-Chineke and R. T. Pin “Seasonal Characteristics of Spect ker, ral Aerosol Optical Properties at a Sub-Saharan Site,” Atmospheric Research, Vol. 85, No. 1, 2007, pp. 38-51. doi:10.1016/j.atmosres.2006.11.002 [22] A. Saha, M. Mallet, J. C. Roger, P. Dubuisson, J. Piazzola and S. Despiau, “One Year Measurements of Aerosol Op- tical Properties Over an Urban Coastal Site: Effect on lo- cal Direct Radiative Forcing,” Atmospheric Research, Vol. 90, No. 2-4, 2008, pp. 195-202. doi:10.1016/j.atmosres.2008.02.003 [23] L. Alados-Arboledas, A. Alcantara, F. J. Olmo, J. A. Mar- tinez-Lozano, V. Estelles, V. Cachorro, A. M. Silva, H. Horvath, M. Gangl, A. Diaz, M. Pujadas, J. Lorente, A. Labajo, M. Sorribas and G. Pavese, “Aerosol Columnar Copyright © 2012 SciRes. ACS  S. JANJAI ET AL. 452 Properties Retrieved from CIMEL Rad VELETA 2002,” Atmospheric Enviro iameters during nment, Vol. 42, No. 11, 2008, pp. 2654-2667. doi:10.1016/j.atmosenv.2007.10.006 [24] N. Prats, V. E. Cachorro, M. Sorribas, S. Mogo, A. Ber- jon, C. Toledano, A. M. de Frutos, J. de la Rosa, N. Lau- lainen and B. A. de la Morena, “Columnar Aerosol Optical Properties during El Arenosillo 2004 Summer Campaign,” Atmospheric E 2008, pp. 2643-2653. nvironment, Vol. 42, No. 11, doi:10.1016/j.atmosenv.2007.07.041 [25] K. O. Ogunjobi, Z. He and C. Simmer, “Spectral Aerosol Optical Properties from AERONET Sun-Photometric Measurements over West Africa,” Atmospheric Research, Vol. 88, No. 2, 2008, pp. 89-107. doi:10.1016/j.atmosres.2007.10.004 tis, “Aerosol C[26] H. D. Kambezidis and D. G. Kaskaoulima- tology over Four AERONET Sites: An Overview,” At- mospheric Environment, Vol. 42, No. 8, 2008, pp. 1892- 1906. doi:10.1016/j.atmosenv.2007.11.013 [27] Z. Cong, S. Kang, A. Smirnov and Optical Properties at Nam Co, a Re B. Holben, “Aerosol mote Site in Ce ntral Tibetan Plateau,” Atmospheric Research, Vol. 92, No. 1, 2009, pp. 42-48. doi:10.1016/j.atmosres.2008.08.005 [28] X. N. Yu, B. Zhu, S. X. Fan, Y. Yan and X. L. Bu, “Ground- based observation of aerosol optical properties in Lan- zhou, China,” Journal of Environmental Sciences, Vol. 21, No. 11, 2009, pp. 1519-1524. doi:10.1016/S1001-0742(08)62449-3 [29] L. Pan, H. Che, F. Geng, X. Xia, Y. Wang, C. Zhu, M. Chen, W. Gao and J. Guo, “Aerosol Optical Properties Based on Ground Measurements over the Chinese Yang- tze Delta Region,” Atmospheric Environment, Vol. 44, No. 21-22, 2010, pp. 2587-2596. doi:10.1016/j.atmosenv.2010.04.013 [30] P. Wang, H. Che, X. Zhang, Q. Song, Y. Wang, Z. Zhang, X. Dai and D. Yu, “Aerosol Optical Properties of Re- gional Background Atmosphere in Northeast China,” At- mospheric Environment, Vol. 44, No. 36, 2010, pp. 4404- 4412. doi:10.1016/j.atmosenv.2010.07.043 Shi, W. Zha[31] J. Bi, J. Huang, Q. Fu, X. Wang, J.ng, Z. Huang and B. Zhang, “Toward Characterization of the Aerosol Optical Properties over Loess Plateau of North- western China,” Journal of Quantitative Spectroscopy and Radiative Transfer, Vol. 112, No. 2, 2011, pp. 346- 360. [32] Y. Xingna, Z. Bin, Y. Yan, F. Shuxian and C. Aijun, “Seasonal Variation of Columnar Aerosol Optical Proper- ties in Yangtze River Delta in China,” Advances in At- mospheric Sciences, Vol. 28, No. 6, 2011, pp. 1326-1335. doi:10.1007/s00376-011-0158-9 [33] M. Kumar, K. Lipi, S. Sureshbabu and N. C., Mahanti, “Aerosol Properties over Ranchi Measured from Aetha- lometer,” Atmospheric and Climate Science, Vol. 1, No. 3, 2011, pp. 91-94. doi:10.4236/acs.2011.13010 [34] S. Bhaskaran, N. Phillip, A. Rahman and J. Mallick, “Applications of Satellite Data for Aerosol Optical Depth (AOD) Retrievals and Validation with AERONET Data,” Atmospheric and Climate Science, Vol. 1, No. 2, 2011, pp. 61-67. doi:10.4236/acs.2011.12007 [35] P. Chaiwiwatworakul and S. Chirarattananon, “An Investi- gation of Atmospheric Turbidity of Thai Sky,” Energy and Buildings, Vol. 36, No. 7, 2004, pp. 650-659. doi:10.1016/j.enbuild.2004.01.032 [36] D. Sharma, M. Singh and D. Singh, “Impact of Post- Harvest Biomass Burning on Aerosol Characteristics and midt, A. K. Chan, J. Radiative Forcing over Patiala, North-West Region of In- dia,” Journal of the Institute of Engineering, Vol. 8, No. 3, 2011, pp. 11-24 [37] W. Von Hoyningen-Huene, T. Sch Heintzenberg and C. Neusuess, “Climate-Relevant Aero- sol Parameters of South-East Asian Forest Fire Haze,” Journal of Aerosol Science, Vol. 29, No. S2, 1998, pp. 1259-1260. doi:10.1016/S0021-8502(98)90812-6 [38] N. Nurhayati and T. Nakajima, “A Study of Aerosol Opti- cal Properties at the Global Gaw Station Bukit Kotota- bang, Sumatra, Indonesia,” Atmospheric Environment, Vol. 46, 2012, pp. 597-606. doi:10.1016/j.atmosenv.2010.10.057 [39] B. Gadde, S. B. Bonnet, C. Menke and S. Garivait, “Air .004 Pollutant Emissions from Rice Straw Open Field Burning in India, Thailand and the Philippines,” Environmental Pollution, Vol. 157, No. 5, 2009, pp. 1554-1558. doi:10.1016/j.envpol.2009.01 z, “Investigation of [40] S. Janjai, S. Suntaropas and M. Nune Aerosol Optical Properties in Bangkok and Suburbs,” Theoretical and Applied Climatology, Vol. 96, No. 3-4, 2009, pp. 221- 233. doi:10.1007/s00704-008-0026-4 [41] B. N. Holben, T. F. Eck, I. Slutsker, D. Tanre, J. P A. Setzer, et al., “AERONET—A . Buis, Federated Instrument Network and Data Archive for Aerosol Characterization,” Remote Sensing of Environment, Vol. 66, No. 1, 1998, pp. 1-16. doi:10.1016/S0034-4257(98)00031-5 [42] T. F. Eck, B. N. Holben, J. S. Reid, O. Dubovik, A. Smir- nov, N. T. O’Neill, I. Slutsker and S. Kinne, “Wavelength Dependence of the Optical Depth of Biomass Burning, Urban, and Desert Dust Aerosol,” Journal of Geophysical Research, Vol. 104, No. D24, 1999, pp. 31333-31349. doi:10.1029/1999JD900923 [43] A. Smirnov, B. N. Holben, T. F. Eck, O. Dubovik and I. Slutsker, “Cloud Screening and Quality Control Algo- rithms for the AERONET Database,” Remote Sensing of Environment, Vol. 73, No. 3, 2000, pp. 337-349. doi:10.1016/S0034-4257(00)00109-7 [44] A. Smirnov, B. N. Holben, T. F. Eck., I. Slutsker, B. Cha- tenet and R. T. Pinker, “Diurnal Variability of Aerosol Optical Depth Observed at AERONET (Aerosol Robotic Network) Sites,” Geophysical Research Letters, Vol. 29, 2002, p. 2115. doi:10.1029/2002GL016305 [45] J. T. Peterson and E. C. Flowers, “Atmospheric Turbidity over Central North Carolina,” Journal of Applied Mete- orology, Vol. 20, No. 3, 1981, pp. 229-241. doi:10.1175/1520-0450(1981)020<0229:ATOCNC>2.0.C O;2 [46] R. B. Stull, “An Introduction to Boundary Layer Meteor- ology,” Kluwer Academic Publication, Dordrecht, 1994. [47] M. I. Nodzu, S. Ogino, Y. Tachibana and M. D. Yama- Copyright © 2012 SciRes. ACS  S. JANJAI ET AL. Copyright © 2012 SciRes. ACS 453 Variations the Indochina Peninsula,” Journal of Climate naka, “Climatological Description of Seasonal in Lower Tropospheric Temperature Inversion Layers over , Vol. 19, No. 13, 2006, pp. 3307-3319. doi:10.1175/JCLI3792.1 [48] K. Kanokkanjana, P. Cheewaphongphan and S. Garivail, “Black Carbon Emission from Paddyfield Open Burning in Thailand,” International Conference on Environmental Science and Technology, Vol. 6, 2011, pp. v2088-v2092. [49] O. Dubovik, B. N. Holben, T. F. E Kaufman, M. D. King, D ck, A. Smirnov, Y. J . Tanre and I. Slutsker, “Vari- . ability of Absorption and Optical Properties of Key Aero- sol Types Observed in Worldwide Locations,” Journal of the Atmospheric Sciences, Vol. 59, No. 3, 2002, pp. 590- 608. doi:10.1175/1520-0469(2002)059<0590:VOAAOP>2.0.C O;2 [50] J. S. Schafer, T. F. Eck, B. N. Holben, P. Artaxo and A. F. Duarte, “Characterization of the Optical Properties of Atmospheric Aerosols in Amazonia from Long-Term AERONET Monitoring (1993-1995 and 1999-2006),” Journal of Geophysical Research, Vol. 113, No. D4, 2008, 16 pp. doi:10.1029/2007JD009319 [51] C. F. Bohren and D. R. Huffman, “Absorption and Scat- tering of Light by Small Particles,” Wiley-Interscience, New York, 1983. [52] Z. Li, P. Goloub, C. Devaux, X. Gu, X. Qiao, F. Zhao and H. Chen, “Aerosol Phase Function and Single Scattering Albedo Retrieved from Ground Measurements,” Atmos- pheric Research, Vol. 71, No. 4, 2004, pp. 233-241. doi:10.1016/j.atmosres.2004.06.001 [53] V. Estelles, J. A. Martinez-Lozano, M. P. Utrillas and M. Campanelli, “Columnar Aerosol Properties in Valencia (Spain) by Ground-Based Sun Photometry,” Journal of Geophysical Research, Vol. 112, No. D11, 2007, 9 p. doi:10.1029/2006JD008167 [54] O. Dubovik, A. Smirnov, B. N. Holben, M. D. King, Y. J. Kaufman, T. F. Eck and I. Slutsker, “Accuracy Assess- ments of Aerosol Optical Properties Retrieved from Aerosol Robotic Network (AERONET) Sun and Sky Ra- diance Measurements,” Journal of Geophysical Research, Vol. 105, No. D8, 2000, pp. 9791-9806. doi:10.1029/2000JD900040 [55] N. T. K. Oanh, B. T. Ly, D. Tipayaron, B. R. Manandhar, P. Prapat, C. D. Simpson and L.-J. S. Liu, “Characteriza- tion of Particulate Matter Emission from Open Burning of Rice Straw,” Atmospheric Environment, Vol. 45, No. 2, 2011, pp. 493-502. doi:10.1016/j.atmosenv.2010.09.023 [56] T. Suramaythangkoor and S. H. Gheewala, “Potential of Practical Implementation of Rice Straw-Based Power Generation in Thailand,” Energy Policy, Vol. 36, No. 8, 2008, pp. 3193-3197. doi:10.1016/j.enpol.2008.05.002 [57] R. T. Pinker, G. Pandithurai, B. N. Holben, T. O. Keefer and D. Goodrich, “Aerosol Radiative Properties in the Semiarid Western United States,” Atmospheric Research, Vol. 71, No. 4, 2004, pp. 243-252. doi:10.1016/j.atmosres.2004.06.002 [58] T. F. Eck, B. N. Holben, D. E. War Reid, et al., “Characterization of the Opti d, O. Dubovik, J. S. cal Properties of Biomass Burning Aerosols in Zambia during the 1997 ZIBBEE Field Campaign,” Journal of Geophysical Re- search, Vol. 106, No. D4, 2001, pp. 3425-3448. doi:10.1029/2000JD900555 [59] E. J. Hyer and B. N. Chew, “Aerosol Transport Evaluation of an Extreme S Model moke Episode in Southeast Asia,” Atmospheric Environment, Vol. 44, No. 11, 2010, pp. 1422-1427. doi:10.1016/j.atmosenv.2010.01.043 [60] P. Redemann, B. Russell and P. Hamall, “Dependence of Light Absorption and Single Scattering Albedo on Am- bient Relative Humidity for Sulphate Aerosols with Black Carbon Core,” Journal of Geophysical Research, Vol. 106, No. D21, 2001, pp. 27485-27495. doi:10.1029/2001JD900231 [61] R. W. Bergstrom, P. B. Russel and P. length Dependence of the A Hignett, “Wave- bsorption of Black Carbon Particle: Prediction and Results from the TARFOX Ex- periment and Implications for the Aerosol Single Scatter- ing Albedo,” Journal of the Atmospheric Sciences, Vol. 59, No. 3, 2002, pp. 567-577. doi:10.1175/1520-0469(2002)059<0567:WDOTAO>2.0. CO;2 [62] T. Takamura, T. Nakajima, O. Dubovik, B. N. Holben and S. Kinne, “Single Scattering Albedo and Radiative Forcing of Various Aerosol Species with a Global Three-Dimensional Model,” Journal of Climate, Vol. 15, No. 4, 2002, pp. 333-352. doi:10.1175/1520-0442(2002)015<0333:SSAARF>2.0.C O;2
|