 Sociology Mind 2012. Vol.2, No.4, 447-457 Published Online October 2012 in SciRes (http://www.SciRP.org/journal/sm) http://dx.doi.org/10.4236/sm.2012.24058 Copyright © 2012 SciRes. 447 Does Pay Disparity Really Hamstring Team Performance? A Study of Professional Ice Hockey Players Noah Stefanec Claremont Graduate University, Claremont, USA Email: noahstefanec@hotmail.com Received May 3rd, 2012; revised June 8th, 2012; accepted June 19th, 2012 Here, I employ an unbalanced panel of data from the National Hockey League (NHL) to examine the im- pact of pay disparity on team-cohesiveness. I find evidence to suggest the existence of a negative rela- tionship between higher degrees of within-position pay disparity and team performance; the evidence re- ported here shows a simple monotonic elasticity of team performance with respect to pay disparity to be roughly 19%. Keywords: Relative Compensation; Pay Compression; Industrial Politics Introduction Insights into the general nature of relative compensation schemes reveal that enhanced cooperation amongst workers in a firm can be achieved via compression of the wage structure. Proponents of this theoretical concept, such as Milgrom and Roberts (1988), Akerlof and Yellen (1988, 1990), Lazear (1989), and Levine (1991), offer convincing, well-motivated, and detailed theoretical justifications for the effectiveness of pay compression on improved team-cohesiveness. Conceptually, the notion is quite simple: If a relatively large degree of earn- ings inequality was to exist in a relative-based reward system, then workers in the same firm are incentivized to compete against each and thus team-cohesiveness breaks down. Ac- cordingly, an elevated degree of earnings equality disincentive- izes anticooperative behavior amongst employees. Theoreti- cally speaking, however, an efficient level of pay dispersion may be able to persist within a firm without motivating subvert- sive behavior. Ramaswamy and Rowthorn (1991), for instance, also pro- pose a convincing theoretical argument which disputes the ef- fectiveness of pay compression. Their dissent mainly centers on the behavioral tendencies of the workers within a particular group (firm). When a group of individuals strive for a common goal, the personality composition of the group is of great im- portance: Individuals with so-called “damage potential” may need to be paid efficiency wages in an effort to mitigate their desire to harm the team’s productivity. In this way, a certain extent of pay disparity can exist within the group yet not be a causal mechanism directly related to collaborative behavior. Both parties offer lucid, rational arguments possessing their own particular merits, and the debate has attracted serious mainstream and academic attention. Unfortunately, firm-level data is notoriously difficult to ac- quire, making empirical evaluations of these theories difficult. This has forced many empirical researchers to employ more creative means to explore this topic. Recently, many have re- sorted to utilizing the accurate and readily-available salary and performance data regarding professional athletes in an attempt to empirically document the effects of changes in reward struc- tures on collaborative behavior (Depken, 2000; Berri & Jewell, 2004; Garcicano & Palacios-Huerta, 2006). The results of these studies have thus far been mixed, leaving the subject open to debate. The purpose of this paper is to empirically study the effects of increased degrees of pay disparity on the behavior of profes- sional hockey players. Although I make no claim that a hockey club is representative of every single type of private-sector firm, the results may still be able to offer significant insights into the behavioral response of workers to changes to within-group earnings equality. The main question addressed by this paper is: Does a higher echelon of pay inequality really disincentivize teamwork? Section 2 discusses the past and current literature related to the topic of pay compression. In lieu to the model found in Ramaswamy and Rowthorn (1991), Lazear’s (1989) more clas- sical model of industrial politics was adapted to better mirror the world of professional hockey. This model, found in Section 3, predicts higher degrees of (within-position) pay inequality result in less team-oriented behavior, although certain altera- tions to key assumptions can relax this result. Section 4 dis- cusses the empirical methodology utilized to test the theory; team winning percentage is employed as the dependent measure of team performance while a modified intraposition version of the Herfindahl-Hirschman Index (HHI) reflects pay disparity. Section 5 reports the findings obtained from the employment of a panel-based empirical approach. The evidence presented here demonstrates a statistically and economically significant negative relationship between higher degrees of pay disparity and team performance. Particularly, I find the elasticity of team performance with respect to pay disparity to be roughly 19%. Section 6 addresses possible complications in the study while Section 7 concludes. The Literature The existing sports economics literature regarding pro- fessional hockey is chiefly empirical and has long been dominated by the debate over the potential discrimination of French-Canadian skaters playing for teams in English-speaking  N. STEFANEC Canada (Lavoie et al., 1987; Jones & Walsh, 1988; Mclean & Veall, 1992; Longley, 1995; Krashinsky & Krashinsky, 1997; Curme & Daugherty, 2004)1. In this literature, the standard procedure for explaining the variation in pay across hockey players has been to assume parsimonious marginal revenue product-based earnings equations following Mincer (1974), but theoretically speaking, little work has been done to model the compensation structure of players in the National Hockey League (NHL). This paper abstracts from the marginal revenue product-based explanation of wages for professional hockey players in an attempt to study the effects of increased pay dispersion on team performance. Hockey players are generally thought to be cooperating with their teammates against a common opponent, but in a more abstract sense, each player is also competing against members of their own team who occupy the same on-ice position (i.e. center, right wing, etc.) in hopes of being awarded a higher salary upon the basis of their ordinal rank. From this perspec- tive, hockey as a profession can be viewed as a rank-order promotional tournament (Lazear & Rosen, 1981). Moreover, incremental increases in pay based upon ordinal rank become larger as players become recognized as highly talented, not unlike the so-called “superstar effect” usually reserved for the discussion of top-executive compensation packages (Rosen, 1981). Even in the world of professional hockey, the hierarchal structure within any given position can be as important an in- centive mechanism to a player as their total compensation package. Relative-based pay is appropriate when transaction costs render payment based upon absolute performance ineffective (Lazear, 1986, 2000). In professional hockey, this is fairly close to what is observed. Performance bonuses notwithstanding, players are not paid solely/explicitly by the piece per se (i.e. by goals, assists, hits, etc.) because an attempt to do so could result in a dysfunctional incentive. Recalling Kerr (1975) and Baker (1992), a payment scheme such as 12 3 goals assists hitsyab bb 'bs bbb (where y is gross compensation, a is some base-salary, and are the piece-rates associated with each respective performance measure) will ensure multi-tasking by players; for instance, players will place too much emphasis on hits and pay less at- tention to passing and scoring attempts if . 321 In a similar vein, the theory of relative compensation gener- ates a transparent lens through which the interaction of workers within a firm can be viewed. As with any compensation scheme, relative pay can also be dysfunctional to a degree. Pay com- pression proponents argue that a higher level of intrafirm pay disparity can be inefficient as compensation based upon ordinal rank can incentivize uncooperative behavior and internal dis- sonance (Milgrom & Roberts, 1988; Akerlof & Yellen, 1988, 1990; Lazear, 1989; Levine, 1991). This theory thus illustrates a classic economic trade-off between productive incentives and cooperation: Higher wage inequality between winners and los- ers of a promotional tournament generates both the incentive to supply effort and the disincentive to work in concert with fel- low employees, leading to blatant sabotage. Strangely enough, this idea is put most eloquently by comedic actor Leslie Nielsen who once wrote: “You don’t win golf matches by trying to take strokes off your own score; you win golf matches by doing eve- rything within your power to see to it that your opponent adds strokes to his score.”2 Accordingly, some degree of pay com- pression can be (relatively) efficient as it detracts attention away from subversive behavior and encourages cooperation, although a tighter wage distribution may hamstring the firm by lowering the equilibrium level of individual effort. Various predications of pay compression theory have been subjected to empirical testing. Particularly, the application of sports data to this particular problem has helped lend pay com- pression proponents marginal support. Sports data is recently becoming more widely-utilized by labor economists due to its accuracy, its availability, and the ease to which economic the- ory explained through the lens of professional sports can be more relatable to students in the classroom. For example, Dep- ken (2000) employs a panel-data approach using observations from Major League Baseball (MLB) and finds that teams with less earnings disparity experienced improved group perform- ance (as measured by team winning percentage). More recently, Garcicano and Palacios-Huerta (2006) find professional soccer players responded to a change in their in- centive structure designed to encourage scoring (an increased number of points for winning the match) by increasing both their level of play and their level of sabotage, such as tackling opponents (again, a dysfunctional incentive can produce physi- cal danger) or “freezing the game” when ahead late in the match. In line with the predictions of industrial politics, the authors find that a decompression of the reward structure for soccer players resulted in both higher equilibrium levels of individual effort and sabotage, yet this study offers no direct link between pay disparities and team performance. Most of these above findings tend to side with the proponents of pay compression, yet other theories and their subsequent empirical testing has ignited a debate in the literature about the topic. On the opposing side of the pay compression theory, some contend that group productivity and the level of earnings dis- persion within a firm are unrelated. Most notably, Ramaswamy and Rowthorn (1991) argue that firms should pay workers with so-called “damage potential” efficiency wages to lessen their tendencies towards shirking, negligence, or disruptive conduct. In this way, wage rates are an increasing function of “damage potential” and thus earnings dispersion (while still efficient) can persist yet be completely unrelated to team performance. There is empirical evidence to support this theory as well; for example, Berri and Jewell (2004) employ data from the National Basket- ball Association (NBA) and find a non-negative relationship between wage disparity and team productivity. These findings would tend to refute the arguments made by pay compression proponents3. Because empirical support for pay compression theory re- mains rather mixed, the subject is still very much open to de- bate. One sport as yet unexamined by empirical researchers is professional hockey; a behavioral analysis of hockey players is important and innovative in that the frame of reference regard- ing pay disparity can be narrowed from an aggregate firm-level down to a more realistic, intrapositional level. The evidence presented here suggests the existence of a negative relationship 1Changes to the incentive structure prior to the 2000-2001 season regarding overtime victories have also been investigated in the past (Easton & Rock- erbie, 2005; Shmanske & Lowenthal, 2007). 2Adapted from Leslie Nielsen’s Stupid Little Golf Book, Doubleday Pub- lishing (1995: p. 69). 3Other studies suggest that race (rather than pay disparity) does not influ- ence the level of cooperation within the workplace, especially in a highly visible setting (Lefgren et al., 2009). Copyright © 2012 SciRes. 448  N. STEFANEC between higher degrees of within-position pay disparity and team performance; I find the elasticity of team performance with respect to pay disparity to be roughly 19%. The Model A simple, classical model of a relative compensation scheme similar to that found in Lazear (1989) is adapted here to more adequately reflect the environment of a professional hockey player. The main prediction of this model is that compression of the intraposition salary structure should increase the degree to which players work in concert with their intrapositional counterparts. Accordingly, decompression of the salary struc- ture results in position-wise disunity and anticooperative be- havior. i) Basic setup of the model. As an abstract alternative to the marginal revenue prod- uct-based explanation of wages for professional athletes, as- sume relative compensation is appropriate. Regard a hockey club as a single firm consisting of two ex-ante identical players j and k who are competing for larger salaries based upon their within-group ordinal rank (mutually exclusively defined by center, right winger, left winger, defensemen, or goalie). As opposed to the entire league or single team (which is represent- tative of a single firm), the position a player occupies is as- sumed to be the reference group; for example, it is unlikely that a defensemen would be seeking to compete for a position as a center within any given team. Superior rewards are also as- sumed to be tied to job titles such as captain or alternate captain. There are a fixed, limited number of players who can earn these titles and in this way wages are tied to the “job” rather than to the individual as emphasized by Lazear and Rosen (1981)4. Two possible outcomes exist for the competing players. The winning player earns a job title and an accompanying wage of 1 while the losing player earns a wage of 2. Of course, it is the case that 12 . Define the wage “tilt” as 12 . The wage tilt can be thought of as the level of earnings disper- sion or the degree of wage (in) equality between the winner and loser of the tournament. Also define . w w wwww Ww w 12 The productivity of professional athletes is generally thought to exist across two dimensions: Individual duties and informal obligations to teammates. Accordingly, every risk-neutral pro- fessional hockey player exercises the production function: 12 θ,θf θ 0, 0ff θ θ θ 0f θ 0 θ θ θ θ θ 0f (1) where 1 is a player’s average level of individualistic on-ice productivity (which can also be extended to include many of the intangible aspects of athletic aptitude such as coachability, persistence, and drive, all of which produce level-effects on individual performance in any a respective position) where 111 while 2 can be generally be thought of as intrapositional team-oriented behavior both on and off-the-ice. For example, higher chosen equilibrium values of the latter argument can include increased camaraderie, mentorship, and knowledge-sharing regarding behavioral tendencies of oppos- ing players. Put more colloquially, the first argument of the production function 1 measures the degree to which a player “plays for the name on the back of the jersey” while the second argument of the production function 2 captures the degree to which a player “plays for the logo on the front of the jersey.” It is commonly believed that collaboration is mutually beneficial; thus, it is assumed that . 2 While 1 is assumed to be strictly positive (a zero value of individual effort would result in termination in all likelihood), there is no assumption here which restricts 2 θ; the possibility of a zero value of 2 exists. Negative values of 2 may exist on the ice only for defensemen (since this is the only time where two players occupying the same position are on the ice simultaneously) but negative values of 2 probably do not exist in the locker room (e.g. sabotaging equipment, etc.) due to the high degree of visibility on that margin. Thus, negative values of 2 θ are assumed away but allowing for them would not change the results of the model in any signi- ficant manner. Basically, low positive values of 2 θ below some threshold are a general indication of “damaging” antics such as missing or complaining during practice, reputational assaults on positional counterparts in the media, refusing to mentor a younger player aspiring to play the same position, or the withholding of knowledge. Small equilibrium values of 2 may hurt teammates in the short-run or may eventually cause teammates to ignore the player’s behavior in the long-run. Exceedingly large values of 2 may even result in the firing of a disruptive player due to peer-pressure by co-workers5. For simplicity in modeling, the higher-order derivative regarding the second argument of the production function is assumed to be monotonic such that 22 . Certainly both workers in firms and players on sports teams exert zero, small or even large values of 2, and the main aim of this paper is to address and empirically test the two compet- ing hypotheses regarding this phenomenon: Is this behavior in fact (at least to some degree) motivated by the degree of pay inequality? A definitive answer to this question can benefit many human resource managers seeking both enhanced internal harmony from their employees as well as isolating and healing possible sources of internal friction amongst their employees. In a sports context, these results may alert team owners to the amount of in-fighting they are causing amongst their own team via pay inequalities which exist within them their chosen rela- tive pay scale. θ 4Captains are the only players allowed to converse with referees on the ice over ruling disputes. When the captain is not present, the alternate captain fills this role. The assumption that higher wages are tied to these jobs is abstract; players in these roles usually have larger marginal revenue prod- ucts, more leadership ability, and longer experience as well. 5An appropriate example here is a recent incident involving Sean Avery, a known agitator reputed to have ill-relations with many of the players and coaches in the league. In fact, 66.4% of his peers ranked him the “most-hated player in the league” according to a 2007 poll of 283 NHLers (The Hockey News, 2007). While playing for the Dallas Stars at the start o the 2008-2009 season, he made inappropriate and anti-social comments off-the-ice, causing (initially) a six-game suspension (CBC Sports, 2008) which was then extended indefinitely until a mandatory anger management treatment program could be completed. During this period of rehabilitation, the entire Dallas Stars organization (front-office, coaches, and players) collectively decided Avery would not be welcomed back into the locker room (Duthie, 2008). He was placed on waivers (i.e. fired), yet subse- quently (re)hired by the New York Rangers. Following Lazear (1989), the individual output of players j and k is given by: 12 θ,θε jk j qf (2a) and 12 θ,θε kkjk qf (2b) θ0 respectively, where 2k (take 2 θk, for example) is the amount of cooperative effort player j exerts which favorably Copyright © 2012 SciRes. 449  N. STEFANEC affects the output of teammate k. is traditionally thought of as stochastic productive luck or as measurement error in deter- mining the final ordinal ranking where ε ε0E. The prob- ability that player j defeats player k is then given as: 12 θ, j Gf21 θθ,θ kj f Pr k pqq jk (3) where G is the cumulative distribution function. Finally, team output is given by: , k QQqq. (4) To ensure that this is not a zero-sum game for the principal, allow total output to be tied directly to fan attendance (A) such that , jk qEQq W . Profit is then given by where the price of a ticket is essentially normalized to unity. Total team output is thus defined as having a dollar-to-dollar relationship with fan attendance, implying that winning teams (i.e. those consisting mainly of players with higher net yield) sell more tickets. An individual’s net yield is the difference between their (expected) output and their cost of effort, the latter function given by 12 θ,θCwhere for all players, positions, teams, and seasons. 111 222 ,,, 0C C CC The remainder of the theoretical section is designed to pre- dict the response of players to an increased degree of pay equality. The behavior of a professional hockey player is mod- eled as a two-stage principal-agent game. In the first stage of the problem, symmetric players competing for jobs at the same position solve for equilibrium levels of individual effort and team-oriented effort taking the wage tilt as exogenous. Given the players’ labor supply behavior, a single non-monopsonist team owner then chooses the wage tilt to maximize rent-per- player subject to a zero-profit constraint. ii) A player’s problem. Although both players solve the same labor supply problem, arbitrarily consider the maximization problem of defenseman j. Recall each player is ex-ante identical in ability and that players are assumed to occupy the same position (so player k is also a defenseman). Taking the wage tilt as exogenous, player j maximizes his expected utility by choosing both his individu- ally-motivated and cooperative levels of effort, respectively. Following Lazear (1989), the problem is given as: 12 12112 θ,θ max w1wwθ,θ jj j pC where the necessary first-order conditions for a maximum are given by: 1112 0θ,θ k gCf (5a) 2212 (0) θ,θ kj gCf (5b). The probability density function εε is evaluated at zero because the equilibrium is Cournot-Nash, which is conven- tional in the tournament literature. Assuming players adopt a winning strategy (i.e. there is a large enough spread between kj ), the second order-conditions sufficient for an interior solution are given by: 11 11 00gfC 22 0C (6a) (6b). Thus, the equilibrium level of individual effort is given by * θθ 11jj and the equilibrium level of team-oriented effort is given by * θθ 22jj . From Equation (5a), it is seen that larger wage tilts generate higher equilibrium levels of individual effort. Comparative statics show that holding cooperative behavior constant and differentiating (5a) with respect to individual effort, the partial derivative of individual effort with respect to pay disparity is positive and given by: 11 11 11 θ00 0 jgf Cgf (7a). Ceteris paribus, a decompression of the salary structure within the frame of reference motivates players to produce a higher level of individual effort (Lazear & Rosen, 1981)6. Ac- cordingly, compression of the pay structure discourages com- petitive spirit. A decompression of the pay structure, however, implies a lower equilibrium level of cooperative effort and illustrates the essence of this classical economic tradeoff: Higher pay disparity is reflected in less harmonious attitudes towards others competing for the same position, ceteris paribus. This can be seen from Equation (5b), where holding effort con- stant and differentiating with respect to team-oriented behavior, the partial derivative of cooperation with respect to pay dispar- ity is negative and given by: 6There exists a large body of empirical work to support this predication; see (for example) Ehrenberg and Bognanno (1990a and 1990b) and Freeman and Bell (1999). 7As a theoretical aside, the assumption made with respect to the higher-order derivative of the second argument of the production function is crucial to this result. First, a more canonical assumption regarding the second-order derivative of a production function is to assume that the ar- gument exhibits diminishing returns such that f22 < 0. In other words, a player who moves further away from choosing a corner solution of zero in θ2 may only drive his teammate to respond increasingly positive up to some relevant range. Alternatively, increasing returns such that f22 > 0 is also a possibility. Thus, for equation (7b) to hold negative under these possibilities it then must be the case that . Therefore, although sensitive to changes in assumptions, this classical model leaves open the possibility that pay disparity and cooperation may have a non-negative relationship as suggested by Ramaswamy and Rowthorn (1991). 22 22 θ00 jgf C (7b). The goal of the forthcoming empirical analysis is to test the prediction of Equation (7b): Does a decompression of the re- ward structure really result in lower equilibrium levels of col- laborative behavior?7 These results also imply that, all else equal, a higher echelon of intra-position wage equality will benefit NHL team owners by improving group performance, attendance, and net profit. Before proceeding to the empirical analysis, the impact of improved cooperation on profit is briefly discussed in the next section. 1 0g iii) A team owner’s problem. A single team owner acting as principal seeks to maximize the expected profit-per-position (net rent) subject to a zero profit constraint8. Team owners are assumed to possess no mo- 22 22 fC 8It is relevant to note that an entirely separate debate about this issue exists in the sports economics literature. Kesenne (1996, 2006), for instance, suggests win percentage maximization or even talent maximization as other viable possibilities. Here, it is simply assumed that greater cooperation generates a more successful and profitable team. Thus, the team owner need not maximize win percentage directly because a profit-maximizing selec- tion of the wage tilt should (in theory) accomplish the same goal. This does, however, suggest a simple negative relationship between pay disparity and cooperation which may not be the case (this will be discussed later). Copyright © 2012 SciRes. 450  N. STEFANEC nopsonistic bargaining power over the players. By strict defini- tion, a monopsony is a single buyer in the market for a good (in this case, a hockey player). Recall each team is analogous to a single firm; because the NHL is comprised of thirty teams (two conferences, each with three divisions and five teams per divi- sion), the NHL does not appear to operate under imperfect competition in so as far as it has been emphasized in most of the prior literature regarding the sport9. Again following Lazear (1989), an owner’s problem is given as: max μ, θμ,θ jkk C WC st WA where the necessary first-order condition for a maximum is given by: 12112 μθ μθ0Eff QCC (8). From Equation (8), it can easily be seen that net output is higher when positional teammates are more prone to work to- gether. Fundamentally, this is because the marginal cost of effort is higher on a dysfunctional team. This result can be de- rived more formally by solving for the marginal cost of effort in Equation (8) and comparing a game in which the possibility of cooperation is zero and a game in which the possibility of co- operation is greater than zero. Respectively, these are given by: 1 CE11 Qf (8a) and 122 111 θθ θθ Qf C CEQf ( 8b). Each additional unit of effort costs more on the margin in Equation (8a) than in Equation (8b) because the inequality 12 12 θ,θ0θ,θ0CC holds for all players. Thus, any team owner who incentivizes teamwork realizes greater net profits because 12 12 2θ,θ0)2 θ,θ0QC QC w% θ HHI . Data and Empirical Approach The empirical testing of economic theories derived from a within-firm frame of reference is largely contingent upon the availability of such data. Although some have managed to obtain and utilize performance date from within a firm (e.g. Lazear, 2000), firm-level data is notoriously difficult to obtain. In response, many researchers have turned attention to data gathered with regards to professional athletes. The attractiveness of sports data mainly centers on its large degree of availability, its low degree measurement error due to higher levels of observability, and the ease to which economic concepts explained via phenomenon observed in professional sports can be more relatable to students in the classroom. i) The data. The unbalanced panel describing professional hockey players assembled and employed for use in this study includes observations from the 2000-2001, 2001-2002, 2002-2003, and 2003-2004 seasons. These seasons were chosen because a change in the incentive structure regarding overtime/shootout victories was put in place in 2000 (affecting all entities equally) and the labor dispute between team owners and the National Hockey League Players’ Association (NHLPA) did not occur until 2005. Thus, this choice of seasons avoids both major changes to the overtime incentive structure and changes to both the overall league compensation structure and regulatory modifications which occurred as a result of the eventual collective bargaining agreement (CBA) reached between team owners and the players’ union. Salary information is given in domestic (US) currency thus any issues involving exchange rates (e.g. Canadian vs. US dollars) can be ignored. As a point of fact, all salaries paid to players are mandated by the league to be remunerated in US currency. General demographic statistics regarding time-variant traits were also easily obtained. Furthermore, the main attractive feature of hockey data is the ability to narrow the frame of reference regarding pay disparity from an aggregate firm-level to a more realistic intraposition level; all positions are included in the sample, differentiated by centers, right-wings, left-wings, defensemen, and goalies. Certain criteria regarding inclusion into the sample is worthy of a brief discussion at this point. First, because the sample is rather small, it is not restricted by the number of games played in any given season; thus, both “full-time” and “part-time” players are included in the interest of obtaining more variation in the independent variables. Second, players who were traded from their initial team in a given season are not excluded from the sample in an effort to minimize selection bias. For example, players who are more prone to leave their team when the chances of making the post-season are slim (“hired guns”), may be considered more individualistic by their very nature. Thus, excluding “job-movers” may result in a sample consisting solely of players with low marginal costs of team loyalty, saintly effort, and positional-collaboration. A sample such as this would in all likelihood be less affected by pay disparity. ii) Empirical approach. A panel-data based approach is employed to test the predica- tion that an increased degree of pay disparity results in lower intrapositional cooperation. The traditional measure selected to reflect cooperation is team winning percentage (). This is the dependent variable of interest in the forthcoming empirical specification and is representative of 2 in the theoretical portion of the paper. Note that while team revenue or team profits may also be an adequate measure of group performance, these figures are only as reliable as the accounting practices a particular team employs, the veracity of which has been ques- tioned in the past. For instance, independent studies of revenues and expenses conducted internally by NHL owners estimated league losses at a 10% greater margin than the independent study conducted by Forbes Magazine (Staudohar, 2005)10. The main independent variable of interest, pay disparity, is measured here by an intraposition adaptation of the Herfin- dahl-Hirschman Index (), which is calculated by: 9In a similar vein, a raiding issue has recently surfaced in the world o professional hockey. The Kontinental Hockey League (KHL), formed in the spring of 2007 to replace the disbanded Russian Superleague, has been luring contractually-obligated NHL players overseas (Wawrow, 2008). Thus, as the market for hockey players becomes more globally competitive, any degree of monopsonistic bargaining power enjoyed by NHL team owners is diminishing over time. 10In a more innovative attempt to broaden the spectrum of variables repre- senting team performance, I also employed assists per game, which should be a good proxy of how well a team is working together. However, the employment of this measure produced insignificant results. Note also that the correlation coefficient between assists per game and win percentage was also rather small .0534 . Copyright © 2012 SciRes. 451  N. STEFANEC 2 1 share n pts i 1815n HHI (9) where n is the number of players l in the sample ( ) and share ts is position p’s share of his respective team t’s total payroll in season s. Payroll is defined as the sum of the team’s total salary expenditures allocated to a specific position. Conventionally, it is the case that 0,HHI HHI 10000 ε pts ipts HHI w% α ε ε δ ˆ δ0 0 Ho ˆ :δ0 Ha . From the point of view of the theoretical model, is expected to proxy . Note that other researchers have also employed variations of this measure as a proxy for pay disparity (e.g. Depken 2000, Berri & Jewell, 2004). The following empirical specification is employed to test the prediction of Equation (7b). A fixed-effects model which more directly exploits the panel nature of the data is estimated. As opposed to a pooled cross-sectional model which assumes variation is simply across individual players, the fixed-effects model employed here assumes variation is within-teams and across individuals, positions, and time (seasons). Employing win percentage as the dependent metric of teamwork and fol- lowing Depken (2000), the specification is given by: ln w%αβδln iptsiipts X (10) where ipts is player l at position p on team t’s winning percentage in season s, individual fixed-effects measuring un- observed individual heterogeneity is given by i, X is a vector of consisting of time-variant controls including player l at posi- tion p’s share of his respective team t’s payroll in season s, and player l on team t’s collective points per game, age, experience, weight, height, number of fights, and total penalty minutes at position p in season s ( this vector also includes squared terms of players’ physical demographics and violent tendencies as well as both season and team-specific fixed-effects)11. β’s are the estimated parameters which are consistent under general conditions and efficient under normality, δ is the coefficient of interest, and is a stochastic term which varies across indi- viduals, positions, teams, and seasons. is assumed to have the standard properties of being uncorrelated with itself, uncor- related with the independent variables, has mean zero, and is homoskedastic. The estimated coefficient of interest is interpreted here as the elasticity of team performance with respect to pay dis- parity (defined as the percentage change in team performance with respect to each additional unity percentage change in pay disparity) and it is expected that this elasticity will be negative such that . Elasticities are employed here for simplifi- cation of the analysis because they possess the beneficial qual- ity of being “unitless” (i.e. being independent of units). Thus, the null hypothesis is being tested against the al- ternate hypothesis ˆ :δ (two-tailed t-test). Given that theory clearly predicts a negative relationship, a one-tailed t-test is also performed where the null hypothesis ˆ :δ0 Ho is tested against the alternate hypothesis . ˆ :δ0 Ha HHI Some general summary statistics regarding the dependent and independent variables (as well as payroll information) can be found in Table 1. First, information regarding pay disparity across time as well as by position is presented; recall pay dis- parity is the independent variable of interest. Second, statistics on win percentage and are given across time and by position, which is the dependent variable of interest. Third, payroll in- formation (by position) is also presented. The statistics show that the variance of pay disparity peaked during the 2000-2001 season. It is interesting to note that the correlation between earnings disparity and payroll is rather high (.416). In all like- lihood, this suggests that varies because of the market size of each team; put differently, some teams are poor and can only afford a collection of younger, inexperienced, yet more equally paid players (with maybe an additional higher paid, experienced yet out-his-prime player) while larger market teams can afford better players in their prime who can com- mand higher salaries. It is also a possible that teams may sim- ply just employ different payment strategies. In addition, sum- mary statistics regarding the time-variant traits can be found in Table 2. Results When workers’ rewards are based upon a relative compare- son of performance, many argue that pay compression can be (relatively) efficient because a tighter wage distribution miti- gates anticooperative behavior and encourages team collabora- tion (Milgrom & Roberts 1988; Akerlof & Yellen 1988, 1990; Lazear 1989; Levine 1991). Others argue that pay compression can persist yet be unrelated to team performance (Ramaswamy & Rowthorn, 1991). Neither theory has received definitive empirical support, leaving the matter open to debate. The em- pirical portion of this paper attempts to directly address this puzzle. Here, I estimate a fixed-effects model which more di- rectly exploits the nature of the panel data to investigate the effects of an increased degree of pay disparity on team per- formance12. These results can be found in Table 3 (column 1), which presents an estimate of equation 10; this model explains roughly 22% of the variation in the log of winning percentage (adjusted). The estimated coefficient on payroll is statistically insignifi- cant (suggesting that an owner may not be able to simply “buy a winning team”). Unsurprisingly, marginal increases in the level of points per game result in higher win percentage. With respect to age and experience, the results cannot be interpreted inearly. Interestingly, they suggest that younger teams have l 11A player receives one point for a goal and one point for an assist; this is employed as a general performance measure. Indicators of violence are included because prior work has shown that fighting ability helps teams move through successive rounds of the playoff (Haisken-DeNew & Vorell, 2008). Although fighting and aggrieves offenses carry with it a zero-toler- ance policy when it comes to enforcement by the NHL, it is interesting that layers (particularly fighters) adhere to an informal etiquette system among themselves which is largely based upon trust, respect, and reputation. This includes an invitation and verbal agreement before a fight begins, the romise not to engage another player when he is injured or near the end o his shift, and not wearing equipment or using dangerous objects such as sticks or helmets to injure opposing players (Bernstein, 2006). Players (such as Chris Simon) who break these informal rules or who engage in blatant attempts to injure other players often lose the respect of their peers. 12In addition to “hired guns,” the so-called “agitators” and “goons” also tend to have high (assumed) time-invariant marginal costs of cooperation. Although personality is certainly liable to influence team chemistry as suggested by Ramaswamy and Rowthorn (1991), fixed-effects models should absorb the behavior of these types of players. Only 2.3% of the sample is composed of agitators while 4% are enforcers (identification o these players was accomplished via www.wikipedia.org.) As an aside, the data suggests that these players are paid significantly less on average than their dovish counterparts (roughly 15% - 30%, all else equal), suggesting a negative wage profile associated with those considered to have increasing “damage potential.” This may be expected though, because the performance of NHL players is monitored quite thoroughly whereas efficiency wages are usually paid in the absence of monitoring. Copyright © 2012 SciRes. 452 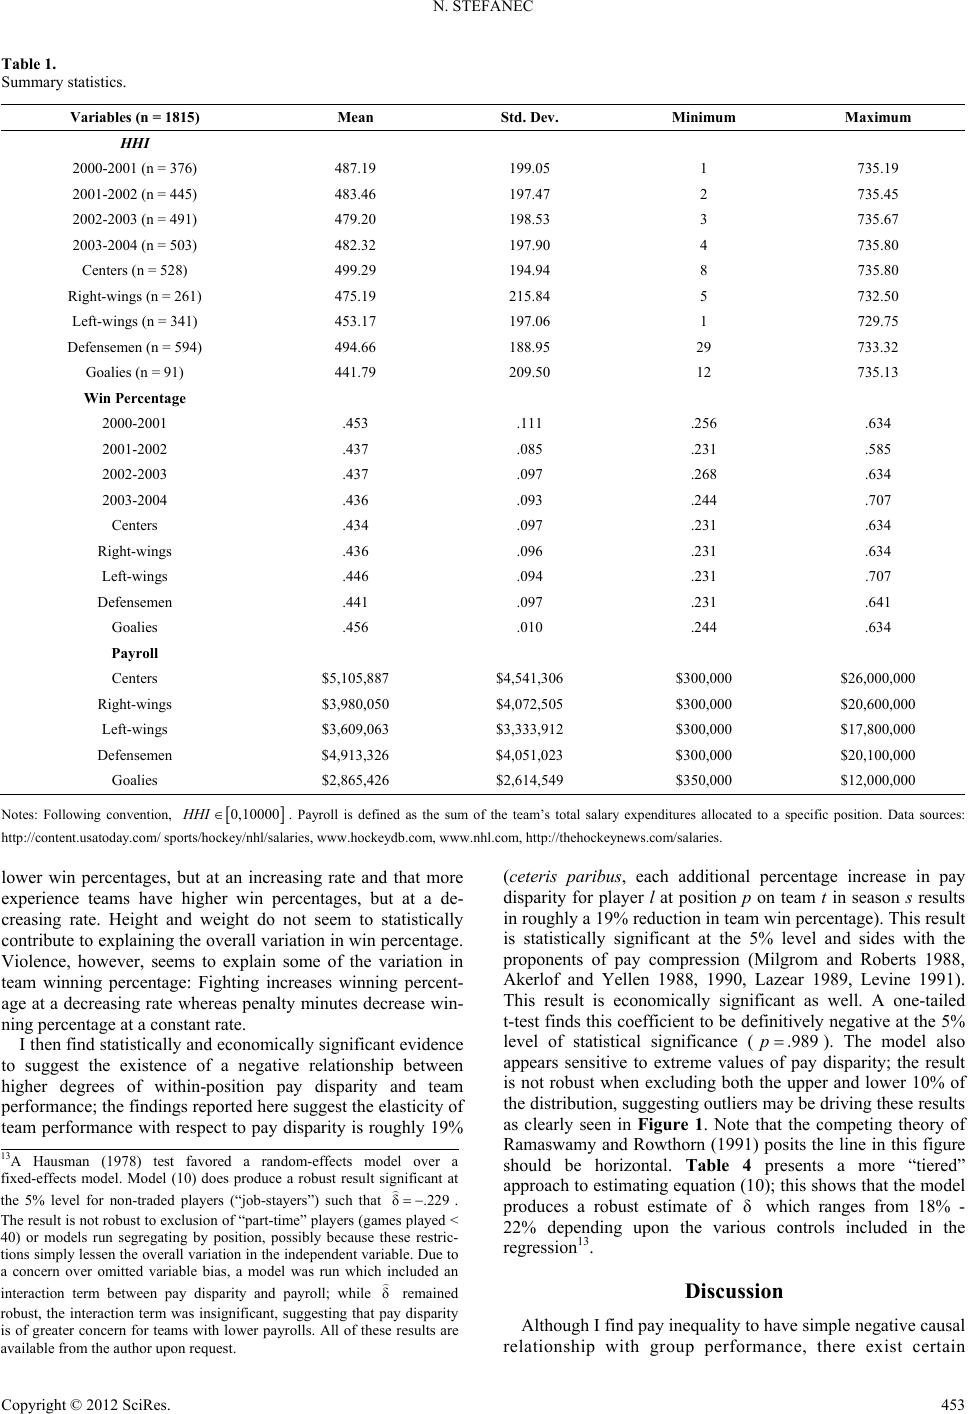 N. STEFANEC Copyright © 2012 SciRes. 453 Table 1. Summary statistics. Variables (n = 1815) Mean Std. Dev. Minimum Maximum HHI 2000-2001 (n = 376) 487.19 199.05 1 735.19 2001-2002 (n = 445) 483.46 197.47 2 735.45 2002-2003 (n = 491) 479.20 198.53 3 735.67 2003-2004 (n = 503) 482.32 197.90 4 735.80 Centers (n = 528) 499.29 194.94 8 735.80 Right-wings (n = 261) 475.19 215.84 5 732.50 Left-wings (n = 341) 453.17 197.06 1 729.75 Defensemen (n = 594) 494.66 188.95 29 733.32 Goalies (n = 91) 441.79 209.50 12 735.13 Win Percentage 2000-2001 .453 .111 .256 .634 2001-2002 .437 .085 .231 .585 2002-2003 .437 .097 .268 .634 2003-2004 .436 .093 .244 .707 Centers .434 .097 .231 .634 Right-wings .436 .096 .231 .634 Left-wings .446 .094 .231 .707 Defensemen .441 .097 .231 .641 Goalies .456 .010 .244 .634 Payroll Centers $5,105,887 $4,541,306 $300,000 $26,000,000 Right-wings $3,980,050 $4,072,505 $300,000 $20,600,000 Left-wings $3,609,063 $3,333,912 $300,000 $17,800,000 Defensemen $4,913,326 $4,051,023 $300,000 $20,100,000 Goalies $2,865,426 $2,614,549 $350,000 $12,000,000 Notes: Following convention, 0,10000HHI .989p δ . Payroll is defined as the sum of the team’s total salary expenditures allocated to a specific position. Data sources: http://content.usatoday.com/ sports/hockey/nhl/salaries, www.hockeydb.com, www.nhl.com, http://thehockeynews.com/salaries. lower win percentages, but at an increasing rate and that more experience teams have higher win percentages, but at a de- creasing rate. Height and weight do not seem to statistically contribute to explaining the overall variation in win percentage. Violence, however, seems to explain some of the variation in team winning percentage: Fighting increases winning percent- age at a decreasing rate whereas penalty minutes decrease win- ning percentage at a constant rate. I then find statistically and economically significant evidence to suggest the existence of a negative relationship between higher degrees of within-position pay disparity and team performance; the findings reported here suggest the elasticity of team performance with respect to pay disparity is roughly 19% (ceteris paribus, each additional percentage increase in pay disparity for player l at position p on team t in season s results in roughly a 19% reduction in team win percentage). This result is statistically significant at the 5% level and sides with the proponents of pay compression (Milgrom and Roberts 1988, Akerlof and Yellen 1988, 1990, Lazear 1989, Levine 1991). This result is economically significant as well. A one-tailed t-test finds this coefficient to be definitively negative at the 5% level of statistical significance (). The model also appears sensitive to extreme values of pay disparity; the result is not robust when excluding both the upper and lower 10% of the distribution, suggesting outliers may be driving these results as clearly seen in Figure 1. Note that the competing theory of Ramaswamy and Rowthorn (1991) posits the line in this figure should be horizontal. Table 4 presents a more “tiered” approach to estimating equation (10); this shows that the model produces a robust estimate of which ranges from 18% - 22% depending upon the various controls included in the regression13. 13A Hausman (1978) test favored a random-effects model over a fixed-effects model. Model (10) does produce a robust result significant at the 5% level for non-traded players (“job-stayers”) such that δ.229 . The result is not robust to exclusion of “part-time” players (games played < 40) or models run segregating by position, possibly because these restric- tions simply lessen the overall variation in the independent variable. Due to a concern over omitted variable bias, a model was run which included an interaction term between pay disparity and payroll; while δ remained robust, the interaction term was insignificant, suggesting that pay disparity is of greater concern for teams with lower payrolls. All of these results are available from the author upon request. Discussion Although I find pay inequality to have simple negative causal relationship with group performance, there exist certain 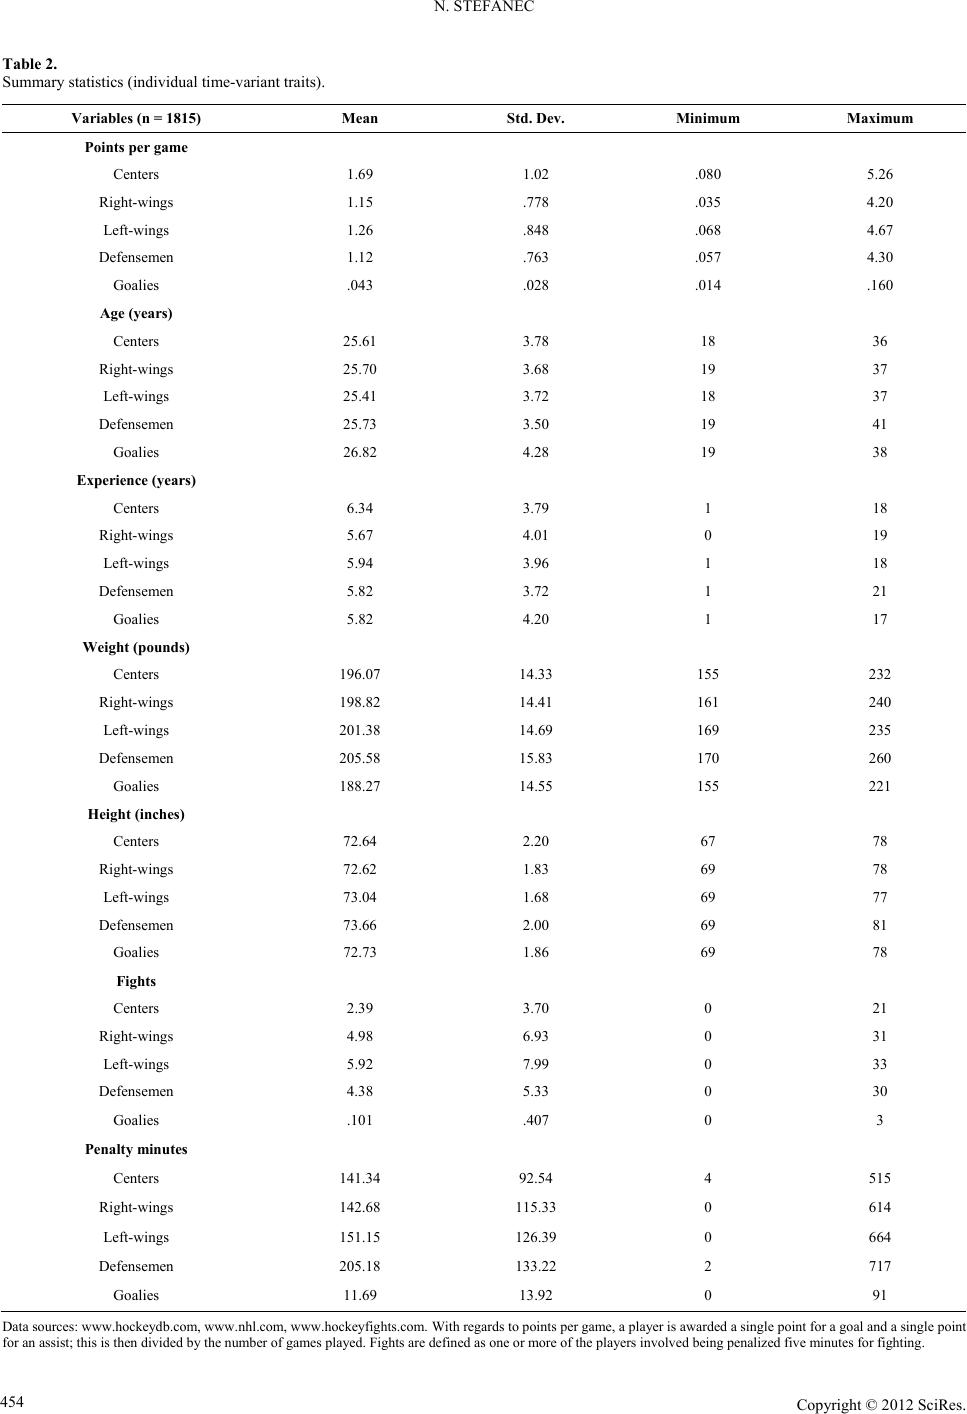 N. STEFANEC Table 2. Summary statistics (individual time-variant traits). Variables (n = 1815) Mean Std. Dev. Minimum Maximum Points per game Centers 1.69 1.02 .080 5.26 Right-wings 1.15 .778 .035 4.20 Left-wings 1.26 .848 .068 4.67 Defensemen 1.12 .763 .057 4.30 Goalies .043 .028 .014 .160 Age (years) Centers 25.61 3.78 18 36 Right-wings 25.70 3.68 19 37 Left-wings 25.41 3.72 18 37 Defensemen 25.73 3.50 19 41 Goalies 26.82 4.28 19 38 Experience (years) Centers 6.34 3.79 1 18 Right-wings 5.67 4.01 0 19 Left-wings 5.94 3.96 1 18 Defensemen 5.82 3.72 1 21 Goalies 5.82 4.20 1 17 Weight (pounds) Centers 196.07 14.33 155 232 Right-wings 198.82 14.41 161 240 Left-wings 201.38 14.69 169 235 Defensemen 205.58 15.83 170 260 Goalies 188.27 14.55 155 221 Height (inches) Centers 72.64 2.20 67 78 Right-wings 72.62 1.83 69 78 Left-wings 73.04 1.68 69 77 Defensemen 73.66 2.00 69 81 Goalies 72.73 1.86 69 78 Fights Centers 2.39 3.70 0 21 Right-wings 4.98 6.93 0 31 Left-wings 5.92 7.99 0 33 Defensemen 4.38 5.33 0 30 Goalies .101 .407 0 3 Penalty minutes Centers 141.34 92.54 4 515 Right-wings 142.68 115.33 0 614 Left-wings 151.15 126.39 0 664 Defensemen 205.18 133.22 2 717 Goalies 11.69 13.92 0 91 Data sources: www.hockeydb.com, www.nhl.com, www.hockeyfights.com. With regards to points per game, a player is awarded a single point for a goal and a single point for an assist; this is then divided by the number of games played. Fights are defined as one or more of the players involved being penalized five minutes for fighting. Copyright © 2012 SciRes. 454 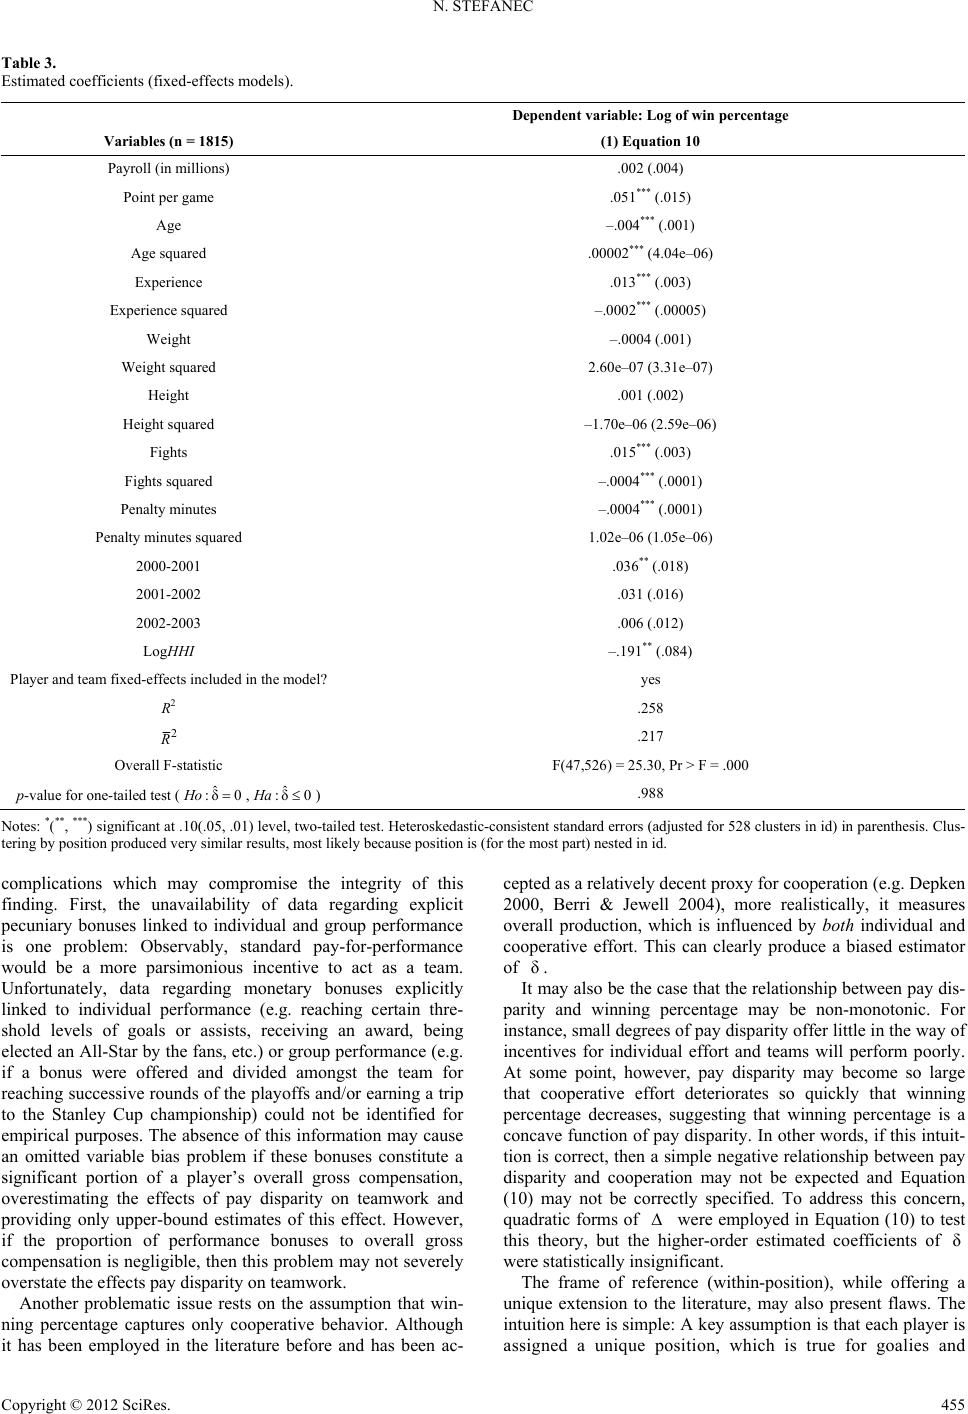 N. STEFANEC Table 3. Estimated coefficients (fixed-effects models). Dependent variable: Log of win percentage Variables (n = 1815) (1) Equation 10 Payroll (in millions) .002 (.004) Point per game .051*** (.015) Age –.004*** (.001) Age squared .00002*** (4.04e–06) Experience .013*** (.003) Experience squared –.0002*** (.00005) Weight –.0004 (.001) Weight squared 2.60e–07 (3.31e–07) Height .001 (.002) Height squared –1.70e–06 (2.59e–06) Fights .015*** (.003) Fights squared –.0004*** (.0001) Penalty minutes –.0004*** (.0001) Penalty minutes squared 1.02e–06 (1.05e–06) 2000-2001 .036** (.018) 2001-2002 .031 (.016) 2002-2003 .006 (.012) LogHHI –.191** (.084) Player and team fixed-effects included in the model? yes R2 .258 2 R ˆ δ0ˆ :δ0Ha .217 Overall F-statistic F(47,526) = 25.30, Pr > F = .000 p-value for one-tailed test (, ) :Ho.988 Notes: *(**, ***) significant at .10(.05, .01) level, two-tailed test. Heteroskedastic-consistent standard errors (adjusted for 528 clusters in id) in parenthesis. Clus- tering by position produced very similar results, most likely because position is (for the most part) nested in id. complications which may compromise the integrity of this finding. First, the unavailability of data regarding explicit pecuniary bonuses linked to individual and group performance is one problem: Observably, standard pay-for-performance would be a more parsimonious incentive to act as a team. Unfortunately, data regarding monetary bonuses explicitly linked to individual performance (e.g. reaching certain thre- shold levels of goals or assists, receiving an award, being elected an All-Star by the fans, etc.) or group performance (e.g. if a bonus were offered and divided amongst the team for reaching successive rounds of the playoffs and/or earning a trip to the Stanley Cup championship) could not be identified for empirical purposes. The absence of this information may cause an omitted variable bias problem if these bonuses constitute a significant portion of a player’s overall gross compensation, overestimating the effects of pay disparity on teamwork and providing only upper-bound estimates of this effect. However, if the proportion of performance bonuses to overall gross compensation is negligible, then this problem may not severely overstate the effects pay disparity on teamwork. Another problematic issue rests on the assumption that win- ning percentage captures only cooperative behavior. Although it has been employed in the literature before and has been ac- cepted as a relatively decent proxy for cooperation (e.g. Depken 2000, Berri & Jewell 2004), more realistically, it measures overall production, which is influenced by both individual and cooperative effort. This can clearly produce a biased estimator of . δ It may also be the case that the relationship between pay dis- parity and winning percentage may be non-monotonic. For instance, small degrees of pay disparity offer little in the way of incentives for individual effort and teams will perform poorly. At some point, however, pay disparity may become so large that cooperative effort deteriorates so quickly that winning percentage decreases, suggesting that winning percentage is a concave function of pay disparity. In other words, if this intuit- tion is correct, then a simple negative relationship between pay disparity and cooperation may not be expected and Equation (10) may not be correctly specified. To address this concern, quadratic forms of were employed in Equation (10) to test this theory, but the higher-order estimated coefficients of were statistically insignificant. δ The frame of reference (within-position), while offering a unique extension to the literature, may also present flaws. The intuition here is simple: A key assumption is that each player is assigned a unique position, which is true for goalies and Copyright © 2012 SciRes. 455 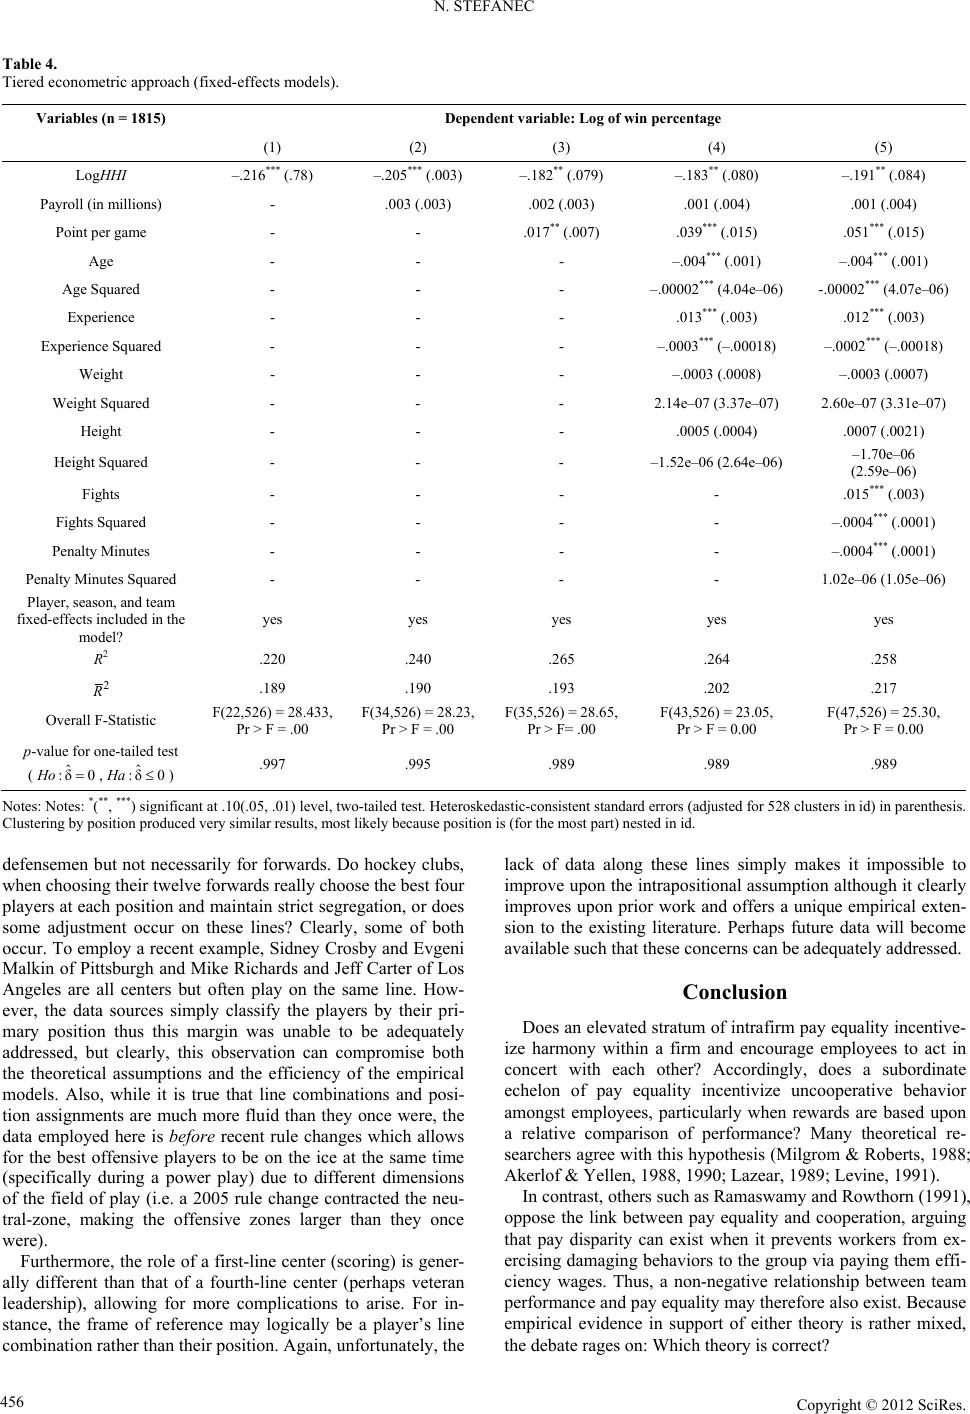 N. STEFANEC Table 4. Tiered econometric approach (fixed-effects models). Variables (n = 1815) Dependent variable: Log of win percentage (1) (2) (3) (4) (5) LogHHI –.216*** (.78) –.205*** (.003) –.182** (.079) –.183** (.080) –.191** (.084) Payroll (in millions) - .003 (.003) .002 (.003) .001 (.004) .001 (.004) Point per game - - .017** (.007) .039*** (.015) .051*** (.015) Age - - - –.004*** (.001) –.004*** (.001) Age Squared - - - –.00002*** (4.04e–06) -.00002*** (4.07e–06) Experience - - - .013*** (.003) .012*** (.003) Experience Squared - - - –.0003*** (–.00018) –.0002*** (–.00018) Weight - - - –.0003 (.0008) –.0003 (.0007) Weight Squared - - - 2.14e–07 (3.37e–07) 2.60e–07 (3.31e–07) Height - - - .0005 (.0004) .0007 (.0021) Height Squared - - - –1.52e–06 (2.64e–06) –1.70e–06 (2.59e–06) Fights - - - - .015*** (.003) Fights Squared - - - - –.0004*** (.0001) Penalty Minutes - - - - –.0004*** (.0001) Penalty Minutes Squared - - - - 1.02e–06 (1.05e–06) Player, season, and team fixed-effects included in the model? yes yes yes yes yes R2 .220 .240 .265 .264 .258 2 R ˆ δ0ˆ :δ0Ha .189 .190 .193 .202 .217 Overall F-Statistic F(22,526) = 28.433, Pr > F = .00 F(34,526) = 28.23, Pr > F = .00 F(35,526) = 28.65, Pr > F= .00 F(43,526) = 23.05, Pr > F = 0.00 F(47,526) = 25.30, Pr > F = 0.00 p-value for one-tailed test ( , ) :Ho.997 .995 .989 .989 .989 Notes: Notes: *(**, ***) significant at .10(.05, .01) level, two-tailed test. Heteroskedastic-consistent standard errors (adjusted for 528 clusters in id) in parenthesis. Clustering by position produced very similar results, most likely because position is (for the most part) nested in id. defensemen but not necessarily for forwards. Do hockey clubs, when choosing their twelve forwards really choose the best four players at each position and maintain strict segregation, or does some adjustment occur on these lines? Clearly, some of both occur. To employ a recent example, Sidney Crosby and Evgeni Malkin of Pittsburgh and Mike Richards and Jeff Carter of Los Angeles are all centers but often play on the same line. How- ever, the data sources simply classify the players by their pri- mary position thus this margin was unable to be adequately addressed, but clearly, this observation can compromise both the theoretical assumptions and the efficiency of the empirical models. Also, while it is true that line combinations and posi- tion assignments are much more fluid than they once were, the data employed here is before recent rule changes which allows for the best offensive players to be on the ice at the same time (specifically during a power play) due to different dimensions of the field of play (i.e. a 2005 rule change contracted the neu- tral-zone, making the offensive zones larger than they once were). Furthermore, the role of a first-line center (scoring) is gener- ally different than that of a fourth-line center (perhaps veteran leadership), allowing for more complications to arise. For in- stance, the frame of reference may logically be a player’s line combination rather than their position. Again, unfortunately, the lack of data along these lines simply makes it impossible to improve upon the intrapositional assumption although it clearly improves upon prior work and offers a unique empirical exten- sion to the existing literature. Perhaps future data will become available such that these concerns can be adequately addressed. Conclusion Does an elevated stratum of intrafirm pay equality incentive- ize harmony within a firm and encourage employees to act in concert with each other? Accordingly, does a subordinate echelon of pay equality incentivize uncooperative behavior amongst employees, particularly when rewards are based upon a relative comparison of performance? Many theoretical re- searchers agree with this hypothesis (Milgrom & Roberts, 1988; Akerlof & Yellen, 1988, 1990; Lazear, 1989; Levine, 1991). In contrast, others such as Ramaswamy and Rowthorn (1991), oppose the link between pay equality and cooperation, arguing that pay disparity can exist when it prevents workers from ex- ercising damaging behaviors to the group via paying them effi- ciency wages. Thus, a non-negative relationship between team performance and pay equality may therefore also exist. Because empirical evidence in support of either theory is rather mixed, the debate rages on: Which theory is correct? Copyright © 2012 SciRes. 456  N. STEFANEC This paper seeks to adjoin to the debate by employing sports data, particularly regarding that of professional hockey players. Hockey data is somewhat unique in that the frame of reference regarding pay disparity can be narrowed from the aggregate firm-level down to an intrapositional level. Here, I employ an unbalanced panel of data from the National Hockey League (NHL) encompassing observations over four seasons and utilize a panel-data based empirical approach to examine the impact of pay disparity on cooperation. I find evidence to suggest the existence of a negative relationship between higher degrees of within-position pay disparity and team performance; the evi- dence reported here shows the elasticity of team performance with respect to pay disparity to be roughly 19%. REFERENCES Akerlof, G., & Yellen, T. (1990). The fair wage/effort hypothesis and unemployment. The Quarterly Journal of Economics, 105, 255-283. doi:10.2307/2937787 Akerlof, G., & Yellen, T. (1988). Fairness and unemployment. Ameri- can Economic Review, 78, 44-49. Berri, D., & Jewell, T. (2004) Wage inequality and firm performance: Professional basketball’s natural experiment. Atlantic Economic Journal, 32, 130-139. doi:10.1007/BF02298830 Bernstein, R. (2006). The code: The unwritten rules of fighting and retaliation in the NHL. Triumph Books. CBC Sports (2008). NHLer avery to sit 6 games for controversial re- mark. Curme, M., & Daugherty, G. (2004). Competition and pay for national hockey league players born in Quebec. Journal of Sports Economics, 5, 186-205. doi:10.1177/1527002503257188 Depken, C. (2000). Wage disparity and team productivity: Evidence from major league baseball. Economics Letters, 67, 87-92. doi:10.1016/S0165-1765(99)00249-9 Duthie, J. (2008). Avery’s teammates hope “indefinitely” means “for- ever”. The Sports Network, 3 December 2008. Easton, S., & Rockerbie, D. W. (2005). Overtime! Rules and incentives in the National Hockey League, Journal of Sports Economics, 6, 359-378. doi:10.1177/1527002504267520 Ehrenberg, R., & Bognanno, M. (1990a). Do tournaments have incen- tive effects? The Journal of Political Economy, 98, 1307-1324. doi:10.1086/261736 Ehrenberg, R., & Bognanno, M. (1990b). The incentive effects of tour- naments revisited: Evidence from the European PGA tour. Industrial and Labor Relations Review, 43, 74S-88S. Freeman, R., & Bell, L. (1999). Does inequality induce us to work more? MacArthur Social Interactions and Economic Inequality Net- work Meeting, 15 January 1999. Garcicano, L., & Palacios-Huerta, I. (2006). Sabotage in tournaments: Making the beautiful game a bit lessbeautiful. CEPR Discussion Pa- pers, 5231. Hiasken-DeNew, J., & Vorell, M. (2008). Blood money: Incentives for violence in NHL hockey. Ruhr Economic Paper No. 47. Hausman, J. (1978). Specification tests in econometrics. Econometrica 46, 1251-1271. doi:10.2307/1913827 Jones, J. C. H., & Walsh, W. (1988). Salary determination in the na- tional hockey league: The effects of skills, franchise characteristics, and discrimination. Industrial and Labor Relations Review, 41, 592- 604. doi:10.2307/2523593 Kerr, S. (1975). On the folly of rewarding A while hoping for B. Academy of Management Journal, 18, 769-783. doi:10.2307/255378 Kesenne, S. (1996). League management in professional team sports with win maximizing clubs. Journal of Sports Economics, 1, 56-65. doi:10.1177/152700250000100105 Kesenne, S. (2006). The win maximization model reconsidered: Flexi- ble talent supply and efficiency wage. Journal of Sports Economics, 7, 416-427. doi:10.1177/1527002505279347 Krashinsky, M., & Krashinsky, H. (1997). Do English Canadian hockey teams discriminate against French Canadian players? Canadian Pub- lic Policy, 23, 212-216. doi:10.2307/3551487 Lavoie, M., Grenier, G., & Coulombe, S. (1987). Discrimination and performance differentials in the national hockey league. Canadian Public Policy, 13, 407-422. doi:10.2307/3550883 Lazear, E. (1989). Pay equality and industrial politics. Journal of Po- litical Economy, 97, 561-580. doi:10.1086/261616 Lazear, E. (2000). Performance pay and productivity. American Eco- nomic Review, 90, 1346-1361. doi:10.1257/aer.90.5.1346 Lazear, E., & Rosen, S. (1981). Rank-order tournaments as optimum labor contracts. Journal of PoliticalEconomy, 89, 841-864. doi:10.1086/261010 Lazear, E. (1986). Salaries and piece-rates. The Journal of Business, 59, 405-431. doi:10.1086/296345 Lefgen, L., Price, J., & Tappen, H. (2009). Interracial workplace coop- eration: Evidence from the NBA. SOLE Conference Program Friday, 8 May 2009. Levine, D. (1991). Cohesiveness, productivity, and wage dispersion, Journal of Economic Behavior and Organization, 15, 237-255. doi:10.1016/0167-2681(91)90031-R Longley, N. (1997). Do English Canadian hockey teams discriminate against French Canadian players? A Reply. Canadian Public Policy, 23, 217-220. doi:10.2307/3551488 Longley, N. (1995). Salary discrimination in the national hockey league: The effects of team location. Canadian Public Policy, 21, 413-422. doi:10.2307/3551339 Mclean, R., & Veall, M. (1992). Performance and salary differentials in the national hockey league. Canadian Public Policy, 18, 470-475. doi:10.2307/3551660 Milgrom, P., & Roberts, J. (1988). An economic approach to influence activities in organizations. American Journal of Sociology, 94, S154- S179. Mincer, J. (1974). Schooling, experience, and earnings. New York: National Bureau of Economic Research, Columbia University Press. Player Poll Results (2007). The Hockey News. Ramaswamy, R., & Rowthorn, R. (1991). Efficiency wage and wage dispersion. Economica, 58, 510-514. doi:10.2307/2554695 Rosen, S. (1981). The economics of superstars. American Economic Review, 71, 845-858. Shmanske, S., & Lowenthal, F. (2007). Overtime incentives in the National Hockey League (NHL): More evidence. Journal of Sports Economics, 8, 435-442. doi:10.1177/1527002506292581 Staudohar, P. (2005). The hockey lockout of 2004-2005. Monthly La- bor Review, 23-29 December 2005. Wawrow, J. (2008). Russian league accuses NHL of breaking deal. AP, 4 September 2008. Copyright © 2012 SciRes. 457
|