Paper Menu >>
Journal Menu >>
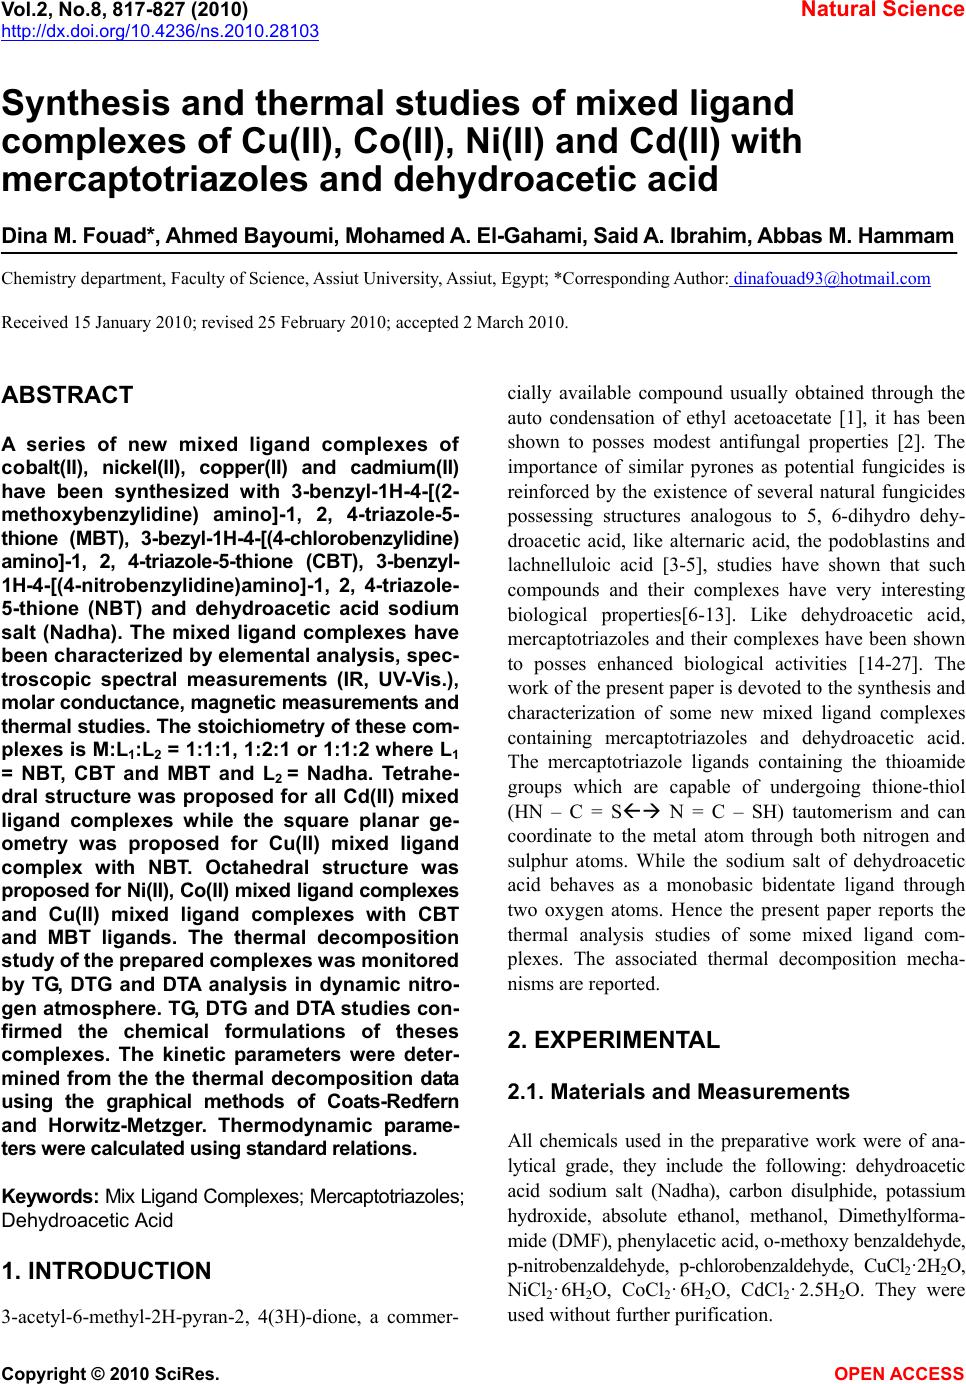 Vol.2, No.8, 817-827 (2010) Natural Science http://dx.doi.org/10.4236/ns.2010.28103 Copyright © 2010 SciRes. OPEN ACCESS Synthesis and thermal studies of mixed ligand complexes of Cu(II), Co(II), Ni(II) and Cd(II) with mercaptotriazoles and dehydroacetic acid Dina M. Fouad*, Ahmed Bayoumi, Mohamed A. El-Gahami, Said A. Ibrahim, Abbas M. Hammam Chemistry department, Faculty of Science, Assiut University, Assiut, Egypt; *Corresponding Author: dinafouad93@hotmail.com Received 15 January 2010; revised 25 February 2010; accepted 2 March 2010. ABSTRACT A series of new mixed ligand complexes of cobalt(II), nickel(II), copper(II) and cadmium(II) have been synthesized with 3-benzyl-1H-4-[(2- methoxybenzylidine) amino]-1, 2, 4-triazole-5- thione (MBT), 3-bezyl-1H-4-[(4-chlorobenzylidine) amino]-1, 2, 4-triazole-5-thione (CBT), 3-benzyl- 1H-4-[(4-nitrobenzylidine)amino]-1, 2, 4-triazole- 5-thione (NBT) and dehydroacetic acid sodium salt (Nadha). The mixed ligand complexes have been characterized by elemental analysis, spec- troscopic spectral measurements (IR, UV-Vis.), molar conductance, magnetic measurements and thermal studies. The stoichiometry of these com- plexes is M:L1:L2 = 1:1:1, 1:2:1 or 1:1:2 where L1 = NBT, CBT and MBT and L2 = Nadha. Tetrahe- dral structure was proposed for all Cd(II) mixed ligand complexes while the square planar ge- ometry was proposed for Cu(II) mixed ligand complex with NBT. Octahedral structure was proposed for Ni(II), Co(II) mixed ligand complexes and Cu(II) mixed ligand complexes with CBT and MBT ligands. The thermal decomposition study of the prepared complexes was monitored by TG, DTG and DTA analysis in dynamic nitro- gen atmosphere. TG, DTG and DTA studies con- firmed the chemical formulations of theses complexes. The kinetic parameters were deter- mined from the the thermal decomposition data using the graphical methods of Coats-Redfern and Horwitz-Metzger. Thermodynamic parame- ters were calculated using standard relations. Keywords: Mix Ligand Complexes; Mercaptotriazoles; Dehydroacetic Acid 1. INTRODUCTION 3-acetyl-6-methyl-2H-pyran-2, 4(3H)-dione, a commer- cially available compound usually obtained through the auto condensation of ethyl acetoacetate [1], it has been shown to posses modest antifungal properties [2]. The importance of similar pyrones as potential fungicides is reinforced by the existence of several natural fungicides possessing structures analogous to 5, 6-dihydro dehy- droacetic acid, like alternaric acid, the podoblastins and lachnelluloic acid [3-5], studies have shown that such compounds and their complexes have very interesting biological properties[6-13]. Like dehydroacetic acid, mercaptotriazoles and their complexes have been shown to posses enhanced biological activities [14-27]. The work of the present paper is devoted to the synthesis and characterization of some new mixed ligand complexes containing mercaptotriazoles and dehydroacetic acid. The mercaptotriazole ligands containing the thioamide groups which are capable of undergoing thione-thiol (HN – C = S N = C – SH) tautomerism and can coordinate to the metal atom through both nitrogen and sulphur atoms. While the sodium salt of dehydroacetic acid behaves as a monobasic bidentate ligand through two oxygen atoms. Hence the present paper reports the thermal analysis studies of some mixed ligand com- plexes. The associated thermal decomposition mecha- nisms are reported. 2. EXPERIMENTAL 2.1. Materials and Measurements All chemicals used in the preparative work were of ana- lytical grade, they include the following: dehydroacetic acid sodium salt (Nadha), carbon disulphide, potassium hydroxide, absolute ethanol, methanol, Dimethylforma- mide (DMF), phenylacetic acid, o-methoxy benzaldehyde, p-nitrobenzaldehyde, p-chlorobenzaldehyde, CuCl2·2H2O, NiCl2· 6H2O, CoCl2· 6H2O, CdCl2· 2.5H2O. They were used without further purification. 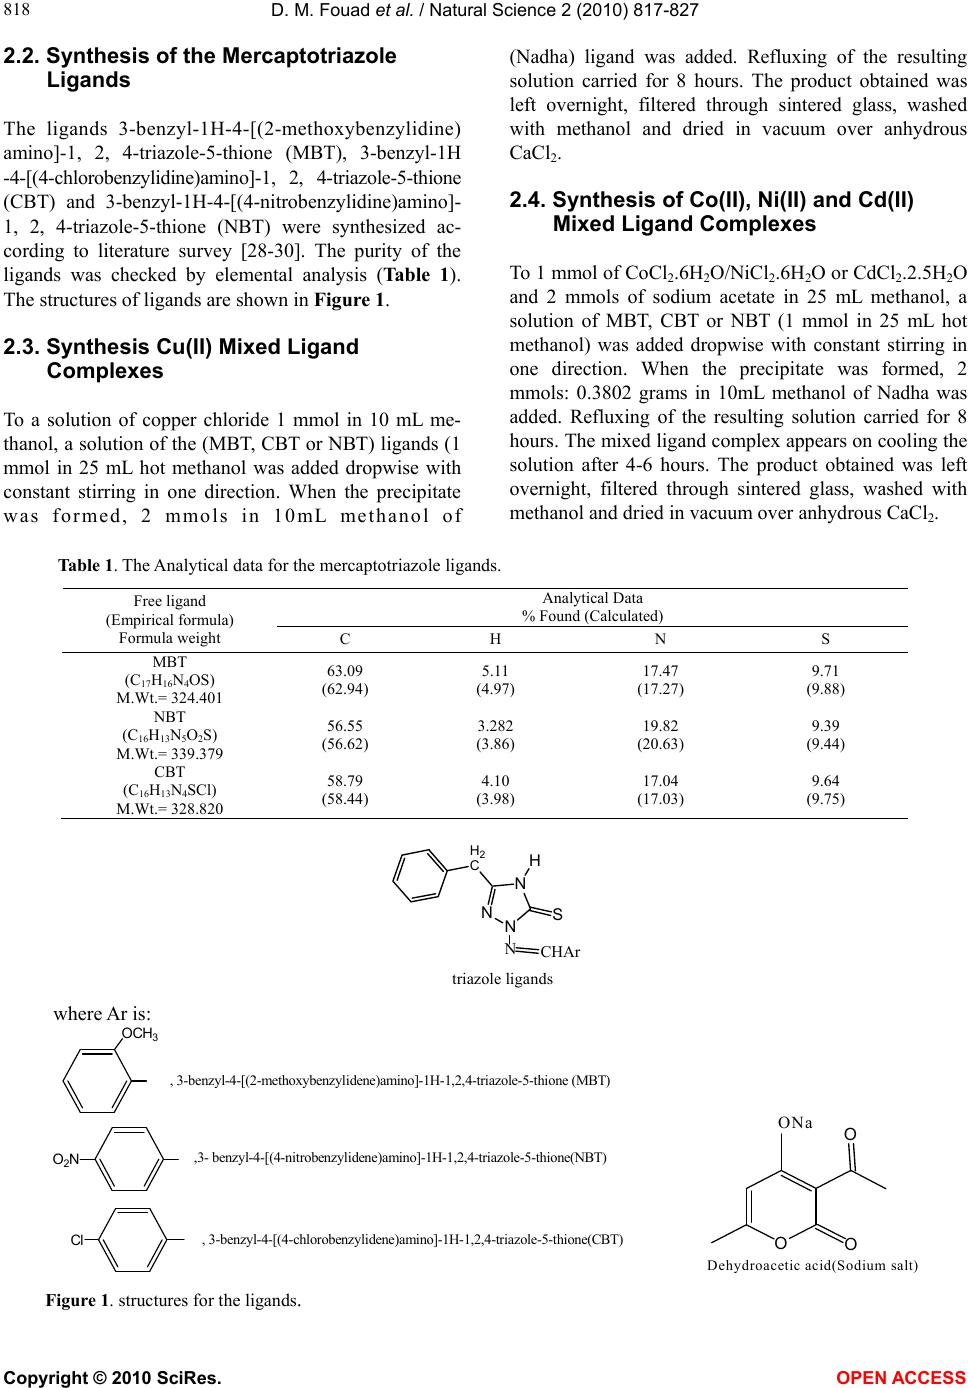 D. M. Fouad et al. / Natural Science 2 (2010) 817-827 Copyright © 2010 SciRes. OPEN ACCESS 818 2.2. Synthesis of the Mercaptotriazole Ligands The ligands 3-benzyl-1H-4-[(2-methoxybenzylidine) amino]-1, 2, 4-triazole-5-thione (MBT), 3-benzyl-1H -4-[(4-chlorobenzylidine)amino]-1, 2, 4-triazole-5-thione (CBT) and 3-benzyl-1H-4-[(4-nitrobenzylidine)amino]- 1, 2, 4-triazole-5-thione (NBT) were synthesized ac- cording to literature survey [28-30]. The purity of the ligands was checked by elemental analysis (Table 1). The structures of ligands are shown in Figure 1. 2.3. Synthesis Cu(II) Mixed Ligand Complexes To a solution of copper chloride 1 mmol in 10 mL me- thanol, a solution of the (MBT, CBT or NBT) ligands (1 mmol in 25 mL hot methanol was added dropwise with constant stirring in one direction. When the precipitate was formed, 2 mmols in 10mL methanol of (Nadha) ligand was added. Refluxing of the resulting solution carried for 8 hours. The product obtained was left overnight, filtered through sintered glass, washed with methanol and dried in vacuum over anhydrous CaCl2. 2.4. Synthesis of Co(II), Ni(II) and Cd(II) Mixed Ligand Complexes To 1 mmol of CoCl2.6H2O/NiCl2.6H2O or CdCl2.2.5H2O and 2 mmols of sodium acetate in 25 mL methanol, a solution of MBT, CBT or NBT (1 mmol in 25 mL hot methanol) was added dropwise with constant stirring in one direction. When the precipitate was formed, 2 mmols: 0.3802 grams in 10mL methanol of Nadha was added. Refluxing of the resulting solution carried for 8 hours. The mixed ligand complex appears on cooling the solution after 4-6 hours. The product obtained was left overnight, filtered through sintered glass, washed with methanol and dried in vacuum over anhydrous CaCl2. Table 1. The Analytical data for the mercaptotriazole ligands. Analytical Data % Found (Calculated) Free ligand (Empirical formula) Formula weight C H N S MBT (C17H16N4OS) M.Wt.= 324.401 63.09 (62.94) 5.11 (4.97) 17.47 (17.27) 9.71 (9.88) NBT (C16H13N5O2S) M.Wt.= 339.379 56.55 (56.62) 3.282 (3.86) 19.82 (20.63) 9.39 (9.44) CBT (C16H13N4SCl) M.Wt.= 328.820 58.79 (58.44) 4.10 (3.98) 17.04 (17.03) 9.64 (9.75) N N N S H H2 C CHAr N triazole ligands where Ar is: OCH3 , 3-benzyl-4-[(2-methoxybenzylidene)amino]-1H-1,2,4-triazole-5-thione (MBT) O2N,3- benzyl-4-[(4-nitrobenzylidene)amino]-1H-1,2,4-triazole-5-thione(NBT) Cl , 3-benzyl-4-[(4-chlorobenzylidene)amino]-1H-1,2,4-triazole-5-thione(CBT) OO O ONa Dehydroacetic acid(Sodium salt) Figure 1. structures for the ligands. 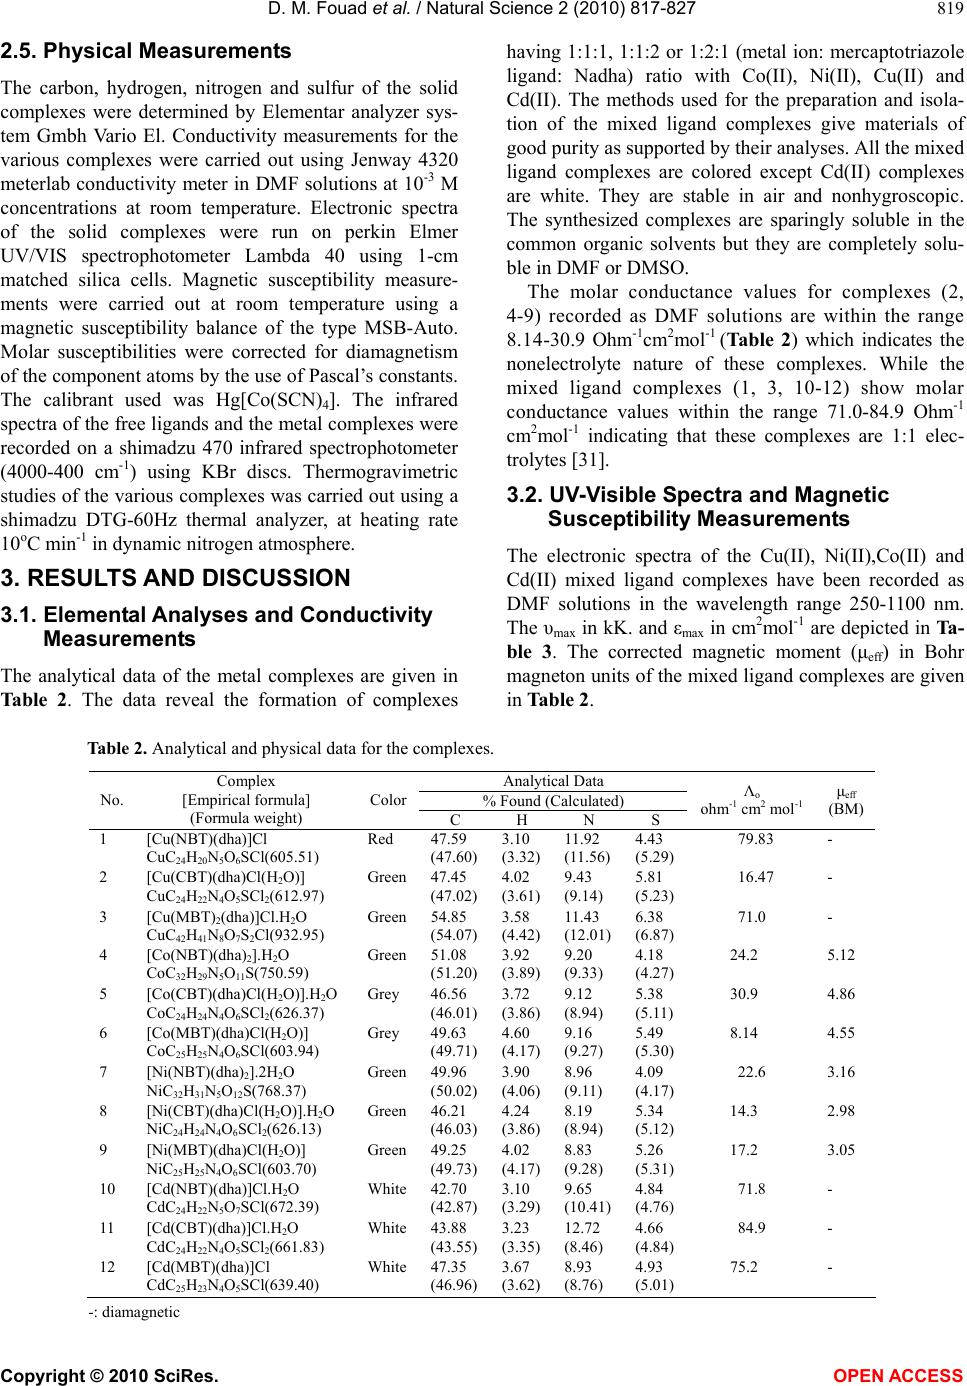 D. M. Fouad et al. / Natural Science 2 (2010) 817-827 Copyright © 2010 SciRes. OPEN ACCESS 819 2.5. Physical Measurements The carbon, hydrogen, nitrogen and sulfur of the solid complexes were determined by Elementar analyzer sys- tem Gmbh Vario El. Conductivity measurements for the various complexes were carried out using Jenway 4320 meterlab conductivity meter in DMF solutions at 10-3 M concentrations at room temperature. Electronic spectra of the solid complexes were run on perkin Elmer UV/VIS spectrophotometer Lambda 40 using 1-cm matched silica cells. Magnetic susceptibility measure- ments were carried out at room temperature using a magnetic susceptibility balance of the type MSB-Auto. Molar susceptibilities were corrected for diamagnetism of the component atoms by the use of Pascal’s constants. The calibrant used was Hg[Co(SCN)4]. The infrared spectra of the free ligands and the metal complexes were recorded on a shimadzu 470 infrared spectrophotometer (4000-400 cm-1) using KBr discs. Thermogravimetric studies of the various complexes was carried out using a shimadzu DTG-60Hz thermal analyzer, at heating rate 10oC min-1 in dynamic nitrogen atmosphere. 3. RESULTS AND DISCUSSION 3.1. Elemental Analyses and Conductivity Measurements The analytical data of the metal complexes are given in Table 2. The data reveal the formation of complexes having 1:1:1, 1:1:2 or 1:2:1 (metal ion: mercaptotriazole ligand: Nadha) ratio with Co(II), Ni(II), Cu(II) and Cd(II). The methods used for the preparation and isola- tion of the mixed ligand complexes give materials of good purity as supported by their analyses. All the mixed ligand complexes are colored except Cd(II) complexes are white. They are stable in air and nonhygroscopic. The synthesized complexes are sparingly soluble in the common organic solvents but they are completely solu- ble in DMF or DMSO. The molar conductance values for complexes (2, 4-9) recorded as DMF solutions are within the range 8.14-30.9 Ohm-1cm2mol-1 (Table 2) which indicates the nonelectrolyte nature of these complexes. While the mixed ligand complexes (1, 3, 10-12) show molar conductance values within the range 71.0-84.9 Ohm-1 cm2mol-1 indicating that these complexes are 1:1 elec- trolytes [31]. 3.2. UV-Visible Spectra and Magnetic Susceptibility Measurements The electronic spectra of the Cu(II), Ni(II),Co(II) and Cd(II) mixed ligand complexes have been recorded as DMF solutions in the wavelength range 250-1100 nm. The υmax in kK. and εmax in cm2mol-1 are depicted in Ta- ble 3. The corrected magnetic moment (μeff) in Bohr magneton units of the mixed ligand complexes are given in Table 2. Table 2. Analytical and physical data for the complexes. Analytical Data % Found (Calculated) No. Complex [Empirical formula] (Formula weight) Color C H N S Λo ohm-1 cm2 mol-1 μeff (BM) 1 [Cu(NBT)(dha)]Cl CuC24H20N5O6SCl(605.51) Red 47.59 (47.60) 3.10 (3.32) 11.92 (11.56) 4.43 (5.29) 79.83 - 2 [Cu(CBT)(dha)Cl(H2O)] CuC24H22N4O5SCl2(612.97) Green47.45 (47.02) 4.02 (3.61) 9.43 (9.14) 5.81 (5.23) 16.47 - 3 [Cu(MBT)2(dha)]Cl.H2O CuC42H41N8O7S2Cl(932.95) Green54.85 (54.07) 3.58 (4.42) 11.43 (12.01) 6.38 (6.87) 71.0 - 4 [Co(NBT)(dha)2].H2O CoC32H29N5O11S(750.59) Green51.08 (51.20) 3.92 (3.89) 9.20 (9.33) 4.18 (4.27) 24.2 5.12 5 [Co(CBT)(dha)Cl(H2O)].H2O CoC24H24N4O6SCl2(626.37) Grey 46.56 (46.01) 3.72 (3.86) 9.12 (8.94) 5.38 (5.11) 30.9 4.86 6 [Co(MBT)(dha)Cl(H2O)] CoC25H25N4O6SCl(603.94) Grey 49.63 (49.71) 4.60 (4.17) 9.16 (9.27) 5.49 (5.30) 8.14 4.55 7 [Ni(NBT)(dha)2].2H2O NiC32H31N5O12S(768.37) Green49.96 (50.02) 3.90 (4.06) 8.96 (9.11) 4.09 (4.17) 22.6 3.16 8 [Ni(CBT)(dha)Cl(H2O)].H2O NiC24H24N4O6SCl2(626.13) Green46.21 (46.03) 4.24 (3.86) 8.19 (8.94) 5.34 (5.12) 14.3 2.98 9 [Ni(MBT)(dha)Cl(H2O)] NiC25H25N4O6SCl(603.70) Green49.25 (49.73) 4.02 (4.17) 8.83 (9.28) 5.26 (5.31) 17.2 3.05 10 [Cd(NBT)(dha)]Cl.H2O CdC24H22N5O7SCl(672.39) White42.70 (42.87) 3.10 (3.29) 9.65 (10.41) 4.84 (4.76) 71.8 - 11 [Cd(CBT)(dha)]Cl.H2O CdC24H22N4O5SCl2(661.83) White43.88 (43.55) 3.23 (3.35) 12.72 (8.46) 4.66 (4.84) 84.9 - 12 [Cd(MBT)(dha)]Cl CdC25H23N4O5SCl(639.40) White 47.35 (46.96) 3.67 (3.62) 8.93 (8.76) 4.93 (5.01) 75.2 - -: diamagnetic  D. M. Fouad et al. / Natural Science 2 (2010) 817-827 Copyright © 2010 SciRes. OPEN ACCESS 820 Table 3. Electronic spectral data of the synthesized mixed ligand complexes. No. Complex υ(k.K) (εmaxcm2mol-1) assignment 1 [Cu(NBT)(dha)]Cl 33.17(35140.84) 25.80(5948.31) 12.40(29.60) Intraligand LMCT 2B1g2A1g 2 [Cu(CBT)(dha)Cl(H2O)] 36.27(23049.82) 34.29(21219.11) 15.44(26.69) Intraligand Intraligand 2B1g2B2g, 2B1g2A1g, 2B1g2Eg 3 [Cu(MBT)2(dha)]Cl.H2O 36.93(53248.13) 30.79(25121.52) 13.33(48.33) Intraligand Intraligand 2B1g2B2g, 2B1g2A1g, 2B1g2Eg 4 [Co(NBT)(dha)2].H2O 34.85(84126.39) 26.91(20410.62) 17.24(143.6) Intraligand LMCT 4T1g(F) 4A2g(υ2), 4T1g(F)4T1g(P)(υ3) 5 [Co(CBT)(dha)Cl(H2O)].H2O 37.09(57420.32) 15.62(131.05) Intraligand 4T1g(F) 4A2g(υ2), 4T1g(F)4T1g(P)(υ3) 6 [Co(MBT)(dha)Cl(H2O)] 36.76(38944.24) 31.21(55761.13) 15.71(131.62) Intraligand Intraligand 4T1g(F) 4A2g(υ2), 4T1g(F)4T1g(P)(υ3) 7 [Ni(NBT)(dha)2].2H2O 32.30(45142.33) 22.42(56013.97) 15.89(118.74) Intraligand LMCT 3A2g(F)3T1g(F) 8 [Ni(CBT)(dha)Cl(H2O)].H2O 34.39(12535.04) 15.64(26.70) Intraligand 3A2g(F)3T1g(F) 9 [Ni(MBT)(dha)Cl(H2O)] 35.66(12174.10) 31.42(14453.81) 15.02(12.30) Intraligand Intraligand 3A2g(F)3T1g(F) 10 [Cd(NBT)(dha)]Cl.H2O 37.12(16417.18) 33.46(8509.42) 29.47(5046.47) Intraligand Intraligand LMCT 11 [Cd(CBT)(dha)]Cl.H2O 36.92(46607.37) 32.11(12100.81) 29.54(6728.32) Intraligand Intraligand LMCT 12 [Cd(MBT)(dha)]Cl 37.10(115683.04) 30.96(78832.13) Intraligand Intraligand Three sets of bands could be recognized in the elec- tronic spectra of the obtained mixed ligand complexes as listed in Table 3. The first set with υmax in the range 30.79-37.12 kK., could be attributed to intraligand charge transfer transitions [32]. The second set of in- cludes bands having υmax in the range 22.42-29.54 kK. These bands are assigned as LMCT transitions [32]. The third set of bands of Cu(II) complexes 2 and 3 have υmax at 15.44, 13.33 kK. and is assigned for a d-d transition which is typical for distorted octahderal Cu(II) complexes [33]. These bands are assigned to all the three transitions 2B1g2B2g, 2B1g2A1g and 2B1g2Eg [33]. While complex (1) shows an absorption d-d band at 12.40 kK. which has been attributed to 2B1g2A1g tran- sition suggesting square planar geometry [33,34]. The d-d transition bands observed for Co(II) mixed ligand complexes(4-6) are found to have υmax in the range 15.62-17.24 kK. could be attributed to 4T1g(F) 4A2g(υ2) and 4T1g(F)4T1g(P)(υ3) transitions, suggesting distorted octahedral environment around Co(II) ions [33,34]. The d-d transition bands observed for Ni(II) mixed li- gand complexes (7-9) are found to have υmax in the range 15.02-15.89 kK. could be attributed to 3A2g(F) 3T1g(F) transitions, suggesting octahedral geometry for the Ni(II) complexes [33]. All the mixed ligand Cd(II) complexes are diamag- netic as expected for d10 electronic configuration. On the basis of elemental analyses, infrared spectra, molar con- ductance values and thermal analyses, tetrahedral ge- ometry is proposed for all the complexes. The corrected magnetic moment values for Cu(II), Co(II) and Ni(II) mixed ligand complexes are reported in Table 2. All the Cu(II) mixed ligand complexes (1-3) display a dimagnetic nature which is attributed either to their polymeric nature or super exchange interaction [35]  D. M. Fouad et al. / Natural Science 2 (2010) 817-827 Copyright © 2010 SciRes. OPEN ACCESS 821 in the complex molecules and/or high polarizability [36] of the ligands which supplies more electron density to copper ion and consequently the ions interact more strongly. The room temperature magnetic moment values of the Co(II) mixed ligand complexes (4-6) are within the range 4.55-5.12 B.M. expected for octahedral Co(II) complexes [35,37]. These lower magnetic moment val- ues of the complexes may be attributed to the presence of low symmetry component in the ligand field as well as the covalent nature of the metal ligand bonds [38]. The room temperature magnetic moment values of Ni(II) mixed ligand complexes (7-9) are 3.16, 2.98 and 3.05 B.M., respectively suggesting octahedral geometry [37,39]. 3.3. IR Spectra Relevant IR bands that provide considerable structural evidence for the formation of mixed ligand complexes are reported in Table 4. The IR spectrum of the free (Nadha) ligand exhibit a series of significant IR absorption bands appearing in the vibrational regions at 1713, 1642 and 1252 cm-1 have been ascribed to the stretching vibrations of υ(C=O) lactone, υ(C=O)carbonyl and υ(C–O) phenolic, respec- tively [40,41]. In all the complexes υ(C=O) lactone re- mains unaltered while the other two peaks shift to lower frequency. This shift has been attributed to the coordina- tion of the ligand to form the mixed ligand complexes. NBT, CBT and MBT ligands show four bands at 1565-1588, 1275-1340, 1008-1040 and 780-815 cm-1 which are assignable to thioamide I, II, III, IV vibrations, respectively [42]. Theses bands have contributions from δ(C-H) + δ(N-H), υ(C=S) + υ(C-N) + δ(C-H), υ(C-N) + υ(C-S) and υ(C=S) modes of vibrations, respectively. These bands are expected to be affected differently by the modes of coordination to the metal ions. In the com- plexes, these bands shift to lower frequency suggesting the coordination of the sulfur atom to the metal ions [43]. All the ligands and their complexes show a band within the range 3102-3030 cm-1 which is attributed to υ(NH) vibration, indicating that the mercaptotriazole ligands and the complexes are in the thione form. The strongest bands observed in the range 1619-1625 cm-1 in the IR spectra of NBT, CBT and MBT ligands can be assigned to υ(C=N) vibrations of the azomethine group. This band in the complexes shifts to lower frequency indicating the coordination of the azomethine nitrogen to the metal ions. The bands observed in the region 480- 520 cm-1 may be assigned to υ(M-N) vibration [44]. The IR spectra of the mixed ligand complexes con- taining hydration and/or coordination water molecules display a broad band within the range 3340-3489 cm-1 due to υ(OH) vibrational modes of the water molecules [45] and this was confirmed by the results of thermal analysis. Figure 2 shows the Proposed structure for some mixed ligand complexes. 3.4. Thermal Decomposition Studies The measured curves obtained during TGA scanning were analysed to give the percentage mass loss as a function of temperature .The different kinetic parameters were computed from thermal decomposition data using Coats-Redfern. And Horwitz-Metger methods [46,47]. Thermodynamic parameters: entropy (ΔS#), enthalpy (ΔH#) and free energy (ΔG#) of activation were calcu- lated as shown in Table 5 using the following standard relations [48]. Table 4. Relevant IR Spectral data for the complexes. Thioamide Bands dha characterstic bands Compound υ(O- H) (H2O) I δ(C-H)+ δ(N-H) II υ(C=S)+ υ(C-N)+ δ(C-H) III υ(C-N)+ υ(C-S) IV υ(C=S) υ(C=O) carbonyl υ(C–O) [Cu(NBT)(dha)]Cl - 1550 1240 1000 790 1630 1240 [Cu(CBT)(dha)Cl(H2O)] - 1550 1240 1000 790 1630 1240 [Cu(MBT)2(dha)]Cl.H2O 3350 1550 1260 1000 780 1630 1230 [Co(NBT)(dha)2].H2O 3300 1550 1270 1000 790 1640 1220 [Co(CBT)(dha)Cl(H2O)].H2O 3350 1540 1260 1010 800 1640 1240 [Co(MBT)(dha)Cl(H2O)] 3350 1560 1250 1020 770 1620 1240 [Ni(NBT)(dha)2].2H2O 3400 1560 1270 1000 810 1630 1240 [Ni(CBT)(dha)Cl(H2O)].H2O 3350 1560 1270 1010 780 1600 1200 [Ni(MBT)(dha)Cl(H2O)] 3350 1550 1180 1000 770 1620 1250 [Cd(NBT)(dha)]Cl.H2O 3400 1540 1250 990 810 1630 1190 [Cd(CBT)(dha)]Cl.H2O 3440 1560 1260 1010 760 1620 1220 [Cd(MBT)(dha)]Cl - 1570 1250 1010 750 1620 1230  D. M. Fouad et al. / Natural Science 2 (2010) 817-827 Copyright © 2010 SciRes. OPEN ACCESS 822 O S N M O Cl .xH2O O OH2 S N M O Cl xH2O M = Cu(II), Co(II), Ni(II) or Cd(II); x = 0 or 1 Figure 2. The Proposed structure for some mixed ligand complexes. 3.4.1. Thermal Analysis of [Cu(NBT)(dha)]Cl The TGA of the square planar complex [Cu(NBT)- (dha)]Cl gave three steps (Figure 3, 4). The first step (T = 26.04-291.4oC, E# = 98.78 KJ/mol) is assignable to removal of C15H13N5O2S moiety (calcd. = 54.063%; found = 53.829%). Step two (T = 291.61-392.12oC, E# = 211.85 KJ/mol) is assignable to removal of chlorine atom and COCH3 moiety (calcd. = 12.986%; found = 12.666%). The third step (T = 394.14-751.73oC, E# = 160.68 KJ/mol) is assignable to removal of carbon atom and C6H4O3 moiety (calcd. = 22.477%; found = 23.102%). The residual product is assignable to be Cu (calcd. = 10.494%; found = 10.403%). [Cu(NBT)(dha)]Cl [Cu(C)(C6H4O3)] I, -C15H13N5O2S III, -C, -C6H4O3 [Cu(C)(dha)]Cl II,-Cl, -COCH3 Cu 3.4.2. Thermal Analysis of Some Complexes The TGA of the complexes 1, 2, 3, 4, 5, 6, 7, 10 gave three steps. The first step (T = 29.69-208.26oC, E# = 17-178.34 KJ/mol) is assignable to removal of one water molecule. Step two (T = 169.55-388.84oC, E# = 35.48- 430 KJ/mol) is assignable to removal of C15H13N4Cl moiety. The third step (T = 321.16-751.62oC, E# = 93- 261 KJ/mol ) is assignable to removal of C8H7O3 moiety and chlorine atom giving CuO + CS as residual prod- ucts: [Cu(CBT)(dha)Cl(H2O)] I, -H2O III, -Cl, -C8H7O3 II, -C15H13N4Cl CuO + CS [Cu(CS)(dha)Cl] [Cu(CBT )(dh a)C l] Figure 3. TG-DTG curves of complex 1.  D. M. Fouad et al. / Natural Science 2 (2010) 817-827 Copyright © 2010 SciRes. OPEN ACCESS 823 Figure 4. Coats-Redfern and Horwitz-Metzger plots of complex 1(a: 1st step, b: 2nd step, c: 3rd step). The TGA of the complexes 8, 9, 12 gave four steps. The first step (T = 27.51-316oC, E# = 42.69-58 KJ/mol) is assignable to removal of two water molecules. Step two (T = 191.98-339.03oC, E# = 53.18-205.84 KJ/mol) is assignable to removal of C8H7O3 moiety and chlorine atom. The third step (T = 318-529.38.57oC, E# = 136- 205.91 KJ/mol) is assignable to removal of C6H4Cl moi- ety. The fourth step (T = 444.59-751.64oC, E# = 62.35- 196.92 KJ/mol) is assignable to removal of C10H9N4 moiety giving NiO + S as residual products. [Ni(CBT)(dha)Cl(H2O)].H2O [Ni (CBT)(O)] I, -2H2O III, -C6H4Cl II, -C8H7O3, -Cl IV, -C10H9N4 NiO + S [Ni(C10H9N4S)(O)] [Ni(CBT)(dh a)Cl] 3.4.3. Thermal Analysis of [Cd(CBT)(dha)]Cl.H2O The TGA of the tetrahedral complex [Cd(CBT)(dha)]Cl. H2O gave five steps. The first step (T = 37.43-173.98oC, E# = 94.16 KJ/mol) is assignable to removal of one water molecule (calcd. = 2.722%; found = 2.322%). Step two (T = 175.18-218.69oC, E# = 67.71 KJ/mol) is assignable to removal of chlorine atom (calcd. = 5.356%; found = 5.289%). The third step (T = 219.89-284.97oC, E# = 194.96 KJ/mol) is assignable to removal of C7H5N2Cl moiety (calcd. = 23.054%; found = 23.186%). The fourth step (T = 286.97-475.42oC, E# = 78.45 KJ/mol) is assignable to removal of C6H7O2 and CHN2 moieties (calcd. = 22.988%; found = 22.154%). Step five (T = 477.41-751.71oC, E# = 193.02 KJ/mol) is assignable to removal of sulphur atom and CO and C8H7 moieties (calcd. = 24.661%; found = 23.154%) giving CdO + C as residual products (calcd. = 21.216%; found = 20.804%). [Cd(CBT)(dha)]Cl.H2O I, -H2O III, -C7H5N2Cl IV,-CHN2 -C6H7O2 II, -Cl [Cd(C9H8N2S)(dha)] [Cd(CBT)(dha)]Cl [Cd(CBT)(dha)] [Cd(C8H7S)(C2O2)] V, -CO, -S, -C8H7CdO + C 3.5. Thermal Stability Comparing the values of the initial decomposition tem- peratures (Ti,dec.) of the organic part or the activation energy data for the prepared mixed ligand complexes the following data is obtained: MBT rather than CBT and NBT forms the most stable complexes with Cu(II), Co(II) and Cd(II) while the most stable Ni(II) complex in presence of CBT as a S, N do- nor ligand (Figure 5). For complexes containing the same mercaptotriazole ligand; Cd(II) have been found to form the most stable complexes in presence of NBT or MBT ligands. While in case of presence of CBT ligand, Cu(II) forms the most stable complex. 100/ T K-1  D. M. Fouad et al. / Natural Science 2 (2010) 817-827 Copyright © 2010 SciRes. OPEN ACCESS 824 Figure 5. Relationships between the activation energy for the first decomposition step for the mixed ligand com- plexes and the S, N donor ligand: Cu(II)(A) and Ni(II)(B) complexes. Table 5. Kinetic and thermodynamic parameters for the thermal decomposition of the synthesized complexes. Coats-Redfern equation (Kinetic Pararmeters) (Thermodynamic parameters) Horwitz-Metzger equation (Kinetic Pararmeters) (Thermodynamic parameters) Comp- lex No. Step n r E Z ΔS ΔH ΔG r E Z ΔS ΔH ΔG 1 1.0 1.0000 98.78 1578.17 –188.10 103.00 198.39 0.999 107.204.75 × 108 –83.20 111.39153.59 2 2.0 0.9991 211.85 3407.68 –183.36217.00 330.53 0.9988222.271.97 × 1017 80.12 227.39177.77 1 3 2.0 0.9997 160.68 2566.76 –188.02167.48 321.12 0.9997174.503.85 × 108 –88.92 181.25253.92 1 0.0 0.9998 58.56 937.11 –188.9861.35 124.63 1.0000 64.25 2.69 × 10⁷ –103.6 67.02 101.72 2 0.0 1.0000 85.48 1369.69 –189.4789.79 188.10 1.0000 94.41 8.91 × 10⁶ –116.4 98.70 159.13 2 3 2.0 1.0000 257.51 4138.54 –181.58262.56 372.78 0.9999267.553.06 × 1021 160.51 272.5 175.14 1 1.0 0.9995 76.98 1232.71 –189.1480.71 165.59 0.9992 84.60 3.81 × 10⁷ –103.1 88.32 134.61 2 2.0 0.9988 453.67 7256.60 –176.09458.25 555.15 0.9602336.077.15 × 1029 321.52 340.62163.69 3 3 0.5 1.0000 57.76 935.37 –195.6663.97 210.04 1.0000 70.52 158.19 –210.44 76.69 233.80 1 0.5 1.0000 58.72 941.80 –190.3762.03 137.71 0.9999 65.35 2.52 × 10⁶ –124.73 68.63 118.22 2 1.0 1.0000 29.71 482.62 –198.3334.13 139.38 0.9999 38.66 11.10 –229.69 43.05 164.94 4 3 1.0 1.0000 102.44 1652.87 –192.18109.65 276.47 1.0000117.1329439.29 –168.24 124.31270.34 1 2.0 0.9999 28.06 454.21 –196.4331.36 109.42 1.0000 34.74 117.06 –207.70 38.02 120.56 2 0.0 0.9990 51.59 833.72 –194.0456.14 162.42 0.9997 60.77 1181.68 –191.14 65.30 169.99 3 1.0 1.0000 90.97 1463.43 –190.9396.46 222.67 0.9999101.533.70 × 105 –144.91 107.00 202.79 5 4 1.0 1.0000 266.18 4280.90 –182.62272.10 402.03 0.9998276.692.06 × 1018 98.47 282.57212.51 1 2.0 0.9995 178.34 2771.21 –182.18181.97 261.54 0.9923185.693.54 × 1020 145.31 189.31125.84 2 2.0 0.9986 268.70 4316.30 –180.55273.35 374.39 0.9981278.432.58 × 1023 198.06 283.06172.22 6 3 0.0 0.9863 93.38 1505.70 –192.24 100.00 253.12 0.9904106.4918225.42 –171.51 113.07249.68 1 0.33 1.0000 17.13 555184.60 –138.2720.83 82.38 1.0000 24.41 1.40 –245.41 28.09 137.33 2 0.0 0.9984 35.86 581.46 –197.0340.41 148.25 0.9995 44.84 23.76 –223.62 49.36 171.757 3 2.0 0.9970 186.82 2965.89 –186.33193.23 336.75 0.9967199.692.30 × 1011 –35.28 206.06233.24 8 1 0.0 0.9914 42.69 688.84 –193.3646.16 126.77 0.9953 49.72 4726.17 –177.35 53.17 127.10 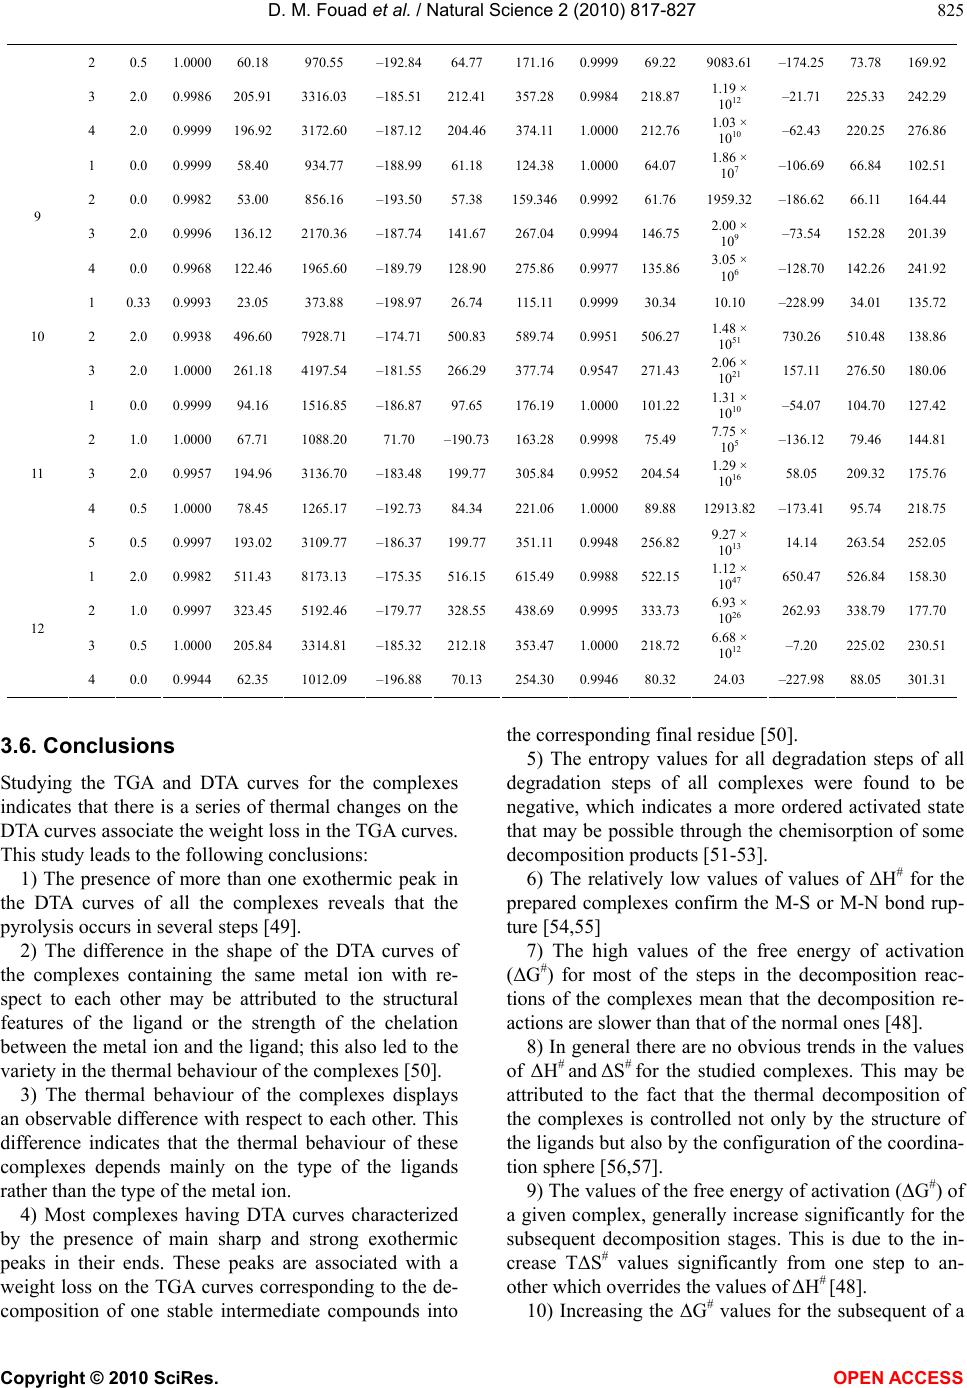 D. M. Fouad et al. / Natural Science 2 (2010) 817-827 Copyright © 2010 SciRes. OPEN ACCESS 825 2 0.5 1.0000 60.18 970.55 –192.8464.77 171.16 0.9999 69.22 9083.61 –174.25 73.78 169.92 3 2.0 0.9986 205.91 3316.03 –185.51212.41 357.28 0.9984218.871.19 × 1012 –21.71 225.33242.29 4 2.0 0.9999 196.92 3172.60 –187.12204.46 374.11 1.0000212.761.03 × 1010 –62.43 220.25276.86 1 0.0 0.9999 58.40 934.77 –188.9961.18 124.38 1.0000 64.07 1.86 × 10⁷ –106.69 66.84 102.51 2 0.0 0.9982 53.00 856.16 –193.5057.38 159.3460.999261.76 1959.32 –186.62 66.11 164.44 3 2.0 0.9996 136.12 2170.36 –187.74141.67 267.04 0.9994146.752.00 × 109 –73.54 152.28201.39 9 4 0.0 0.9968 122.46 1965.60 –189.79128.90 275.86 0.9977135.863.05 × 106 –128.70 142.26 241.92 1 0.33 0.9993 23.05 373.88 –198.9726.74 115.11 0.999930.34 10.10 –228.99 34.01 135.72 2 2.0 0.9938 496.60 7928.71 –174.71500.83 589.74 0.9951506.271.48 × 1051 730.26 510.48138.8610 3 2.0 1.0000 261.18 4197.54 –181.55266.29 377.74 0.9547271.432.06 × 1021 157.11 276.50180.06 1 0.0 0.9999 94.16 1516.85 –186.8797.65 176.19 1.0000101.221.31 × 1010 –54.07 104.70127.42 2 1.0 1.0000 67.71 1088.20 71.70 –190.73 163.28 0.9998 75.49 7.75 × 10⁵ –136.12 79.46 144.81 3 2.0 0.9957 194.96 3136.70 –183.48199.77 305.84 0.9952204.541.29 × 1016 58.05 209.32175.76 4 0.5 1.0000 78.45 1265.17 –192.7384.34 221.06 1.0000 89.88 12913.82 –173.41 95.74 218.75 11 5 0.5 0.9997 193.02 3109.77 –186.37199.77 351.11 0.9948256.829.27 × 1013 14.14 263.54252.05 1 2.0 0.9982 511.43 8173.13 –175.35516.15 615.49 0.9988522.151.12 × 1047 650.47 526.84158.30 2 1.0 0.9997 323.45 5192.46 –179.77328.55 438.69 0.9995333.736.93 × 1026 262.93 338.79177.70 3 0.5 1.0000 205.84 3314.81 –185.32212.18 353.47 1.0000218.726.68 × 1012 –7.20 225.02230.51 12 4 0.0 0.9944 62.35 1012.09 –196.8870.13 254.30 0.9946 80.32 24.03 –227.98 88.05 301.31 3.6. Conclusions Studying the TGA and DTA curves for the complexes indicates that there is a series of thermal changes on the DTA curves associate the weight loss in the TGA curves. This study leads to the following conclusions: 1) The presence of more than one exothermic peak in the DTA curves of all the complexes reveals that the pyrolysis occurs in several steps [49]. 2) The difference in the shape of the DTA curves of the complexes containing the same metal ion with re- spect to each other may be attributed to the structural features of the ligand or the strength of the chelation between the metal ion and the ligand; this also led to the variety in the thermal behaviour of the complexes [50]. 3) The thermal behaviour of the complexes displays an observable difference with respect to each other. This difference indicates that the thermal behaviour of these complexes depends mainly on the type of the ligands rather than the type of the metal ion. 4) Most complexes having DTA curves characterized by the presence of main sharp and strong exothermic peaks in their ends. These peaks are associated with a weight loss on the TGA curves corresponding to the de- composition of one stable intermediate compounds into the corresponding final residue [50]. 5) The entropy values for all degradation steps of all degradation steps of all complexes were found to be negative, which indicates a more ordered activated state that may be possible through the chemisorption of some decomposition products [51-53]. 6) The relatively low values of values of ΔH# for the prepared complexes confirm the M-S or M-N bond rup- ture [54,55] 7) The high values of the free energy of activation (ΔG#) for most of the steps in the decomposition reac- tions of the complexes mean that the decomposition re- actions are slower than that of the normal ones [48]. 8) In general there are no obvious trends in the values of ΔH# and ΔS# for the studied complexes. This may be attributed to the fact that the thermal decomposition of the complexes is controlled not only by the structure of the ligands but also by the configuration of the coordina- tion sphere [56,57]. 9) The values of the free energy of activation (ΔG#) of a given complex, generally increase significantly for the subsequent decomposition stages. This is due to the in- crease TΔS# values significantly from one step to an- other which overrides the values of ΔH# [48]. 10) Increasing the ΔG# values for the subsequent of a  D. M. Fouad et al. / Natural Science 2 (2010) 817-827 Copyright © 2010 SciRes. OPEN ACCESS 826 given complex reflects that the rate of removal of a given species will be lower than that of the precedent one [48]. This may be attributed to the structure rigidity of the remaining complex. 11) There is much closeness in the enthalpy (ΔH#) values obtained by Coats-Redfern equation and Horwitz- Metzger equation, indicating that the thermal degrada- tion of these complexes follow the standard methods. REFERENCES [1] Arndt, F. (1955) Org. Synth. Coll. II, 231. [2] Rao, D.S., Ganorkar, M.C.D., Rao, L.S. and John, V.T. (1978) Natl. Acad. Sci. Lett., 1, 402. [3] Bartels-Keith, J.R. (1960) J. Chem. Soc., 1662. [4] Miyakado, M., Inoue, S., Tanabe, Y., Watanabe, K., Ohno, N., Yoshioka, H. and Mabay, T.J. (1982) Chem. Lett., 1539. [5] Figueroa-Villar, J.D., Ayer, W.A. and Migaj, B. (1988) Can. J. Chem., 66, 506-512. [6] Reddy, G.S.R. and Rao, N.R. (1994) Indian J. Chem. B, 33, 113. [7] Chalaca, M.Z., Figueroa-Villar, J.D., Ellena, J.A. and Castellano, E.E. (2002) Inorg. Chim. Acta, 328, 45. [8] Kureshy, R.I., Khan, N.H., Abdi, S.H.R., Iyer, P. and Patel, S.T. (1999) Polyhedron, 18, 1773. [9] Kureshy, R.I., Khan, N.H., Abdi, S.H.R. and Iyer, P. (1997) J. Mol. Catal., 124, 91. [10] Rao, P.V. and Narasaiah, A.V. (2003) Indian J. Chem. A, 42, 1896. [11] Puerta, D.T. and Cohen, S.M. (2003) Inorg. Chem., 42, 3423. [12] Battaini, G., Monzani, E., Casella, L., Santagostini, L. and Pagliarin, R. (2000) J. Biol. Inorg. Chem., 5, 262. [13] Thaisrivongs, S., Romero, D.L., Tommasi, R.A., Janaki- raman, M.N., Strohbach, J.W., Turner, S.R., Biles, C., Morge, R.R., Johnson, P.D., Aristoff, P.A., Tomich, P.K., Lynn, J.C., Horng, M.M., Chong, K.T., Hinshaw, R.R., Howe, W.J., Finzel, B.C. and Watenpaugh, K.D. (1996) J. Med. Chem. 39, 4630. [14] Eweiss, N., Bahajaj, A. and Elsherbini, E. (1986) Heterocycl. Chem., 23, 1451. [15] Holla, B., Poojary, K., Kalluraya, B. and Gowda, P. (1996) Farmaco, 51, 793. [16] Jantova, S., Greif, G., Pavlovicova, R. and Cipak, L. (1998) Folia Microbiol.(Prague), 43, 75. [17] Awad, I., Abdel-Rahman, A. and Bakite, E. (1991) J. Chem. Technol. Biotechnol., 51, 483. [18] Kucukguzel, I., Kucukguzel, S.G., Rollas, S. and Kiraz, M. (2001) Bioorg.Chem. Lett., 11, 1703. [19] Bala, S., Gupta, R.P., Sachedeva, M.L., Lal, M., Singh, A.K. and Pujari, H.K. (1978) Ind. J. Chem., 16B, 481. [20] Jantova, S., Greif, G., Pavlovicova, R. and Cipak, L. (1998) Folia Microbiol., 43, 75. [21] Sadadudam, Y.S., Shetty, M.M. and Dlawan, P.V. (1992) Eur. J. Med. Chem., 27, 87. [22] Bermejo, E., Carballo, R., Castineiras, A., Dominguez, R., Maichle-Mossmer, C., Strahle, J. and West, D. (1999) Polyhedron, 18, 3695. [23] Almajan, G.L., Barbuceanu, S., Almajan, E., Draghici, C. and Saramet, G. (2008) European Journal of Medicinal Chemistry, 1-7. [24] Joshi, S.D., Vagdevi, H.M., Vaidya, V.P. and Gadagina- math, G.S. (2008) European Journal of Medicinal Chem- istry, 43, 1989-1996. [25] Akbar Ali, M. and Livingstone, S.E. (1974) Coord. Chem. Rev., 13, 101. [26] Severin, K., Bergs, R. and Beck, W. (1998) Angew. Chem., Int. Ed., 37, 1722. [27] Shikkargol, R.K., Angadi, S.D. and Kulkami, V.H. (1996) Orient. J. Chem., 1172. [28] Cansiz, A., Koparir, M. and Demitdag, A. (2004) Mole- cules, 9, 204. [29] Ragenovic, K.C., Dimova, V., Kakurinov, V., Molnar, D. G. and Buzarovska, A. (2001) Molecules, 6, 815. [30] Reid, J.R. and Heindel, D. (1976) J. Heterocyclic Chem., 13, 925. [31] Geary, W.J. (1971) Coord. Chem. Rev., 7, 81. [32] Macias, B., Villa, V.M. and Gallego, R.R. (1995) Tran. Met. Chem., 20, 347. [33] Lever, A.B.P. (1984) Inorganic electronic spectroscopy. Elsevier Amsterdam, 4th Edition. [34] Dubey, S.N. and Kaushik, B. (1985) Indian J. Chem., 24A(11), 950-953. [35] Kishita, M., Inoue, M. and Kubo, M. (1964) Inorg. Chem., 3, 237. [36] Dubey, S., Handa, R. and Vaid, B. (1994) Monatsh. Chem., 125, 395-401. [37] Earnshow, A. (1968) Introduction to magnetochemistry. Academic Press, London. [38] Beena, K. and Dubey, S.N. (1989) Indian. J. Chem., 28A(5), 425-427. [39] Figgis, B.N. and Lewis, J. (1960) Modern coordination chemistry. In: Lewis, J. and Wilkins, R.G., Eds., Inter- science, New York, 403-406. [40] Chalaca, M. Z., Villar, J.D.F., Ellena, J.A., Castellano, E. E. (2002) Inorg. Chim. Acta, 328, 45. [41] Chitrapriya, N., Mahalingam, V., Zeller, M., Jayabalan, R., Swaminathan, K. and Natarajan, K. (2008) Polyhe- dron, 27, 939-946. [42] Gupta, B.K., Gupta, D.S., Dikshit, S.K. and Agarwala, V. Ind. J. Chem. (1977) 15A, 624. [43] Subramanian, M.S. and Viswanatha, A.J. (1969) Inorg. Nucl. Chem., 31, 2575. [44] Issleib, K. and Batz, G.Z. (1969) Anorg. Allg. Chem., 369, 83. [45] Nakamoto, K. (1978) Infrared spectra and raman spectra of inorganic and coordination compounds. 3rd Edition, John Wiley, New York. [46] Coats, A.W. and Redfern, J.P. (1964) Nature, 20, 68. [47] Horwitz, H.H. and Metzger, G. (1963) Anal. Chem., 35, 1464. [48] Kandil, S.S., El-Hefnawy, B.G. and Baker, A.E. (2004) Thermochim. Acta, 414, 105. [49] Ali, F.B., Al-Akramawi, S.W., Al-Obaidi, H.K. and Al-Karboli, H.A. (2004) Thermchim. Acta, 419, 39. [50] Said, A.A. and Hassan, M.R. (1993) Poly. Degard. Stab., 39, 393. [51] Madhusudanan, M.P., Yusuff, M.K.K. and Nair, R.G.C. (1975) J. Therm. Anal., 8, 31. [52] Gudasi, K.B., Maravalli, P.B. and Goudar, T.R. (2005) J. Serb. Chem. Soc., 70, 643.  D. M. Fouad et al. / Natural Science 2 (2010) 817-827 Copyright © 2010 SciRes. OPEN ACCESS 827 [53] Maravalli, P.B., Gudasi, K.B. and Goudar, T.R. (2000) Transition Met. Chem., 25, 411. [54] Dakternieks, R.D. and Gradon, P.D. (1971) Aust. J. Chem., 24, 2509. [55] Shetty, S.P. and Fernando, Q. (1970) J. Am. Chem. Soc., 92, 3964. [56] Hill, O.J., Murrary, P.J. and Patil, C.K. (1994) Rev. Inorg. Chem., 363, 14. [57] Roman, P., Beitia, I.J., Luque, A. and Miralles, G.C. (1994) Polyhedron, 13, 2311. |