 Journal of Geographic Information System, 2012, 4, 462-469 http://dx.doi.org/10.4236/jgis.2012.45050 Published Online October 2012 (http://www.SciRP.org/journal/jgis) Contribution of MODIS NDVI 250 m Multi-Temporal Imagery Dataset for the Detection of Natural Forest Distribution of Java Island, Indonesia Syartinilia1, Satoshi Tsuyuki2 1Department of Landscape Architecture, Faculty of Agriculture, Bogor Agricultural University (IPB), Bogor, Indonesia 2Graduate School of Agricultural and Life Sciences, The University of Tokyo, Tokyo, Japan Email: syartinilia@ipb.ac.id, syartinilia@yahoo.com, tsuyuki@fr.a.u-tokyo.ac.jp Received July 7, 2012; revised August 5, 2012; accepted September 5, 2012 ABSTRACT As landmass of the world is covered by vegetation, taking into account phenology when performing land cover classi- fication may yield more accurate maps. The availability of no-cost Moderate Resolution Imaging Spectrometer (MODIS) NDVI dataset that provides high-quality continuous time series data is representing a potentially significant source of land cover information especially for detection natural forest distribution. This study intends to assess the ad- vantage of MODIS 250 m Normalized Difference Vegetation Index (NDVI) multi-temporal imagery for detection of densely vegetation cover distribution in Java and then for identification of remaining natural forest in Java from densely vegetation cover distribution. Result of this study successfully demonstrated the contribution of MODIS NDVI 250 m for detection the natural forest distribution in Java Island. Therefore, the approach described herein provided classifica- tion accuracy comparable to those of maps derived from higher resolution data and will be a viable alternative for re- gional or national classifications. Keywords: Java; MODIS; Multi-Temporal; Natural Forest; NDVI 1. Introduction Climate change affects forest both directly and indirectly through disturbances. Disturbances are a natural and in- tegral part of forest ecosystems, and climate change can alter these natural interactions. Such interactions between climate, disturbances, and forest systems may be critical in determining how climate change expresses its effects on forests ([1] Dale et al., 2000) For example, changes in species diversity are most quickly apparent after a dis- turbance has cleared the landscape and species adapted to the new climate become established. Because forests are so long-lived, it may be that many climate change effects on forests are most easily to be observed. As we know, the natural forest is an important source of the world’s biodiversity. Forests cover 31% of the world’s surface and contain vast carbon stocks ([2] FAO, 2010) Alongside carbon storage, forests also provide important services for the livelihoods of 1.2 billion people, and are vital for the survival of a further 60 million indigenous people, who are completely dependent upon forests ([3] World Bank, 2001). Such services are linked to ecosystem biological diversity and therefore ensuring the protection of such diversity within the REDD+ mechanism will be crucial if forest ecosystems are to remain functional service pro- viders. The term “REDD-plus” or “REDD+” is now also used frequently. REDD+ is similar to REDD, but instead of just covering deforestation and degradation, it includes other activities, such as the sustainable management of forests and the enhancement of forest carbon stocks ([4] Probert et al., 2011). REDD has the potential to make vast and immediate reductions to greenhouse gas (GHG) emissions ([5] Lubowski, 2008) and is an important part of global policies to address climate change. Therefore, identification the existence of forest cover in large area may help REDD+ implementation in Indonesia and also to investigate the impact of climate change to natural forest. Recently, vegetation phenology has been found as fundamental component and a potentially significant source of successful interpretation of land cover assess- ment and several researchers have intensively carried out researches on measuring these variables by remote sens- ing ([6] Reed et al., 1994; [7] Loveland et al., 2000; [8] Senay et al., 2000; [9] Knight et al., 2006; [10] Lunetta et al., 2006). Since most of the landmass of the world is covered by vegetation, taking into account phenology C opyright © 2012 SciRes. JGIS 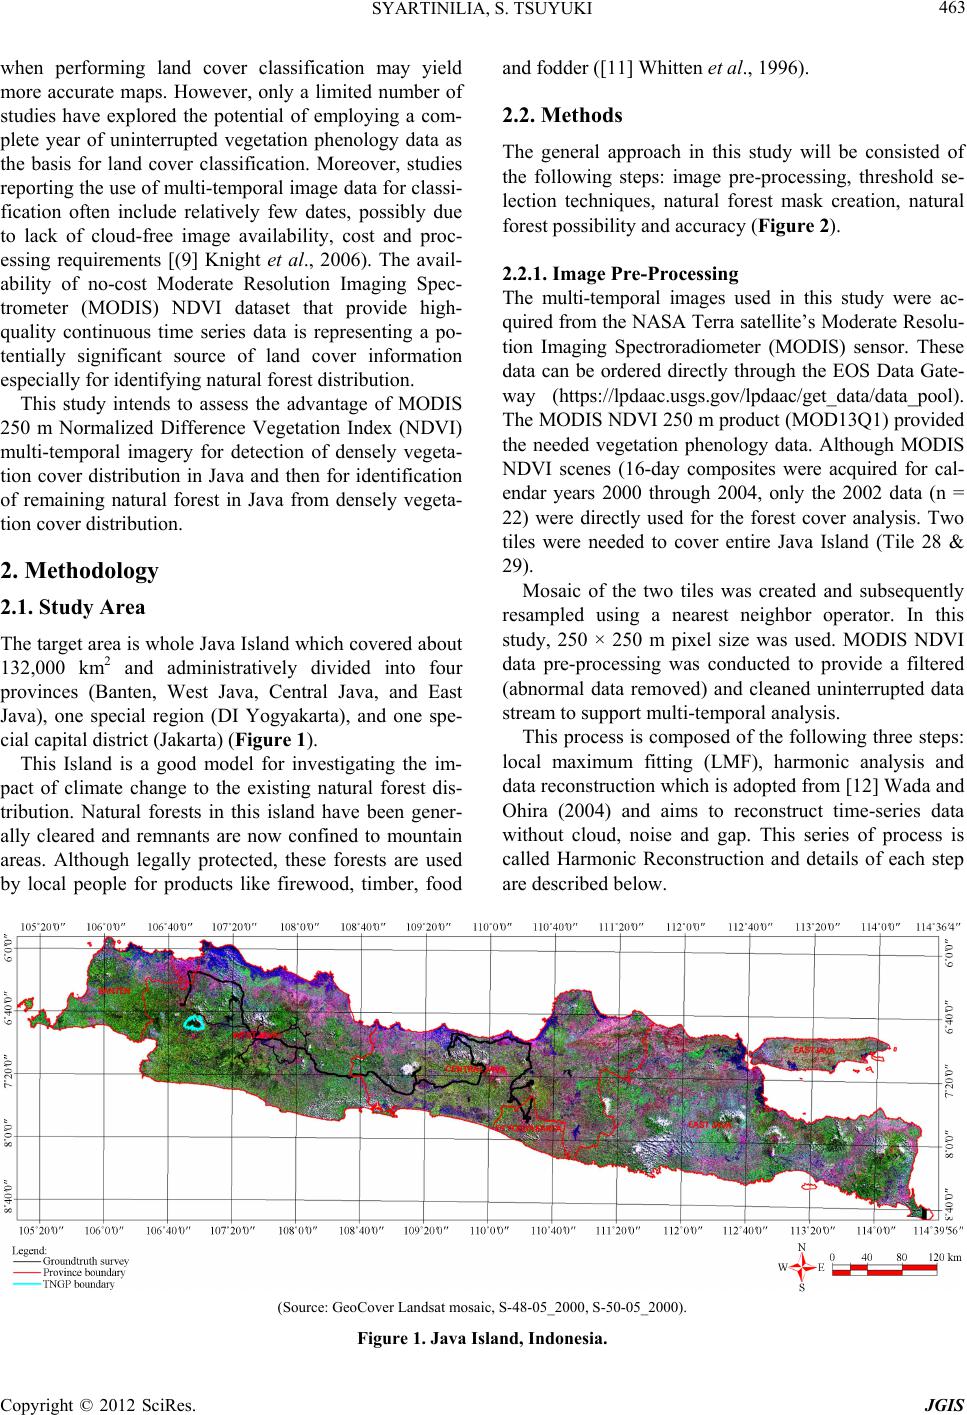 SYARTINILIA, S. TSUYUKI 463 when performing land cover classification may yield more accurate maps. However, only a limited number of studies have explored the potential of employing a com- plete year of uninterrupted vegetation phenology data as the basis for land cover classification. Moreover, studies reporting the use of multi-temporal image data for classi- fication often include relatively few dates, possibly due to lack of cloud-free image availability, cost and proc- essing requirements [(9] Knight et al., 2006). The avail- ability of no-cost Moderate Resolution Imaging Spec- trometer (MODIS) NDVI dataset that provide high- quality continuous time series data is representing a po- tentially significant source of land cover information especially for identifying natural forest distribution. This study intends to assess the advantage of MODIS 250 m Normalized Difference Vegetation Index (NDVI) multi-temporal imagery for detection of densely vegeta- tion cover distribution in Java and then for identification of remaining natural forest in Java from densely vegeta- tion cover distribution. 2. Methodology 2.1. Study Area The target area is whole Java Island which covered about 132,000 km2 and administratively divided into four provinces (Banten, West Java, Central Java, and East Java), one special region (DI Yogyakarta), and one spe- cial capital district (Jakarta) (Figure 1). This Island is a good model for investigating the im- pact of climate change to the existing natural forest dis- tribution. Natural forests in this island have been gener- ally cleared and remnants are now confined to mountain areas. Although legally protected, these forests are used by local people for products like firewood, timber, food and fodder ([11] Whitten et al., 1996). 2.2. Methods The general approach in this study will be consisted of the following steps: image pre-processing, threshold se- lection techniques, natural forest mask creation, natural forest possibility and accuracy (Figure 2). 2.2.1. Image Pre-Processing The multi-temporal images used in this study were ac- quired from the NASA Terra satellite’s Moderate Resolu- tion Imaging Spectroradiometer (MODIS) sensor. These data can be ordered directly through the EOS Data Gate- way (https://lpdaac.usgs.gov/lpdaac/get_data/data_pool). The MODIS NDVI 250 m product (MOD13Q1) provided the needed vegetation phenology data. Although MODIS NDVI scenes (16-day composites were acquired for cal- endar years 2000 through 2004, only the 2002 data (n = 22) were directly used for the forest cover analysis. Two tiles were needed to cover entire Java Island (Tile 28 & 29). Mosaic of the two tiles was created and subsequently resampled using a nearest neighbor operator. In this study, 250 × 250 m pixel size was used. MODIS NDVI data pre-processing was conducted to provide a filtered (abnormal data removed) and cleaned uninterrupted data stream to support multi-temporal analysis. This process is composed of the following three steps: local maximum fitting (LMF), harmonic analysis and data reconstruction which is adopted from [12] Wada and Ohira (2004) and aims to reconstruct time-series data without cloud, noise and gap. This series of process is called Harmonic Reconstruction and details of each step re described below. a (Source: GeoCover Landsat mosaic, S-48-05_2000, S-50-05_2000). Figure 1. Java Island, Indonesia. Copyright © 2012 SciRes. JGIS 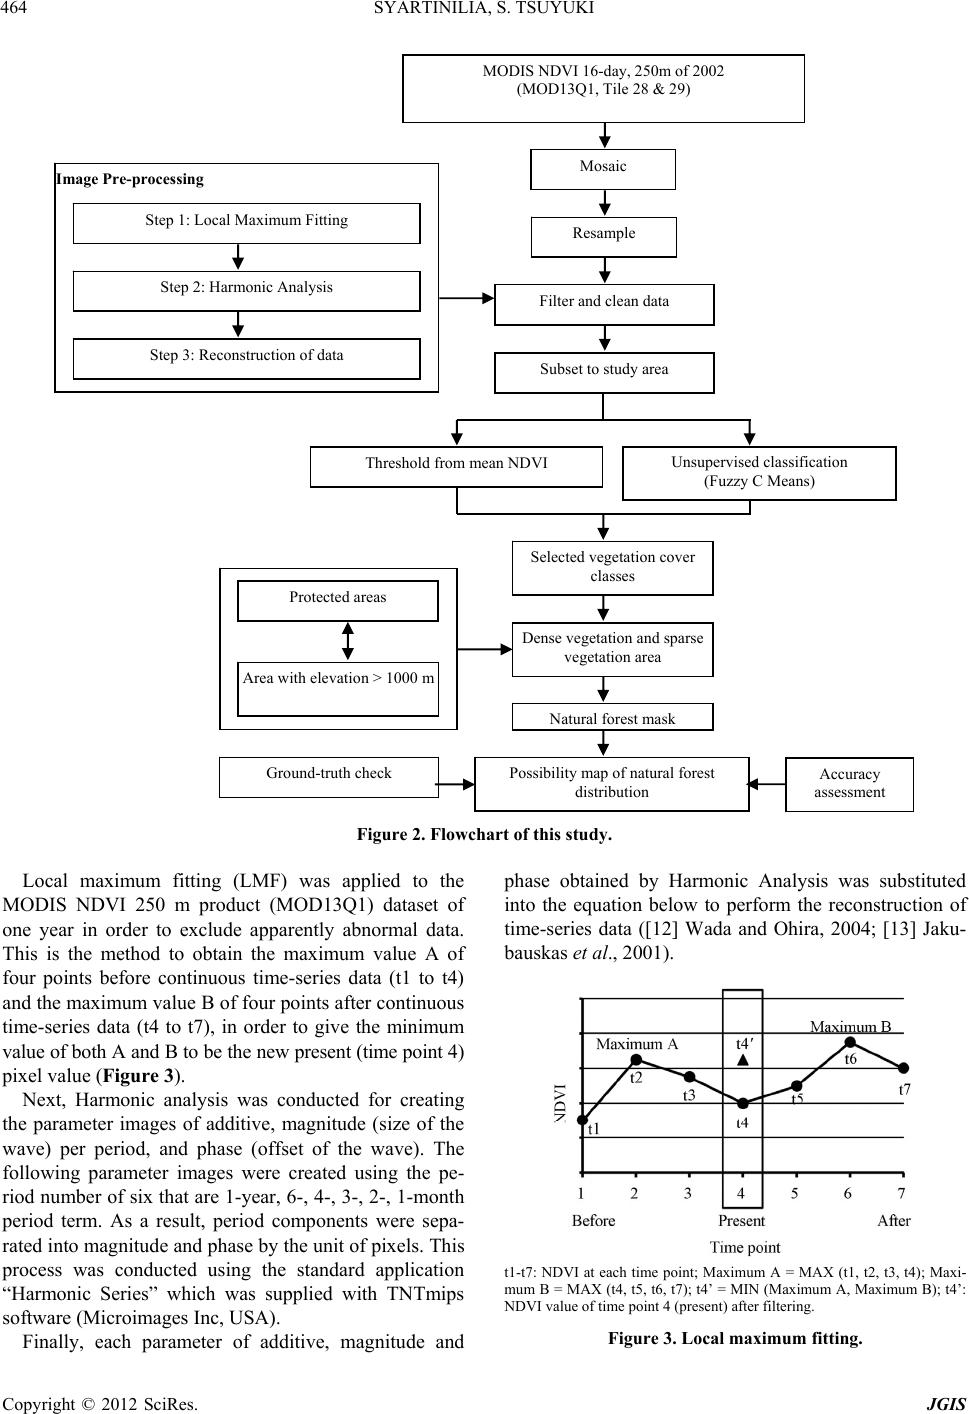 SYARTINILIA, S. TSUYUKI 464 Figure 2. Flowchart of this study. Local maximum fitting (LMF) was applied to the MODIS NDVI 250 m product (MOD13Q1) dataset of one year in order to exclude apparently abnormal data. This is the method to obtain the maximum value A of four points before continuous time-series data (t1 to t4) and the maximum value B of four points after continuous time-series data (t4 to t7), in order to give the minimum value of both A and B to be the new present (time point 4) pixel value (Fi gure 3). Next, Harmonic analysis was conducted for creating the parameter images of additive, magnitude (size of the wave) per period, and phase (offset of the wave). The following parameter images were created using the pe- riod number of six that are 1-year, 6-, 4-, 3-, 2-, 1-month period term. As a result, period components were sepa- rated into magnitude and phase by the unit of pixels. This process was conducted using the standard application “Harmonic Series” which was supplied with TNTmips software (Microimages Inc, USA). Finally, each parameter of additive, magnitude and phase obtained by Harmonic Analysis was substituted into the equation below to perform the reconstruction of time-series data ([12] Wada and Ohira, 2004; [13] Jaku- bauskas et al., 2001). t1-t7: NDVI at each time point; Maximum A = MAX (t1, t2, t3, t4); Maxi- mum B = MAX (t4, t5, t6, t7); t4’ = MIN (Maximum A, Maximum B); t4’: NDVI value of time point 4 (present) after filtering. Figure 3. Local maximum fitting. Selected vegetation cover classes Dense vegetation and sparse vegetation area Natural forest mask Possibility map of natural forest distribution Threshold from mean NDVI MODIS NDVI 16-day, 250m of 2002 (MOD13Q1, Tile 28 & 29) Mosaic Unsupervised classification (Fuzzy C Means) Resample Filter and clean data Subset to study area Step 1: Local Maximum Fitting Step 2: Harmonic Analysis Step 3: Reconstruction of data Image Pre-processing Protected areas Area with elevation > 1000 m Ground-truth check Accuracy assessment Copyright © 2012 SciRes. JGIS  SYARTINILIA, S. TSUYUKI 465 1 2π cos on n nt ft ccLn o = Additive; n = 2 × Magnitude (n); n c c = Phase (n); n = Times of harmonic; L = Number of time-series; t = Times (1 to L). 2.2.2. Threshold Selection After pre-processing, filtered and cleaned image obtained were subset to study area. Subsequently for producing dense vegetation and non-dense vegetation map, combi- nation of two approaches was applied to MODIS NDVI images that are threshold from mean NDVI and a classi- fication result created by Fuzzy C Means (FCM). Ini- tially, several threshold values from mean NDVI of 70, 75, 80, 81, 82, 83, 84, 85, and 90 were created. Then, the primary FCM classification results with 50 classes were overlaid with threshold from mean in order to select the representative dense vegetation classes of FCM classify- cation result. After that, 9 × 9 modal filtering to avoid some small “salt and pepper” pixels was done for filter- ing selected threshold value image. Finally, the dense vegetation and non-dense vegetation area map was de- rived and directly used for creating natural forest mask. 2.2.3. Natural Forest Mask Creation Natural forest mask creation is composed of three GIS operations. First, OR operation was applied to protected areas (PA) and area with elevation >1000 m asl map. Area with elevation 1000 m and >1000 m have catego- rized as 0 and 1, respectively. Then, the areas located inside and outside boundary of protected area have cate- gorized as 1 and 0, respectively. This operation catego- rized the area with 1000 m and located outside the pro- tected area with the value of 0, whereas the remaining areas with the value of 1. The next operation was replac- ing the result of first operation from the value 1 become 2. Last operation was using ADD operation for adding the value obtained from the previous operation and the dense vegetation and sparse vegetation map. The areas of sparse vegetation and dense vegetation have a value 1 and 2, respectively. From this operation whole area were categorized into four values (1 to 4) which are ready to use for classification of natural forest distribution. 2.2.4. Natural Fo re st Possibility and Accurac y Assessment Subsequently, the natural forest mask obtained was categorized for producing possibility map of natural for- est distribution (Table 1). Initial classification of natural forest possibility level was using assumptions as follows: 1) Natural forests in Java had been generally cleared and remnants are now confined to mountain areas (elevation >1000 m asl), 2) Remaining natural forests locate in pro- tected area, 3) Plantation forestry and plantation agricul- ture (estate) mainly located ≤1000 m except for tea, cof- fee and some pine plantation (elevation > 1000 m asl). For accuracy assessment, we used the field investiga- tions data which were done in September 2006 and Au- gust 2007 to identify land use/cover of the area. About 1000 points of landmark data (latitude/longitude) were recorded using GPS receiver, and digital photographs were taken at the same time. Subsequently ground truth data were used as reference data for creating training area used for accuracy assessment. Overall accuracy and Kappa accuracy were computed for measuring map ac- curacy. 3. Results and Discussions 3.1. Harmonic Reconstruction Data Harmonic reconstruction process was resulted the filtered and cleaned images. Comparison of raw data, Local Maximum Fitting data, and cleaned data for one sample of forest cover is shown in Figure 4. The figure showed that after filtering and cleaning process, the cleaned and filtered data have produced. Then, the images can be sed to proceed for the next analysis. u Table 1. Initial classification of natural forest possibility level. Cell value Characteristics Classification Natural forest possibility level 4 Dense vegetation, PA, >1000 m Natural forest 1 4 Dense vegetation, PA, 1000 m Natural forest (lowland forest) 2 4 Dense vegetation, Non PA, >1000 m Natural forest or plantation or estate or agriculture 3 2 Dense vegetation, Non PA, 1000 m Secondary forest, Plantation or estate or agriculture 4 3 Sparse vegetation, PA, >1000 m 5 3 Sparse vegetation, PA, 1000 m 5 3 Sparse vegetation, Non PA, >1000 m Non-natural forest but still covered by sparse vegetation such as shrub, bush, etc. 6 1 Sparse vegetation, Non PA, 1000 m Non natural forest Non-natural forest but still covered by sparse vegetation such as shrub, bush, etc. 7 Copyright © 2012 SciRes. JGIS 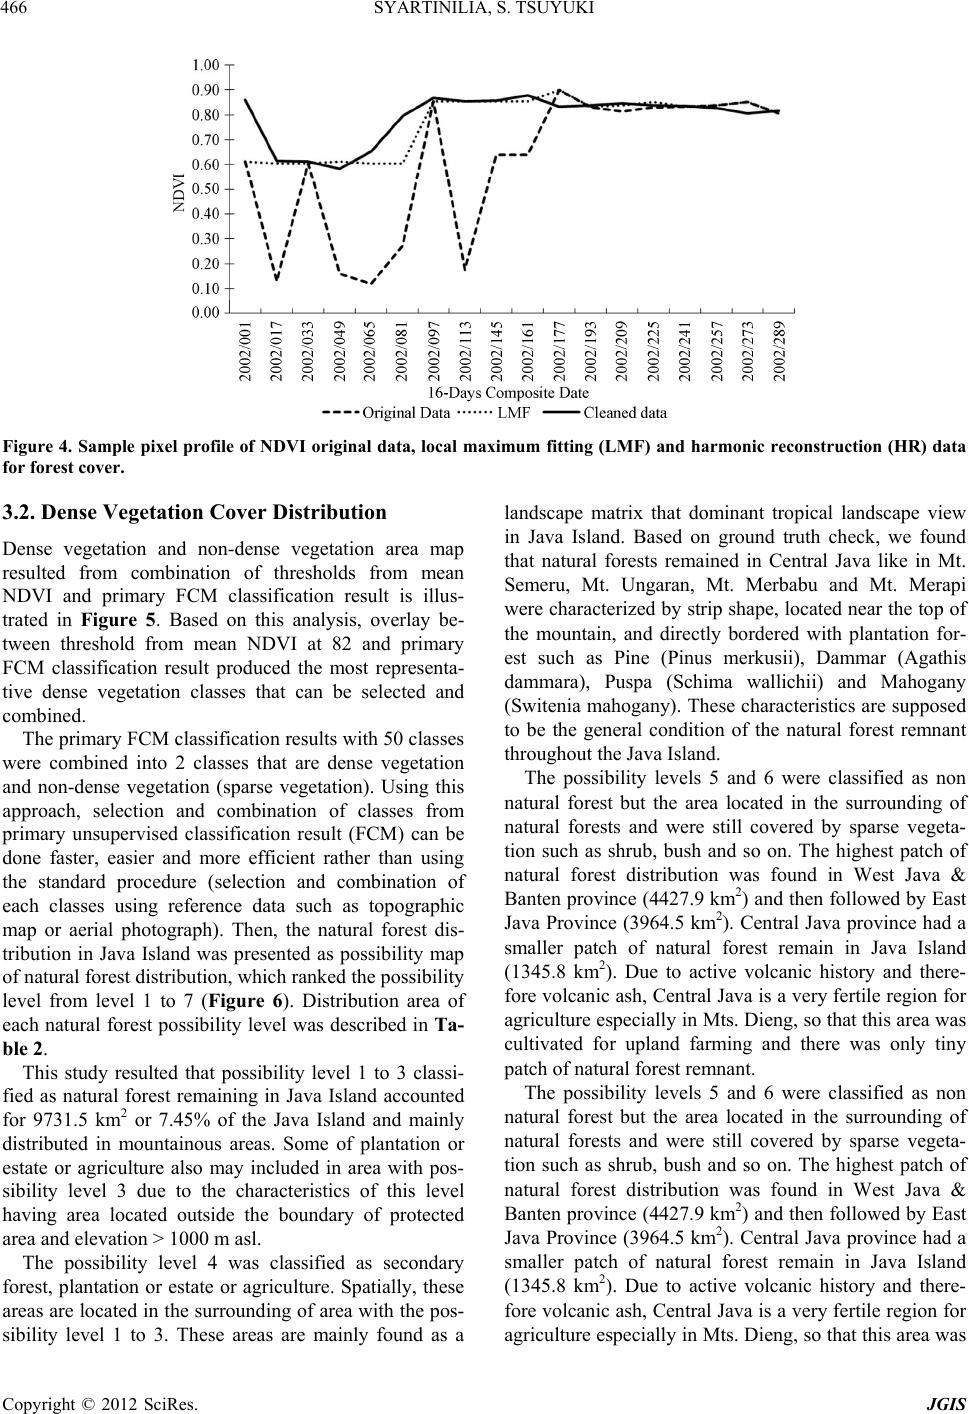 SYARTINILIA, S. TSUYUKI 466 Figure 4. Sample pixel profile of NDVI original data, local maximum fitting (LMF) and harmonic reconstruction (HR) data for forest cover. 3.2. Dense Vegetation Cover Distribution Dense vegetation and non-dense vegetation area map resulted from combination of thresholds from mean NDVI and primary FCM classification result is illus- trated in Figure 5. Based on this analysis, overlay be- tween threshold from mean NDVI at 82 and primary FCM classification result produced the most representa- tive dense vegetation classes that can be selected and combined. The primary FCM classification results with 50 classes were combined into 2 classes that are dense vegetation and non-dense vegetation (sparse vegetation). Using this approach, selection and combination of classes from primary unsupervised classification result (FCM) can be done faster, easier and more efficient rather than using the standard procedure (selection and combination of each classes using reference data such as topographic map or aerial photograph). Then, the natural forest dis- tribution in Java Island was presented as possibility map of natural forest distribution, which ranked the possibility level from level 1 to 7 (Figure 6). Distribution area of each natural forest possibility level was described in Ta- ble 2. This study resulted that possibility level 1 to 3 classi- fied as natural forest remaining in Java Island accounted for 9731.5 km2 or 7.45% of the Java Island and mainly distributed in mountainous areas. Some of plantation or estate or agriculture also may included in area with pos- sibility level 3 due to the characteristics of this level having area located outside the boundary of protected area and elevation > 1000 m asl. The possibility level 4 was classified as secondary forest, plantation or estate or agriculture. Spatially, these areas are located in the surrounding of area with the pos- sibility level 1 to 3. These areas are mainly found as a landscape matrix that dominant tropical landscape view in Java Island. Based on ground truth check, we found that natural forests remained in Central Java like in Mt. Semeru, Mt. Ungaran, Mt. Merbabu and Mt. Merapi were characterized by strip shape, located near the top of the mountain, and directly bordered with plantation for- est such as Pine (Pinus merkusii), Dammar (Agathis dammara), Puspa (Schima wallichii) and Mahogany (Switenia mahogany). These characteristics are supposed to be the general condition of the natural forest remnant throughout the Java Island. The possibility levels 5 and 6 were classified as non natural forest but the area located in the surrounding of natural forests and were still covered by sparse vegeta- tion such as shrub, bush and so on. The highest patch of natural forest distribution was found in West Java & Banten province (4427.9 km2) and then followed by East Java Province (3964.5 km2). Central Java province had a smaller patch of natural forest remain in Java Island (1345.8 km2). Due to active volcanic history and there- fore volcanic ash, Central Java is a very fertile region for agriculture especially in Mts. Dieng, so that this area was cultivated for upland farming and there was only tiny patch of natural forest remnant. The possibility levels 5 and 6 were classified as non natural forest but the area located in the surrounding of natural forests and were still covered by sparse vegeta- tion such as shrub, bush and so on. The highest patch of natural forest distribution was found in West Java & Banten province (4427.9 km2) and then followed by East Java Province (3964.5 km2). Central Java province had a smaller patch of natural forest remain in Java Island (1345.8 km2). Due to active volcanic history and there- fore volcanic ash, Central Java is a very fertile region for agriculture especially in Mts. Dieng, so that this area was Copyright © 2012 SciRes. JGIS 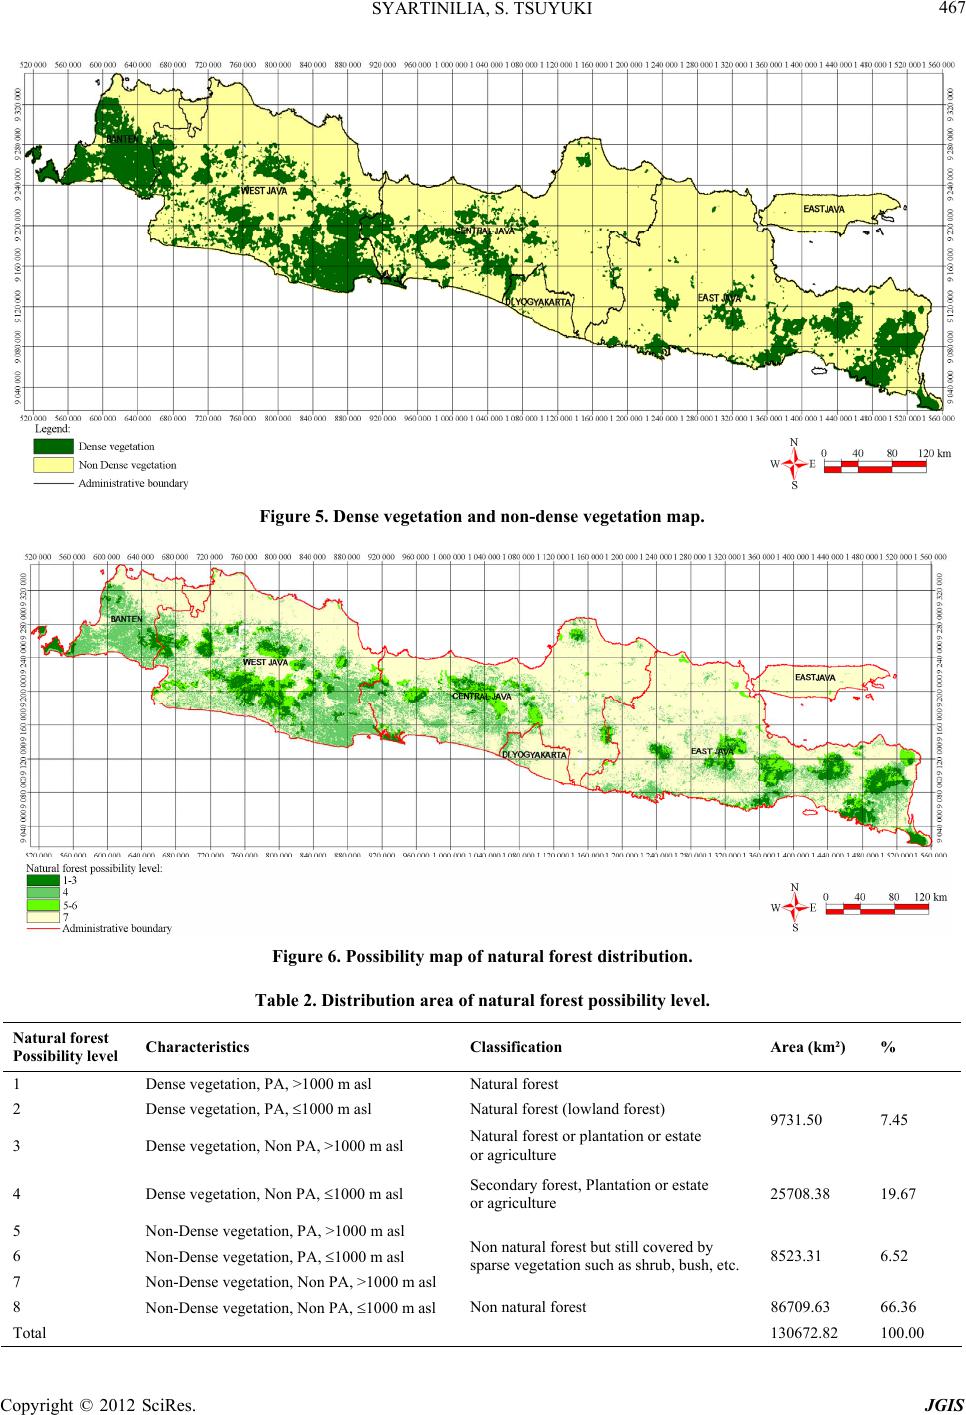 SYARTINILIA, S. TSUYUKI 467 Figure 5. Dense vegetation and non-dense vegetation map. Figure 6. Possibility map of natural forest distribution. Table 2. Distribution area of natural forest possibility level. Natural forest Possibility level Characteristics Classification Area (km²) % 1 Dense vegetation, PA, >1000 m asl Natural forest 2 Dense vegetation, PA, 1000 m asl Natural forest (lowland forest) 3 Dense vegetation, Non PA, >1000 m asl Natural forest or plantation or estate or agriculture 9731.50 7.45 4 Dense vegetation, Non PA, 1000 m asl Secondary forest, Plantation or estate or agriculture 25708.38 19.67 5 Non-Dense vegetation, PA, >1000 m asl 6 Non-Dense vegetation, PA, 1000 m asl 7 Non-Dense vegetation, Non PA, >1000 m asl Non natural forest but still covered by sparse vegetation such as shrub, bush, etc. 8523.31 6.52 8 Non-Dense vegetation, Non PA, 1000 m asl Non natural forest 86709.63 66.36 Total 130672.82 100.00 Copyright © 2012 SciRes. JGIS 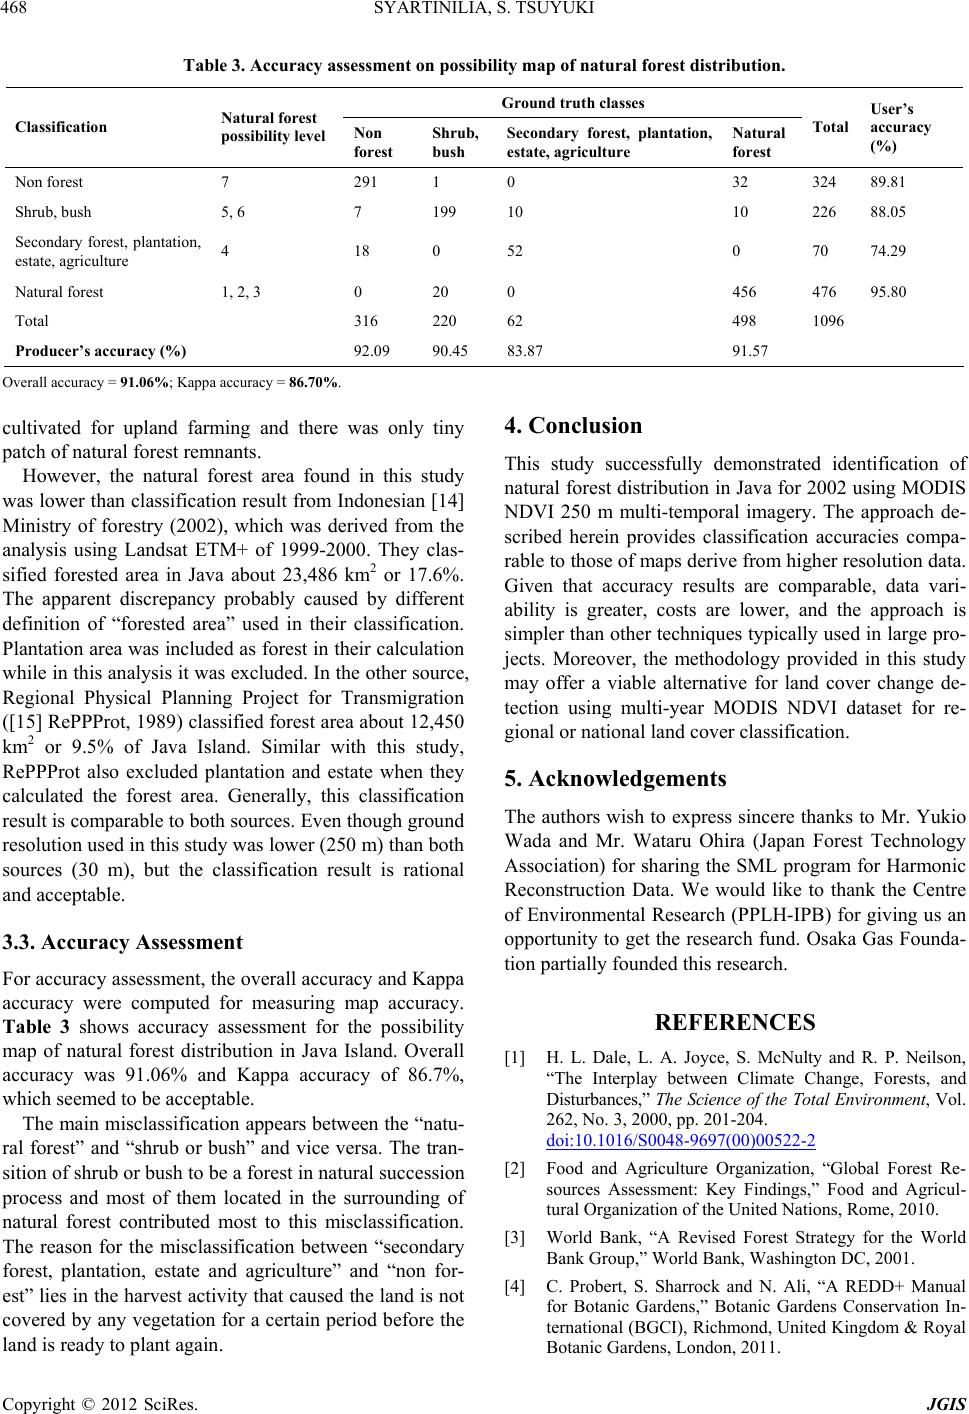 SYARTINILIA, S. TSUYUKI 468 Table 3. Accuracy assessment on possibility map of natural forest distribution. Ground truth classes Classification Natural forest possibility level Non forest Shrub, bush Secondary forest, plantation, estate, agriculture Natural forest Total User’s accuracy (%) Non forest 7 291 1 0 32 324 89.81 Shrub, bush 5, 6 7 199 10 10 226 88.05 Secondary forest, plantation, estate, agriculture 4 18 0 52 0 70 74.29 Natural forest 1, 2, 3 0 20 0 456 476 95.80 Total 316 220 62 498 1096 Producer’s accuracy (%) 92.09 90.45 83.87 91.57 Overall accuracy = 91.06%; Kappa accuracy = 86.70%. cultivated for upland farming and there was only tiny patch of natural forest remnants. However, the natural forest area found in this study was lower than classification result from Indonesian [14] Ministry of forestry (2002), which was derived from the analysis using Landsat ETM+ of 1999-2000. They clas- sified forested area in Java about 23,486 km2 or 17.6%. The apparent discrepancy probably caused by different definition of “forested area” used in their classification. Plantation area was included as forest in their calculation while in this analysis it was excluded. In the other source, Regional Physical Planning Project for Transmigration ([15] RePPProt, 1989) classified forest area about 12,450 km2 or 9.5% of Java Island. Similar with this study, RePPProt also excluded plantation and estate when they calculated the forest area. Generally, this classification result is comparable to both sources. Even though ground resolution used in this study was lower (250 m) than both sources (30 m), but the classification result is rational and acceptable. 3.3. Accuracy Assessment For accuracy assessment, the overall accuracy and Kappa accuracy were computed for measuring map accuracy. Table 3 shows accuracy assessment for the possibility map of natural forest distribution in Java Island. Overall accuracy was 91.06% and Kappa accuracy of 86.7%, which seemed to be acceptable. The main misclassification appears between the “natu- ral forest” and “shrub or bush” and vice versa. The tran- sition of shrub or bush to be a forest in natural succession process and most of them located in the surrounding of natural forest contributed most to this misclassification. The reason for the misclassification between “secondary forest, plantation, estate and agriculture” and “non for- est” lies in the harvest activity that caused the land is not covered by any vegetation for a certain period before the land is ready to plant again. 4. Conclusion This study successfully demonstrated identification of natural forest distribution in Java for 2002 using MODIS NDVI 250 m multi-temporal imagery. The approach de- scribed herein provides classification accuracies compa- rable to those of maps derive from higher resolution data. Given that accuracy results are comparable, data vari- ability is greater, costs are lower, and the approach is simpler than other techniques typically used in large pro- jects. Moreover, the methodology provided in this study may offer a viable alternative for land cover change de- tection using multi-year MODIS NDVI dataset for re- gional or national land cover classification. 5. Acknowledgements The authors wish to express sincere thanks to Mr. Yukio Wada and Mr. Wataru Ohira (Japan Forest Technology Association) for sharing the SML program for Harmonic Reconstruction Data. We would like to thank the Centre of Environmental Research (PPLH-IPB) for giving us an opportunity to get the research fund. Osaka Gas Founda- tion partially founded this research. REFERENCES [1] H. L. Dale, L. A. Joyce, S. McNulty and R. P. Neilson, “The Interplay between Climate Change, Forests, and Disturbances,” The Science of the Total Environment, Vol. 262, No. 3, 2000, pp. 201-204. doi:10.1016/S0048-9697(00)00522-2 [2] Food and Agriculture Organization, “Global Forest Re- sources Assessment: Key Findings,” Food and Agricul- tural Organization of the United Nations, Rome, 2010. [3] World Bank, “A Revised Forest Strategy for the World Bank Group,” World Bank, Washington DC, 2001. [4] C. Probert, S. Sharrock and N. Ali, “A REDD+ Manual for Botanic Gardens,” Botanic Gardens Conservation In- ternational (BGCI), Richmond, United Kingdom & Royal Botanic Gardens, London, 2011. Copyright © 2012 SciRes. JGIS  SYARTINILIA, S. TSUYUKI 469 [5] R. Lubowski, “What Are the Costs and Potentials of REDD,” In: A. Angelsen, Ed., Moving Ahead with REDD: Issues, Options and Implication, Subur Printing, Indone- sia CIFOR, Bogor, 2008. [6] B. C. Reed, J. F, Brown, D. VanderZee, T. L. Loveland, J. W. Merchant and D. O. Ohlen, “Measuring Phonological Variability from Satellite Imagery,” Journal of Vegetation Science Vol. 5, No. 5, 1994, pp. 703-714. doi:10.2307/3235884 [7] T. R. Loveland, B. C. Reed, J. F. Brown, D. O. Ohlen, Z. Zhu, L. Yang and J. W. Merchant, “Development of Global Land Cover Characteristics Database and IGBP Discover from 1 km AVHRR Data,” International Jour- nal of Remote Sensing, Vol. 21, No. 6-7, 2000, pp. 1303- 1330. doi:10.1080/014311600210191 [8] G. B. Senay and R. L. Elliot, “Combining AVHRR-NDVI and Land Use Data to Describe Temporal and Spatial Dynamics of Vegetation,” Forest Ecology and Manage- ment, Vol. 128, No. 1-2, 2000, pp. 83-91. doi:10.1016/S0378-1127(99)00275-3 [9] J. F. Knight, R. L. Lunetta, J. Ediriwickrema and S. Khorram, “Regional Scale Land Cover Characterization Using MODIS NDVI 250 m Multi-Temporal Imagery: A Phenology-Based Approach,” GIScience and Remote Sensing, Vol. 43, No. 1, 2006, pp. 1-23. doi:10.2747/1548-1603.43.1.1 [10] R. S. Lunetta, J. F. Knight, J. Ediriwickrema, J. G. Lyon and L. D. Worthy, “Land-Cover Change Detection Using Multi-Temporal MODIS NDVI Data,” Remote Sensing of Environment, Vol. 105, No. 2, 2006, pp. 142-154. doi:10.1016/j.rse.2006.06.018 [11] T. Whitten, R. E, Soeriaatmadja and S. A. Afiff, “The Ecology of Java and Bali: The Ecology of Indonesia Se- ries,” Vol. 2, Periplus Editions, Singapore, 1996. [12] Y. Wada and W. Ohira, “Reconstruction Cloud Free SPOT/VEGETATION Using Harmonic Analysis with Local Maximum Fitting,” 2004. http://www. microimages.com/papers/ACRS25.pdf [13] M. E. Jakubauskas, D. R. Legates and J. H. Kastens, “Harmonic Analysis of Time-Series AVHRR NDVI Data,” Photogrammetric Engineering & Remote Sensing Vol. 67, No. 4, 2001, pp. 461-470. [14] Ministry of Forestry, “Recalculation of Production Forest, Protection and Conservation Forest,” 2nd Edition, The Agency of Forestry Planning, Ministry of Forestry, Ja- karta, 2002. [15] RePPProt, “Regional Physical Planning Programme for Indonesia, Review of Phase I Results: Java and Bali,” Directorate General of Settlement Preparation, Ministry of Transmigration, Jakarta; Natural Resources Institute, Overseas Development Administration, London, 1989. Copyright © 2012 SciRes. JGIS
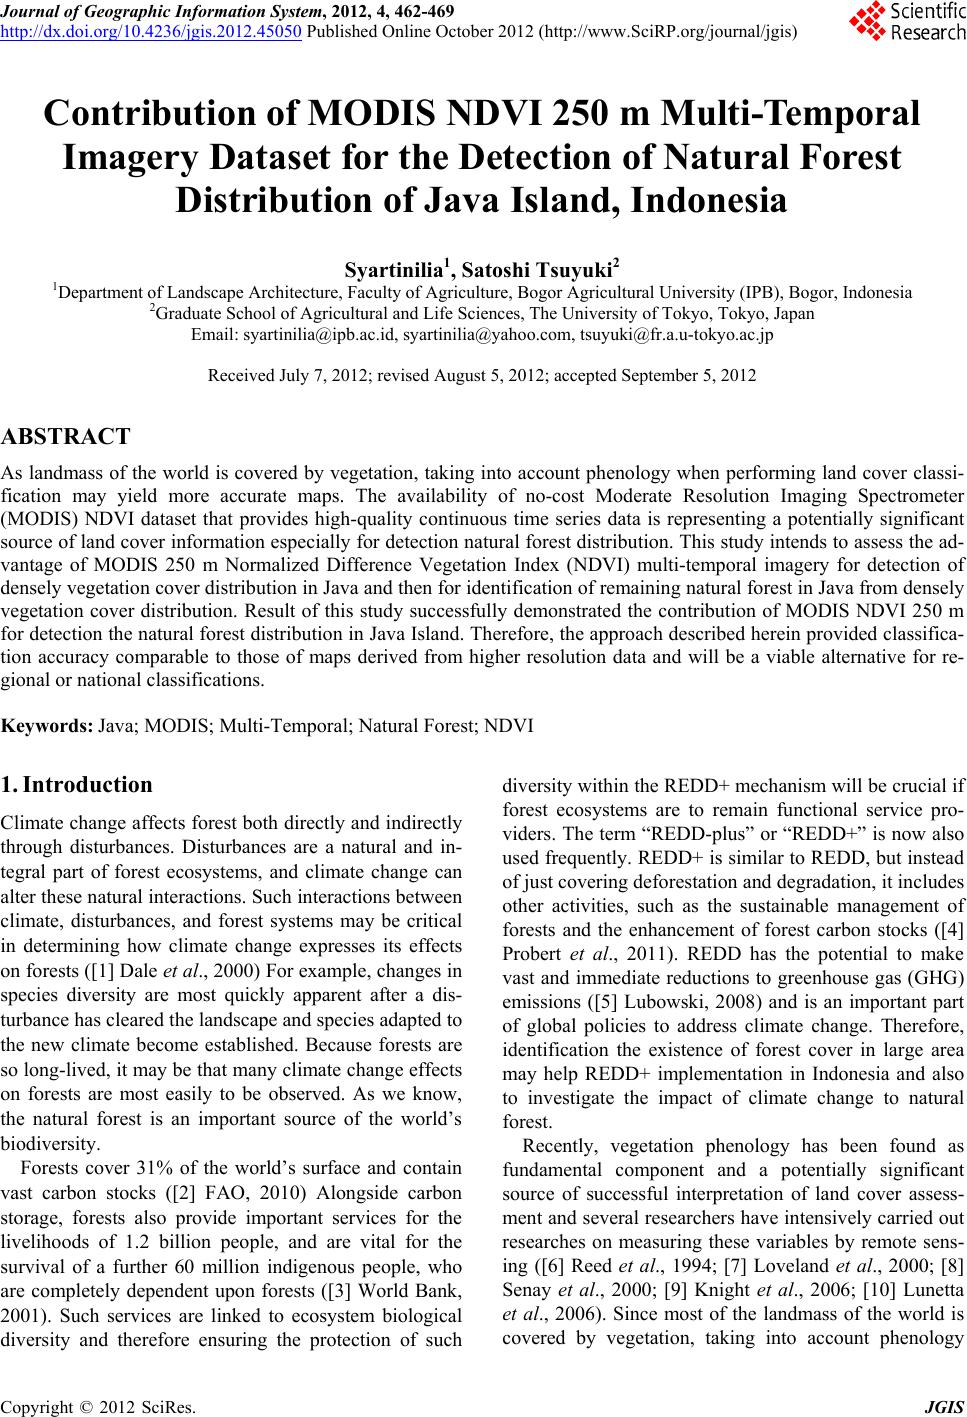
|