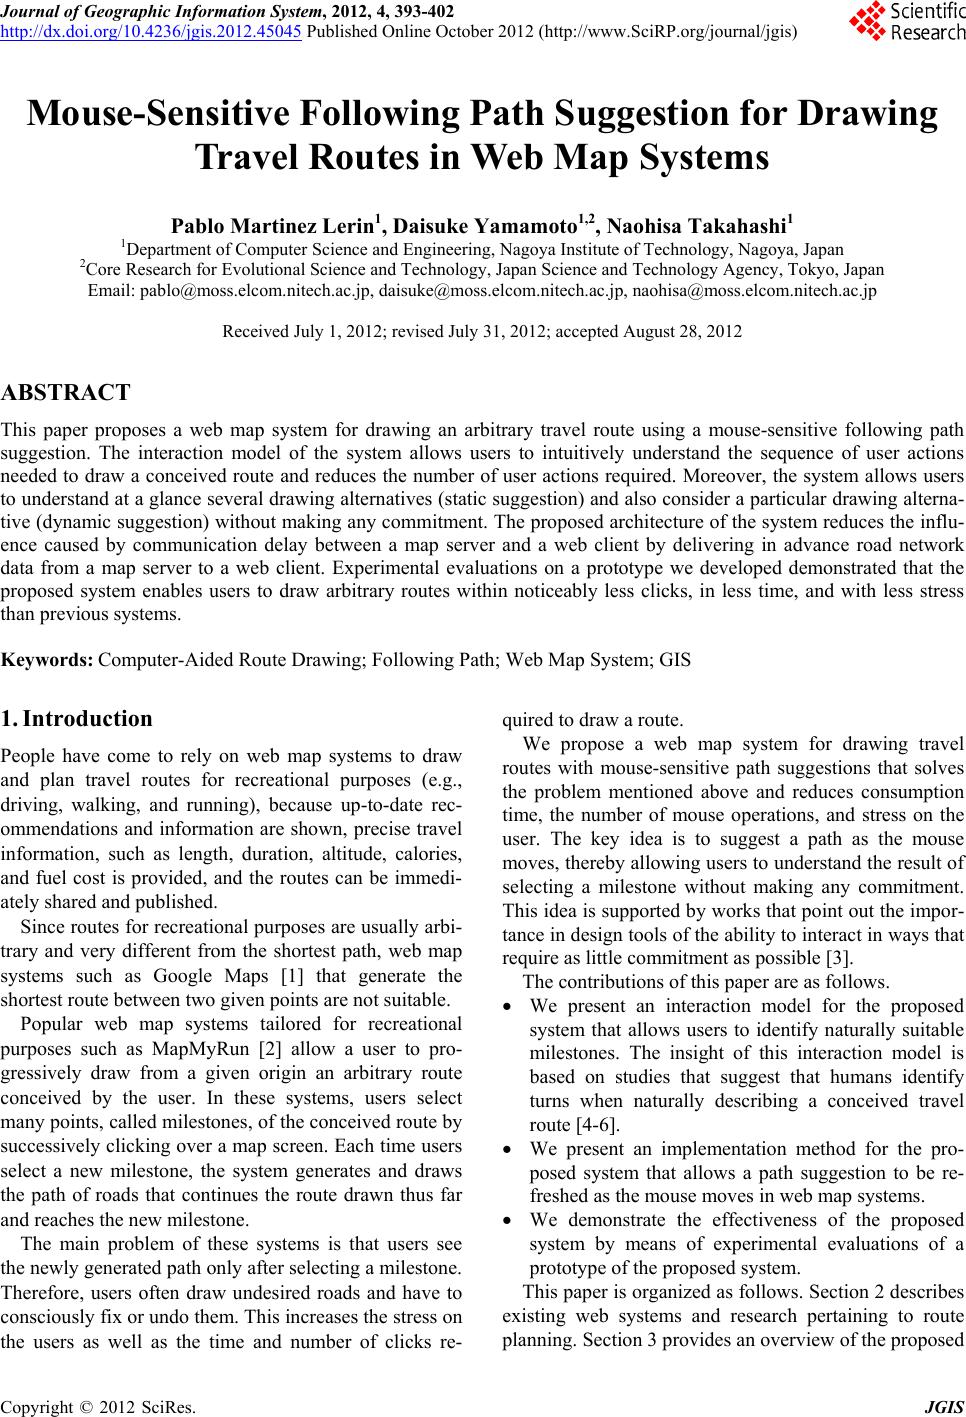
 Journal of Geographic Information System, 2012, 4, 393-402 http://dx.doi.org/10.4236/jgis.2012.45045 Published Online October 2012 (http://www.SciRP.org/journal/jgis) Mouse-Sensitive Following Path Suggestion for Drawing Travel Routes in Web Map Systems Pablo Martinez Lerin1, Dai suke Yamamoto1,2, Naohisa Takahashi1 1Department of Computer Science and Engineering, Nagoya Institute of Technology, Nagoya, Japan 2Core Research for Evolutional Science and Technology, Japan Science and Technology Agency, Tokyo, Japan Email: pablo@moss.elcom.nitech.ac.jp, daisuke@moss.elcom.nitech.ac.jp, naohisa@moss.elcom.nitech.ac.jp Received July 1, 2012; revised July 31, 2012; accepted August 28, 2012 ABSTRACT This paper proposes a web map system for drawing an arbitrary travel route using a mouse-sensitive following path suggestion. The interaction model of the system allows users to intuitively understand the sequence of user actions needed to draw a conceived route and reduces the number of user actions required. Moreover, the system allows users to understand at a glance several drawing alternatives (static suggestion) and also consider a particular drawing alterna- tive (dynamic suggestion) without making any commitment. The proposed architecture of the system reduces the influ- ence caused by communication delay between a map server and a web client by delivering in advance road network data from a map server to a web client. Experimental evaluations on a prototype we developed demonstrated that the proposed system enables users to draw arbitrary routes within noticeably less clicks, in less time, and with less stress than previous systems. Keywords: Computer-Aided Route Drawing; Following Path; Web Map System; GIS 1. Introduction People have come to rely on web map systems to draw and plan travel routes for recreational purposes (e.g., driving, walking, and running), because up-to-date rec- ommendations and information are shown, precise travel information, such as length, duration, altitude, calories, and fuel cost is provided, and the routes can be immedi- ately shared and published. Since routes for recreational purposes are usually arbi- trary and very different from the shortest path, web map systems such as Google Maps [1] that generate the shortest route between two given points are not suitable. Popular web map systems tailored for recreational purposes such as MapMyRun [2] allow a user to pro- gressively draw from a given origin an arbitrary route conceived by the user. In these systems, users select many points, called milestones, of the conceived route by successively clicking over a map screen. Each time users select a new milestone, the system generates and draws the path of roads that continues the route drawn thus far and reaches the new milestone. The main problem of these systems is that users see the newly generated path only after selecting a milestone. Therefore, users often draw undesired roads and have to consciously fix or undo them. This increases the stress on the users as well as the time and number of clicks re- quired to draw a route. We propose a web map system for drawing travel routes with mouse-sensitive path suggestions that solves the problem mentioned above and reduces consumption time, the number of mouse operations, and stress on the user. The key idea is to suggest a path as the mouse moves, thereby allowing users to understand the result of selecting a milestone without making any commitment. This idea is supported by works that point out the impor- tance in design tools of the ability to interact in ways that require as little commitment as possible [3]. The contributions of this paper are as follows. We present an interaction model for the proposed system that allows users to identify naturally suitable milestones. The insight of this interaction model is based on studies that suggest that humans identify turns when naturally describing a conceived travel route [4-6]. We present an implementation method for the pro- posed system that allows a path suggestion to be re- freshed as the mouse moves in web map systems. We demonstrate the effectiveness of the proposed system by means of experimental evaluations of a prototype of the proposed system. This paper is organized as follows. Section 2 describes existing web systems and research pertaining to route planning. Section 3 provides an overview of the proposed C opyright © 2012 SciRes. JGIS 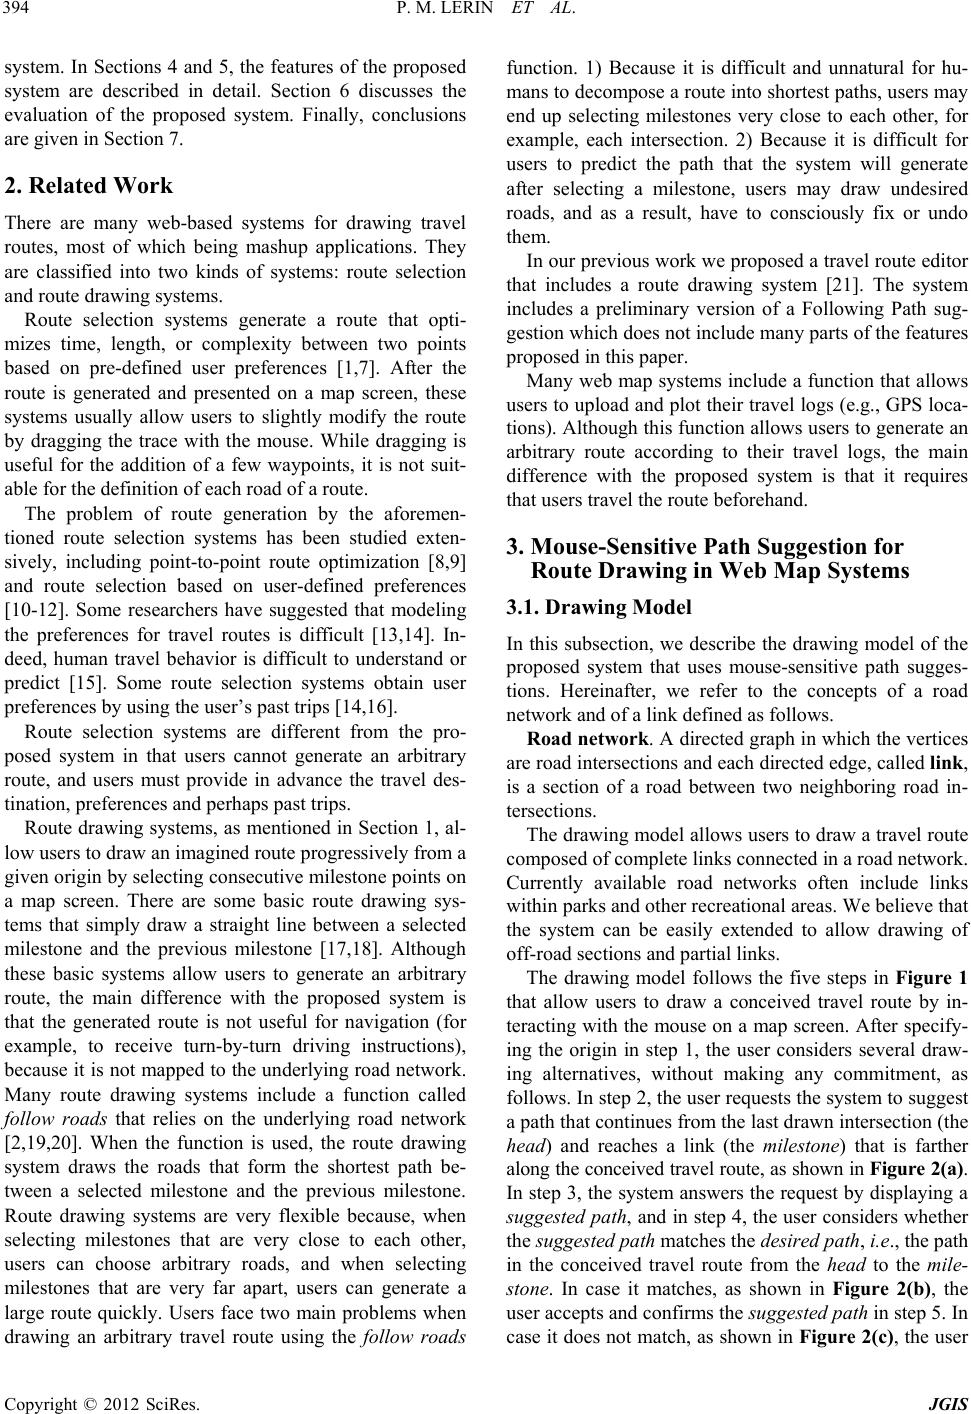 P. M. LERIN ET AL. 394 system. In Sections 4 and 5, the features of the proposed system are described in detail. Section 6 discusses the evaluation of the proposed system. Finally, conclusions are given in Section 7. 2. Related Work There are many web-based systems for drawing travel routes, most of which being mashup applications. They are classified into two kinds of systems: route selection and route drawing systems. Route selection systems generate a route that opti- mizes time, length, or complexity between two points based on pre-defined user preferences [1,7]. After the route is generated and presented on a map screen, these systems usually allow users to slightly modify the route by dragging the trace with the mouse. While dragging is useful for the addition of a few waypoints, it is not suit- able for the definition of each road of a route. The problem of route generation by the aforemen- tioned route selection systems has been studied exten- sively, including point-to-point route optimization [8,9] and route selection based on user-defined preferences [10-12]. Some researchers have suggested that modeling the preferences for travel routes is difficult [13,14]. In- deed, human travel behavior is difficult to understand or predict [15]. Some route selection systems obtain user preferences by using the user’s past trips [14,16]. Route selection systems are different from the pro- posed system in that users cannot generate an arbitrary route, and users must provide in advance the travel des- tination, preferences and perhaps past trips. Route drawing systems, as mentioned in Section 1, al- low users to draw an imagined route progressively from a given origin by selecting consecutive milestone points on a map screen. There are some basic route drawing sys- tems that simply draw a straight line between a selected milestone and the previous milestone [17,18]. Although these basic systems allow users to generate an arbitrary route, the main difference with the proposed system is that the generated route is not useful for navigation (for example, to receive turn-by-turn driving instructions), because it is not mapped to the underlying road network. Many route drawing systems include a function called follow roads that relies on the underlying road network [2,19,20]. When the function is used, the route drawing system draws the roads that form the shortest path be- tween a selected milestone and the previous milestone. Route drawing systems are very flexible because, when selecting milestones that are very close to each other, users can choose arbitrary roads, and when selecting milestones that are very far apart, users can generate a large route quickly. Users face two main problems when drawing an arbitrary travel route using the follow roads function. 1) Because it is difficult and unnatural for hu- mans to decompose a route into shortest paths, users may end up selecting milestones very close to each other, for example, each intersection. 2) Because it is difficult for users to predict the path that the system will generate after selecting a milestone, users may draw undesired roads, and as a result, have to consciously fix or undo them. In our previous work we proposed a travel route editor that includes a route drawing system [21]. The system includes a preliminary version of a Following Path sug- gestion which does not include many parts of the features proposed in this paper. Many web map systems include a function that allows users to upload and plot their travel logs (e.g., GPS loca- tions). Although this function allows users to generate an arbitrary route according to their travel logs, the main difference with the proposed system is that it requires that users travel the route beforehand. 3. Mouse-Sensitive Path Suggestion for Route Drawing in Web Map Systems 3.1. Drawing Model In this subsection, we describe the drawing model of the proposed system that uses mouse-sensitive path sugges- tions. Hereinafter, we refer to the concepts of a road network and of a link defined as follows. Road network. A directed graph in which the vertices are road intersections and each directed edge, called link, is a section of a road between two neighboring road in- tersections. The drawing model allows users to draw a travel route composed of complete links connected in a road network. Currently available road networks often include links within parks and other recreational areas. We believe that the system can be easily extended to allow drawing of off-road sections and partial links. The drawing model follows the five steps in Figure 1 that allow users to draw a conceived travel route by in- teracting with the mouse on a map screen. After specify- ing the origin in step 1, the user considers several draw- ing alternatives, without making any commitment, as follows. In step 2, the user requests the system to suggest a path that continues from the last drawn intersection (the head) and reaches a link (the milestone) that is farther along the conceived travel route, as shown in Figure 2(a). In step 3, the system answers the request by displaying a suggested path, and in step 4, the user considers whether the suggested path matches the desired path, i.e., the path in the conceived travel route from the head to the mile- stone. In case it matches, as shown in Figure 2(b), the user accepts and confirms the suggested path in step 5. In case it does not match, as shown in Figure 2(c), the user Copyright © 2012 SciRes. JGIS 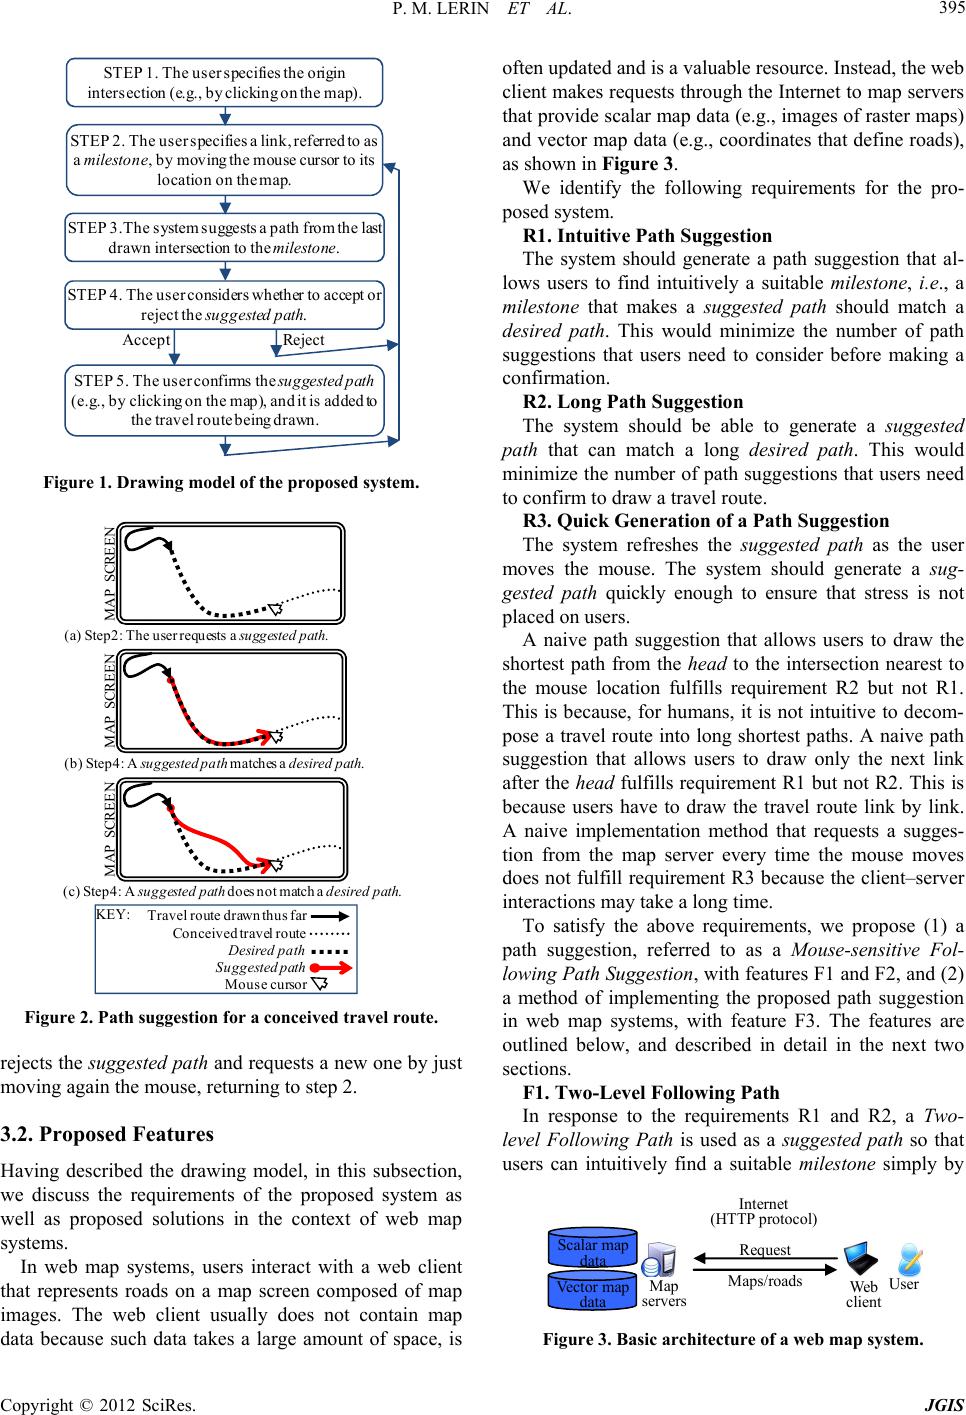 P. M. LERIN ET AL. 395 Accept Reject STEP 4. The user considers whether to accept or reject the suggested path. STEP 3.The system suggests a path from the last drawn intersection to the milestone. STEP 2. The user specifies a link, referred to as a milestone, by moving the mouse cursor to its location on the map. STEP 1. The user specifies the origin intersection (e.g., by clicking on the map). STEP 5. The user confirms the suggested path (e.g., by clicking on the map), and it is added to the travel route being drawn. Figure 1. Drawing model of the proposed system. (b) Step4: A suggested pathmatches a desired path. (c) Step4: A suggested pathdoes not match a desired path. (a) Step2: The user requests a suggested path. MAP SCREENMAP SCREENMAP SCREEN Travel route drawn thus far Conceived travel route Mouse cursor Suggested path KEY: Desired path Figure 2. Path suggestion for a conceived travel route. rejects the suggested path and requests a new one by just moving again the mouse, returning to step 2. 3.2. Proposed Features Having described the drawing model, in this subsection, we discuss the requirements of the proposed system as well as proposed solutions in the context of web map systems. In web map systems, users interact with a web client that represents roads on a map screen composed of map images. The web client usually does not contain map data because such data takes a large amount of space, is often updated and is a valuable resource. Instead, the web client makes requests through the Internet to map servers that provide scalar map data (e.g., images of raster maps) and vector map data (e.g., coordinates that define roads), as shown in Figure 3. We identify the following requirements for the pro- posed system. R1. Intuitive Path Suggestion The system should generate a path suggestion that al- lows users to find intuitively a suitable milestone, i.e., a milestone that makes a suggested path should match a desired path. This would minimize the number of path suggestions that users need to consider before making a confirmation. R2. Long Path Suggestion The system should be able to generate a suggested path that can match a long desired path. This would minimize the number of path suggestions that users need to confirm to draw a travel route. R3. Quick Generation of a Path Suggestion The system refreshes the suggested path as the user moves the mouse. The system should generate a sug- gested path quickly enough to ensure that stress is not placed on users. A naive path suggestion that allows users to draw the shortest path from the head to the intersection nearest to the mouse location fulfills requirement R2 but not R1. This is because, for humans, it is not intuitive to decom- pose a travel route into long shortest paths. A naive path suggestion that allows users to draw only the next link after the head fulfills requirement R1 but not R2. This is because users have to draw the travel route link by link. A naive implementation method that requests a sugges- tion from the map server every time the mouse moves does not fulfill requirement R3 because the client–server interactions may take a long time. To satisfy the above requirements, we propose (1) a path suggestion, referred to as a Mouse-sensitive Fol- lowing Path Suggestion, with features F1 and F2, and (2) a method of implementing the proposed path suggestion in web map systems, with feature F3. The features are outlined below, and described in detail in the next two sections. F1. Two-Level Following Path In response to the requirements R1 and R2, a Two- level Following Path is used as a suggested path so that users can intuitively find a suitable mileston e simply by Vector map data Request Maps/roads Internet (HTTP protocol) Web client User Map servers Scalar map data Figure 3. Basic architecture of a web map system. Copyright © 2012 SciRes. JGIS  P. M. LERIN ET AL. 396 identifying the next turn after the head in the conceived travel route. A Two-level Following Path can be long because it includes the entire path from the head to its next turn. In fact, it also includes the next link after the turn, so it becomes even longer. F2. Two-Layer Preview In response to requirement R1, a Two-layer Preview function displays a path suggestion composed of (1) a static layer that allows users to understand at a glance all the possible turns after the head and (2) a dynamic layer that allows users to consider a Two-level Following Path to one particular turn. F3. Speculative Prefetching In response to requirement R3, and considering that Internet communications may be delayed unpredictably, a Speculative Prefetching function minimizes the client- server interactions by delivering to the client in advance road network data that may be needed to generate a sug- gestion. Moreover, the function delivers the road data in a data structure called a Following Path Tree, which al- lows a Two-level Following Path to be generated very quickly. 4. Mouse-Sensitive Following Path Suggestion In this section, we describe the proposed path suggestion, which is composed of a static layer and a dynamic layer. The layers are defined by the Two-layer Preview func- tion using the concepts of a Following Path and a Two-level Following Path. 4.1. Following Path In the context of travel routes, a Following Path is con- sidered a path between two consecutive turns of a travel route, where a turn is an intersection along the travel route where the traveler must change orientation and explicitly switch to a different road. Each link in a Fol- lowing Path is considered the Following Link of its predecessor link. Below we give formal definitions of the concepts Fol- lowing Path and Following Link using the FL ink function as follows. Function FLink (L,G). Given a link L and a road net- work G, the function returns a link computed by obeying the rules prescribed below. When no link obeys the rules, the function returns NULL. Let us consider L1–LN as the N links that are connected to L and belong to G. Further, let us denote by αi the deviation (angle) between the links L and Li, as shown in Figure 4. Rule 1. When the deviation αi between L and Li is the smallest among the deviations αk (1 ≤ k ≤ N) between L and the connected links and αi < αmax, the function returns Li, as shown in Figure 4. The angle αmax is a system pa- rameter that avoids selecting a link that humans would consider a turn. Rule 2. When the length of the link Li is less than l0, we assume that the links connected to Li are directly connected to L, as shown in Figure 5. The short length l0 is a system parameter that determines when a link is too short. Very short links indicate misalignments, as shown in Figure 6, for which the function FLink(L,G) uses rule 2 to return the link LS. In the prototype system, we defined the parameters αmax = 40˚ and l0 = 5 m, after performing experimental tests with our road network data. A small change in the parameters would not significantly affect the result of the function. Following Link. A link LF is the Following Link of a link L in a road network G if and only if FLink(L,G) = LF. A link in a road network may have one Following Link or any. Following Path. A path P of connected links, P = (L1, L2, ... LN), in a road network G is considered a Following Path if and only if each link is Following Link of its predecessor, i.e., FLink(Lj,G) = Li , i = j – 1, 1< j ≤ N. L 2 0˚ 90˚ 90˚ L L 1 α i L N L i 180˚ Figure 4. Deviation (angle ) between the link L and the links connected to L. L Connect these links to L L (< l 0 ) L i Links connected to L i Figure 5. Rule 2 of function FLink. i Map image Road network S Figure 6. Example of a slightly misaligned intersection. Copyright © 2012 SciRes. JGIS  P. M. LERIN ET AL. 397 The defined concepts are extensions of concepts used in the Following Path Algorithm, which was proposed in our previous work [22]. 4.2. Two-Level Following Path A Two-level Following Path is a path composed of a Following Path and a link connected to the Following Path. When used as a suggestion, it allows users to draw any Following Path followed by any link, i.e., it allows users to draw the path from the last drawn intersection to the next turn and the direction of the turn. Given an intersection, the head, and a mouse location (a location on a map screen), a Two-level Following Path is defined as follows. First, let us consider the concepts reachable links and milestone. Reachable Links: All links in a road network whose start intersection can be reached from the head by a Fol- lowing Path. Milestone: The link of the reachable links that is nearest to the mouse location. Two-level Follo wing Path: The path composed of (1) the Follo wing Path from the head to the start intersection of the milestone and (2) the milestone. When the head is the start intersection of the milestone, the Two-level Fol- lowing Path is composed of only the milestone. The topology of the road network may make the gen- eration of a path ambiguous; for example, when two reachable links have the same shape points in opposite directions (although this is a very unusual case). When more than one path can be generated, the shortest path is chosen, where the length of a path is the sum of the length of its links. When used as a suggestion, if the chosen path is not the desired one, the user only needs to move the mouse to a link closer to head. Mapping the given mouse location to a link, instead of an intersection, allows users to choose between two dif- ferent Two-level Following Paths that reach the same intersection, which is a common case. Figure 7 shows snapshots of two paths that reach the same intersection displayed over a road network. 4.3. Two-Layer Preview A Two-layer Preview function displays a path suggestion in two layers: a static layer and a dynamic layer. Both layers are always displayed on the map screen, in a dif- ferent way so that users can distinguish them (e.g., in dif- ferent colors). A static layer allows users to understand at a glance all the possible turns after the last drawn point, the head, and is refreshed only when the head is updated. A dynamic layer allows users to consider a Two-level Following Path to one particular turn, and is refreshed every time the mouse location is updated. Figure 8 shows the two stages displayed over a road network. Below we define the contents of each layer. Let us consider the system parameter maxSize that defines a limit on the number of links of a path suggestion. The maxSize parameter should have a value that allows users to draw a long Two-level Following Path, for example, from one side of the map screen to the other. Static Layer: All Possible Following Paths. Given an intersection head, the static layer is com- posed of the Following Path in a road network that starts from each link connected to the head and continues until the path reaches a link that has no Following Link or until the path reaches maxSize links. Dynamic Layer: A Two-Level Following Path. Given an intersection head and a mouse location, the dynamic layer is composed of the Two-level Following Path, where the path cannot be longer than maxSize links. 5. Speculative Prefetching In this section, we describe the proposed function for implementing a Mouse-sensitive Following Path Sugges- tion. First, we define the data structure and methods used by the function and then we describe the behavior of the function. 5.1. Following Path Tree In this subsection, we define the Following Path Tree (FPT) data structure, and explain methods for building and mining an FPT. Let us consider the concepts Follow- ing Link and Following Path defined in subsection 4.1. Travel route drawn thus far Mouse cursor Suggested path KEY: Figure 7. Snapshots of a suggested two-level following path. MAP SCREEN Travel route drawn thus far Mouse cursor Static layer Dynamic layer KEY: Figure 8. Example of the result of a two-layer preview. Copyright © 2012 SciRes. JGIS  P. M. LERIN ET AL. 398 Following Path Tree (FPT): an FPT is a tree struc- ture composed of a root and a set of nodes pNode. An FPT contains the road network data needed to generate the static layer and all possible dynamic layers of a Mouse-sensitive Following Path Suggestion from a given intersection, the head, considering the system parameter maxSize. pNode: a pNode is a node in an FPT; it contains the following attributes. Type: the type can be FollowNode or TurnNode. Link: data of a link, which includes a link identifier and a sequence of coordinates (longitude, latitude) that defines its shape. Children: an association to a set of child nodes. In an FPT, a pNode can have only one parent and a link cannot be in more than one pNode. The nodes in an FPT are related as follows. 1) A child’s link is connected to its parent’s link in a road network. 2) The link of a child of type FollowNode is the Following Link of its parent’s link in a road network. Method BuildFPT. Given the head and maxSize, an FPT is built as fol- lows. Step 1. A pNode of type FollowNode is made and added to the FPT with each link from the Following Paths that start from the head. Each Following Path con- tinues until a link that has no Following Link has been reached or maxSize -1 links have been reached. Step 2. A pNode is made and added to the FPT with each link that is not already in the FPT and is connected to a link added in the step 1. An example of a built FPT (with maxSize = 3) is shown in Figure 9. The links contained in the FPT are represented by arrows on the road network (above). The pNodes of the FPT are represented by squares, and its relations are represented by arrows (below). Colored squares represent the pNodes of type FollowNode. For simplicity, only some links are labeled. Method MineAllFP . Given an FPT, the static layer of a Mouse-sensitive Following Path Suggestion is generated by drawing the link of each pNode of type FollowNode in the FPT. Method Mine2LFP. Given an FPT and a mouse location, a dynamic layer of a Mouse-sensitive Following Path Suggestion, i.e., a Two-level Following Path, is generated as follows. First, the pNode in the FPT whose link is nearest to the mouse location is searched. Then, the dynamic layer is gener- ated by drawing the link of the found pNode and the links of all its ascendant pNodes in the FPT. 5.2. Data Flow in Speculative Prefetching In this subsection, we first describe the structure of the Speculative Prefetching function, and then explain its behavior. The structure of the Speculative Prefetching function is composed of two data sets and three methods, as shown in Figure 10. The web client contains a data set composed of a Following Path Three (FPT), and exe- cutes the two methods that mine the FPT. The map server contains a data set composed of the available road net- work data and executes the method to build an FPT. The described function responds to two events: when the last drawn point, the head, is updated, and when the mouse location is updated. Considering the drawing steps described in Section 3, the last drawn point is updated when the user specifies the start intersection (step 1), and when the user confirms a path suggestion (step 5). The mouse location is updated when the user moves the mouse to consider a new path suggestion (step 3). Below we describe the data flow for each event. DF1. Event Head Updated. First, an FPT is prefetched as follows. The web client sends a request to the map server sending the new head. The method BuildFPT in the map server generates an 1 2 3 4 5 6 7 10 9 8 FPT L10 L L L L L L L8 LL L LL L L1 L2 L4L5 L3 L6L7 L9 L L L L L L Figure 9. Example of a built FPT, including its links repre- sented on a road network (above) and the relation of its nodes (below ). Web client Head FPT Head Mouse location Suggest i on (dynamic layer) Road network data Suggest i on (static layer) Build FPT MineAllFP Mine2LFP FPT Map server Figure 10. Overview of speculative prefetching. Copyright © 2012 SciRes. JGIS  P. M. LERIN ET AL. 399 FPT by using the stored road network data and the re- ceived head. The map server replies, sending the gener- ated FPT, and the web client stores it, replacing the pre- vious FTP. Then, the method MineAllFP in the web client gener- ates the static layer of the proposed path suggestion, i.e., All Possible Following Paths, by using the stored FPT. DF2. Event Mouse Location Updated. The method Mine2LFP in the web client generates the dynamic layer of the proposed path suggestion, i.e., A Two-level Following Path Suggestion, by using the stored FPT and the new mouse location. If an FPT is being prefetched, this event waits to occur. The described function performs prefetching because it delivers road network data to the web client before it is required and performs speculation, because it delivers data that may be not actually used. As a result, a Two-level Following Path Suggestion is generated with- out requiring client–server interactions over the Internet. 6. Evaluation 6.1. Prototype System We evaluated the usability of the proposed system by using a prototype web map system. We developed the map server using Java Servlets and the web client using Adobe Flash Builder 4. The web client is composed of a toolbar and a map screen, as shown in Figure 11, where a travel route is being drawn using the proposed system (the key is the same as in Figure 8). Users change the map scale using the mouse wheel, and pan the map by dragging the mouse, in a way similar to conventional web map systems such as Google Maps. The developed prototype allows users to draw a con- ceived travel route by using one of the following sys- tems. Figure 11. Screenshot of our prototype system. Baseline System (One Link Suggestion System). The system uses a naive mouse-sensitive suggestion such that users draw a travel route link by link. This system can be implemented by using the proposed system and setting maxSize to 0. Previous System (Shortest Path Drawing System). The system allows users to draw the shortest path from the last drawn point to a clicked point (mile- stone). The system does not use a mouse-sensitive suggestion, i.e., the roads are drawn only after users click. The system uses the same interaction as in popular route drawing systems such as MapMyRun [2] described in Section 2. Proposed System (Following Path Suggestion Sys- tem). This is the proposed system (with maxSize = 30). We chose the parameter maxSize after doing em- pirical tests on a common map screen (width: 1024 px, map scale: 1:40,000) which concluded that, in areas with dense road networks (cities), the Following Paths that reach from one side of the map screen to the other have an average of 30 links. When using the baseline system and the proposed sys- tem in our prototype, users interact as follows. The user clicks the mouse on the map screen in order to specify the origin point and confirm a suggestion. The user then moves the mouse over the map screen in order to con- sider a suggestion. Finally, the user can click a button on the toolbar in order to undo the last user action. When using the previous system in our prototype, us- ers interact as follows. The user clicks the mouse on the map screen in order to specify the origin point and spec- ify a milestone. The user clicks a button in the toolbar in order to undo the last user action. We included in the evaluation the baseline system as a reference to help compare the proposed system with the previous system. 6.2. Experiment We conducted the following experiment in order to compare the three systems. We gave sketch routes on paper to subjects, and asked them to draw the routes us- ing the prototype. A sketch route is very similar to a mental representa- tion of a route [5,6,23]. A sketch route is composed of arrows for roads, colored shapes for parks and rivers, and verbal annotations for the descriptions of buildings, as shown in Figure 12. In order to draw a sketch route in a web map system, users find the start point and the suc- cessive milestones by relating the information in the sketch route to the information on the map screen, for example, the name of a building or a turn. If a user draws the same sketch route twice, the process would possibly be easier the second time because the user would re- member the information presented on the map screen. Copyright © 2012 SciRes. JGIS  P. M. LERIN ET AL. 400 Figure 12. A sketch route used in the experiment. In the experiment, we used three sketch routes from large cities in Japan that were unfamiliar to the subjects. Table 1 lists these sketch routes. The experiment was performed by 21 university stu- dents. Each sketch route was drawn 21 times, 7 times for each system. We ensured that a person did not draw the same route twice. In addition, we randomized the order of the systems used by a subject. Further, subjects prac- ticed using the systems for 5 min beforehand. The sub- jects performed the tasks using different desktop com- puters with Internet connections and always having the same map screen size (1024 × 768 px). We compared the systems with respect to the follow- ing three metrics. 1) Number of operations required to draw a route. An operation is considered a click on the map screen or a click on the undo button on the toolbar. 2) Time elapsed since a subject starts drawing a route until the route is completely drawn. 3) Questionnaire. After the experiment, subjects an- swered the following questions based on the five-point Likert scale; here, 5 is “strongly agree”, and 1 is “strongly disagree”. The questionnaire included the following questions: Learnability. Is it easy to learn to use the system? Table 1. Sketch routes used in the e xperiment. City Length (km) Number of links Number of turns Route1 Sapporo 4.5 84 30 Route2 Naha 4 79 25 Route3 Takamatsu 3.5 64 28 Usability. Is it easy to draw a route with the system? Lightness. Is the response of the system fast? Stress. Do you feel stressed when using the system? 6.3. Results Figures 13 and 14 show the results for of the average number of operations and the average amount of time required to draw each route, respectively, using each system under evaluation. The results clearly that, on average, users using the baseline system complete a task using a higher number of clicks than users using the other two systems. However, the amount of time required to complete a task using the baseline system is not so different from the other two systems, which suggests that users require more time to choose a long path than to choose a path composed of only one link. Considering the proposed system and the previous system, the results show that, on average, users using the proposed system complete a task using 34% less clicks and 18% less time than users using the previ- ous system. The results for the number of clicks were statistically significant at 5% level by the Student’s t-Test. The results for the amount of time were not statis- tically significant, because the time required to draw a route varies according to the skills of the user. Figure 15 shows the results of the questionnaire, i.e., the average of the answers for each of the four questions for each of the three systems under evaluation. 0 20 40 60 80 100 route1 route2 route3 Baseline systemPrevious systemProposed system Figure 13. Average number of operations required to draw a route. 0 1 2 3 4 route1 route2 route3 Baseline systemPrevious systemProposed system Figure 14. Average amount of time (in minutes) required to draw a r oute. Copyright © 2012 SciRes. JGIS 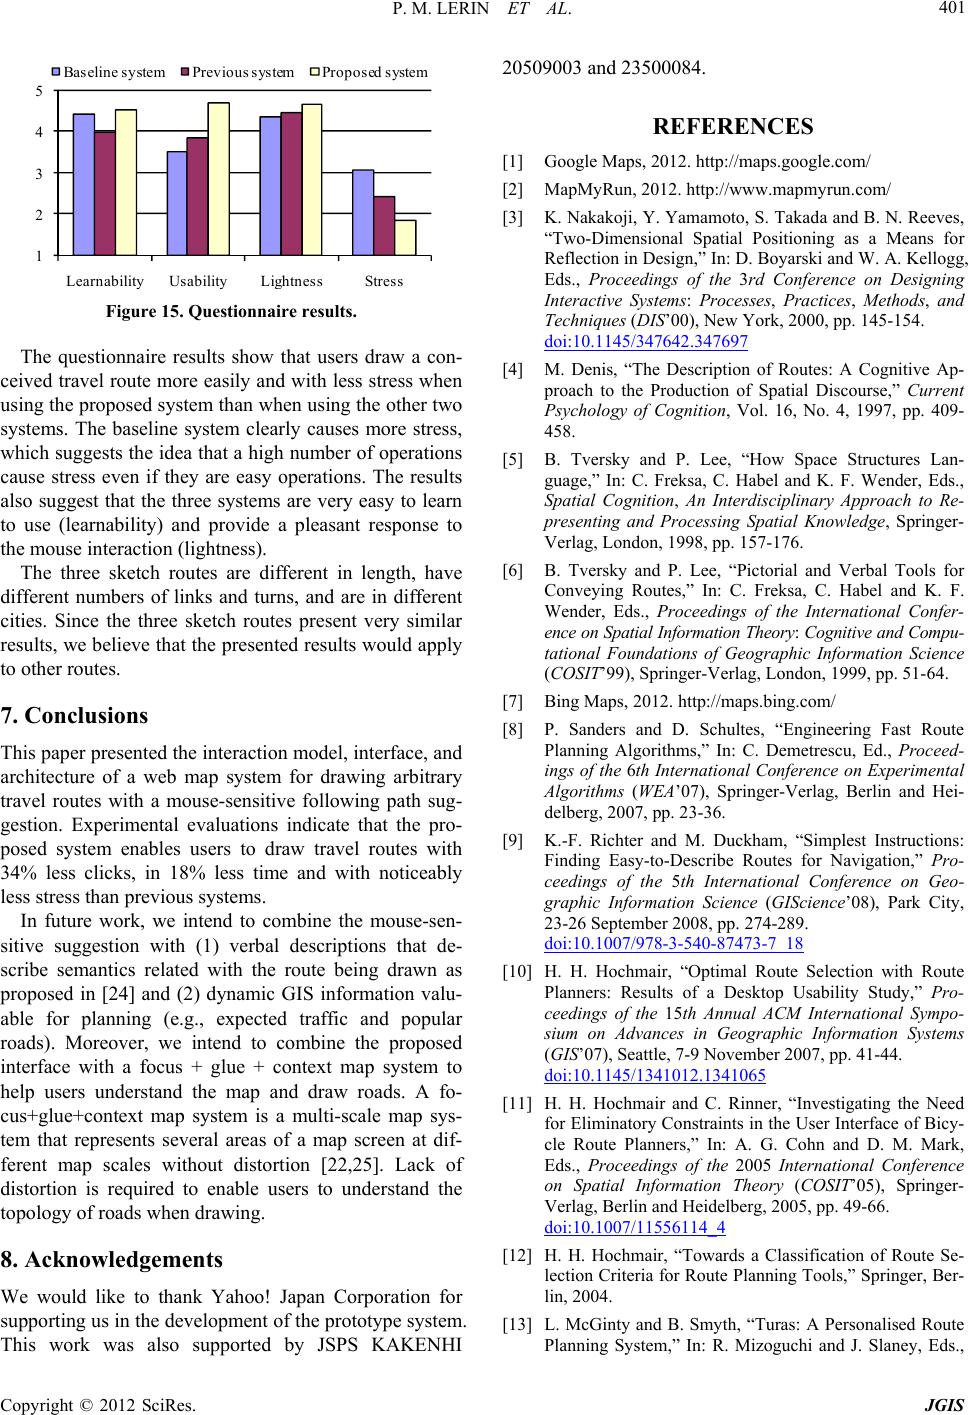 P. M. LERIN ET AL. 401 1 2 3 4 5 Learnabilit Usabilit Li htness Stress Baseline systemPrevious systemProposed system Figure 15. Questionnaire results. The questionnaire results show that users draw a con- ceived travel route more easily and with less stress when using the proposed system than when using the other two systems. The baseline system clearly causes more stress, which suggests the idea that a high number of operations cause stress even if they are easy operations. The results also suggest that the three systems are very easy to learn to use (learnability) and provide a pleasant response to the mouse interaction (lightness). The three sketch routes are different in length, have different numbers of links and turns, and are in different cities. Since the three sketch routes present very similar results, we believe that the presented results would apply to other routes. 7. Conclusions This paper presented the interaction model, interface, and architecture of a web map system for drawing arbitrary travel routes with a mouse-sensitive following path sug- gestion. Experimental evaluations indicate that the pro- posed system enables users to draw travel routes with 34% less clicks, in 18% less time and with noticeably less stress than previous systems. In future work, we intend to combine the mouse-sen- sitive suggestion with (1) verbal descriptions that de- scribe semantics related with the route being drawn as proposed in [24] and (2) dynamic GIS information valu- able for planning (e.g., expected traffic and popular roads). Moreover, we intend to combine the proposed interface with a focus + glue + context map system to help users understand the map and draw roads. A fo- cus+glue+context map system is a multi-scale map sys- tem that represents several areas of a map screen at dif- ferent map scales without distortion [22,25]. Lack of distortion is required to enable users to understand the topology of roads when drawing. 8. Acknowledgements We would like to thank Yahoo! Japan Corporation for supporting us in the development of the prototype system. This work was also supported by JSPS KAKENHI 20509003 and 23500084. REFERENCES [1] Google Maps, 2012. http://maps.google.com/ [2] MapMyRun, 2012. http://www.mapmyrun.com/ [3] K. Nakakoji, Y. Yamamoto, S. Takada and B. N. Reeves, “Two-Dimensional Spatial Positioning as a Means for Reflection in Design,” In: D. Boyarski and W. A. Kellogg, Eds., Proceedings of the 3rd Conference on Designing Interactive Systems: Processes, Practices, Methods, and Techniques (DIS’00), New York, 2000, pp. 145-154. doi:10.1145/347642.347697 [4] M. Denis, “The Description of Routes: A Cognitive Ap- proach to the Production of Spatial Discourse,” Current Psychology of Cognition, Vol. 16, No. 4, 1997, pp. 409- 458. [5] B. Tversky and P. Lee, “How Space Structures Lan- guage,” In: C. Freksa, C. Habel and K. F. Wender, Eds., Spatial Cognition, An Interdisciplinary Approach to Re- presenting and Processing Spatial Knowledge, Springer- Verlag, London, 1998, pp. 157-176. [6] B. Tversky and P. Lee, “Pictorial and Verbal Tools for Conveying Routes,” In: C. Freksa, C. Habel and K. F. Wender, Eds., Proceedings of the International Confer- ence on Spatial Information Theory: Cognitive and Compu- tational Foundations of Geographic Information Science (COSIT’99), Springer-Verlag, London, 1999, pp. 51-64. [7] Bing Maps, 2012. http://maps.bing.com/ [8] P. Sanders and D. Schultes, “Engineering Fast Route Planning Algorithms,” In: C. Demetrescu, Ed., Proceed- ings of the 6th International Conference on Experimental Algorithms (WEA’07), Springer-Verlag, Berlin and Hei- delberg, 2007, pp. 23-36. [9] K.-F. Richter and M. Duckham, “Simplest Instructions: Finding Easy-to-Describe Routes for Navigation,” Pro- ceedings of the 5th International Conference on Geo- graphic Information Science (GIScience’08), Park City, 23-26 September 2008, pp. 274-289. doi:10.1007/978-3-540-87473-7_18 [10] H. H. Hochmair, “Optimal Route Selection with Route Planners: Results of a Desktop Usability Study,” Pro- ceedings of the 15th Annual ACM International Sympo- sium on Advances in Geographic Information Systems (GIS’07), Seattle, 7-9 November 2007, pp. 41-44. doi:10.1145/1341012.1341065 [11] H. H. Hochmair and C. Rinner, “Investigating the Need for Eliminatory Constraints in the User Interface of Bicy- cle Route Planners,” In: A. G. Cohn and D. M. Mark, Eds., Proceedings of the 2005 International Conference on Spatial Information Theory (COSIT’05), Springer- Verlag, Berlin and Heidelberg, 2005, pp. 49-66. doi:10.1007/11556114_4 [12] H. H. Hochmair, “Towards a Classification of Route Se- lection Criteria for Route Planning Tools,” Springer, Ber- lin, 2004. [13] L. McGinty and B. Smyth, “Turas: A Personalised Route Planning System,” In: R. Mizoguchi and J. Slaney, Eds., Copyright © 2012 SciRes. JGIS  P. M. LERIN ET AL. Copyright © 2012 SciRes. JGIS 402 Proceedings of the 6th Pacific Rim International Confer- ence on Artificial Intelligence (PRICAI’00), Springer-Verlag, Berlin and Heidelberg, 2000, pp. 791-791. [14] J. Letchner, J. Krumm and E. Horvitz, “Trip Router with Individualized Preferences (TRIP): Incorporating Person- alization into Route Planning,” In: B. Porter, Ed., Pro- ceedings of the 18th Conference on Innovative Applica- tions of Artificial Intelligence-Volume 2 (IAAI’06), AAAI Press, Palo Alto, 2006, pp. 1795-1800 [15] R. G. Golledge and T. Gärling, “Spatial Behavior in Transportation Modeling and Planning,” In: K. Goulias, Ed., Transportation and Engineering Handbook, 2001. [16] Y. Zheng and X. Xie, “Learning Travel Recommenda- tions from User-generated GPS Traces,” ACM Transac- tions on Intelligent Systems and Technology, Vol. 2, No. 1, 2011, pp. 1-29. [17] USA Track & Field, 2012. http://www.usatf.org/ [18] RunningMap, 2012. http://www.runningmap.com/ [19] Bikely, 2012. http://www.bikely.com/ [20] iFit, 2012. http://www.ifit.com/ [21] P. M. Lerin, D. Yamamoto and N. Takahashi, “A Travel Route Editor on a Focus+Glue+Context Map,” Proceed- ings of the 1st International Workshop on Pervasive Web Mapping, Geoprocessing and Services (WEBMGS 2010), Como, 26-27 August 2010. [22] D. Yamamoto, S. Ozeki and N. Takahashi, “Focus+ Glue+Context: An Improved Fisheye Approach for Web Map Services,” Proceedings of the 17th ACM SIGSPA- TIAL International Conference on Advances in Geo- graphic Information Systems, Seattle, 2009, pp. 101-110. doi:10.1145/1653771.1653788 [23] B. Tversky, “Distortions in Cognitive Maps,” GeoForum, Vol. 23, No. 2, 1992, pp. 131-138. doi:10.1016/0016-7185(92)90011-R [24] P. Martinez Lerin, D. Yamamoto and N. Takahashi, “Making a Pictorial and Verbal Travel Trace from a GPS Trace,” Proceedings of the 11th International Symposium on Web and Wireless Geographical Information Systems (W2GIS 2012), Springer, 2012, pp. 98-115. doi:10.1007/978-3-642-29247-7_9 [25] N. Takahashi, “An Elastic Map System with Cognitive Map-based Operations,” In: M. P. Peterson, Ed., Interna- tional Perspectives on Maps and Internet, Lecture Notes in Geoinformation and Cartography, Springer-Verlag, Berlin, 2008, pp. 73-87. doi:10.1007/978-3-540-72029-4_5
|