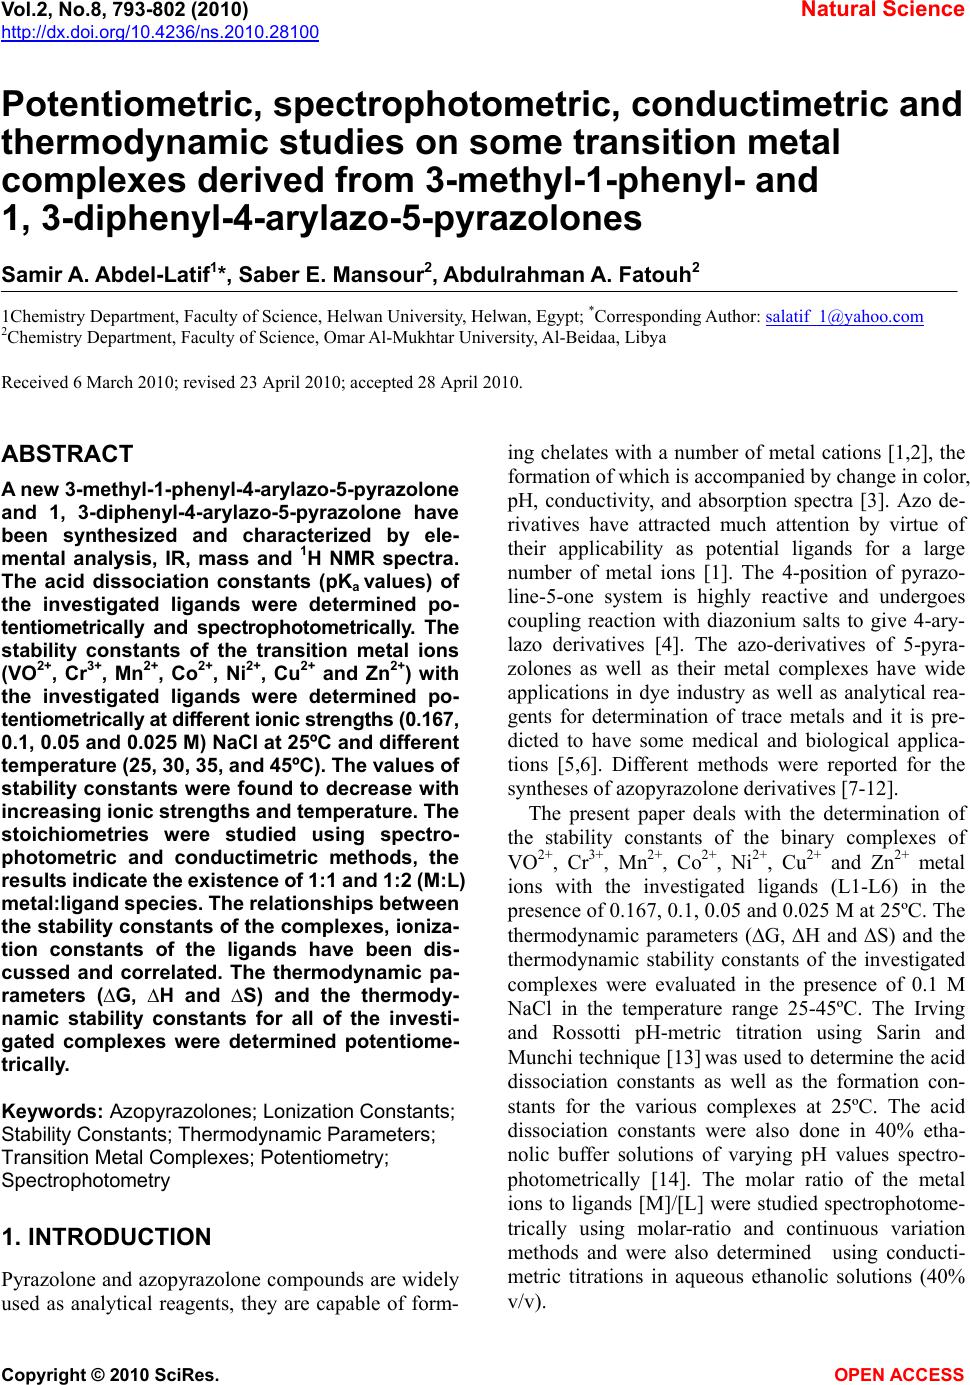
 Vol.2, No.8, 793-802 (2010) Natural Science http://dx.doi.org/10.4236/ns.2010.28100 Copyright © 2010 SciRes. OPEN ACCESS Potentiometric, spectrophotometric, conductimetric and thermodynamic studies on some transition metal complexes derived from 3-methyl-1-phenyl- and 1, 3-diphenyl-4-arylazo-5-pyrazolones Samir A. Abdel-Latif1*, Saber E. Mansour2, Abdulrahman A. Fatouh2 1Chemistry Department, Faculty of Science, Helwan University, Helwan, Egypt; *Corresponding Author: salatif_1@yahoo.com 2Chemistry Department, Faculty of Science, Omar Al-Mukhtar University, Al-Beidaa , Li by a Received 6 March 2010; revised 23 April 2010; accepted 28 April 2010. ABSTRACT A new 3-m et h yl-1-phenyl-4-arylazo-5-pyrazolone and 1, 3-diphenyl-4-arylazo-5-pyrazolone have been synthesized and characterized by ele- mental analysis, IR, mass and 1H NMR spectra. The acid dissociation constants (pKa values) of the investigated ligands were determined po- tentiometrically and spectrophotometrically. The stability constants of the transition metal ions (VO2+, Cr3+, Mn2+, Co2+, Ni2+, Cu2+ and Zn2+) with the investigated ligands were determined po- tentiometrically at different ionic strengths (0.167, 0.1, 0.05 and 0.025 M) NaCl at 25ºC and different temperature (25, 30, 35, and 45ºC). The values of stability constants were found to decrease with increasing ionic strengths and temperature. The stoichiometries were studied using spectro- photometric and conductimetric methods, the results indicate the existence of 1:1 and 1:2 (M:L) metal:ligand species. The relationships between the stability constants of the complexes, ioniza- tion constants of the ligands have been dis- cussed and correlated. The thermodynamic pa- rameters (∆G, ∆H and ∆S) and the thermody- namic stability constants for all of the investi- gated complexes were determined potentiome- trically. Keywords: Azopyrazolones; Lonization Constants; Stability Constants; Thermodynamic Parameters; Transition Metal Complexes; Potentiometry; Spectrophotometry 1. INTRODUCTION Pyrazolone and azopyrazolone compounds are widely used as analytical reagents, they are capable of form- ing chelates with a number of metal cations [1,2], the formation of which is accompanied by change in color, pH, conductivity, and absorption spectra [3]. Azo de- rivatives have attracted much attention by virtue of their applicability as potential ligands for a large number of metal ions [1]. The 4-position of pyrazo- line-5-one system is highly reactive and undergoes coupling reaction with diazonium salts to give 4-ary- lazo derivatives [4]. The azo-derivatives of 5-pyra- zolones as well as their metal complexes have wide applications in dye industry as well as analytical rea- gents for determination of trace metals and it is pre- dicted to have some medical and biological applica- tions [5,6]. Different methods were reported for the syntheses of azopyrazolone derivatives [7-12]. The present paper deals with the determination of the stability constants of the binary complexes of VO2+, Cr3+, Mn2+, Co2+, Ni2+, Cu2+ and Zn2+ metal ions with the investigated ligands (L1-L6) in the presence of 0.167, 0.1, 0.05 and 0.025 M at 25ºC. The thermodynamic parameters (∆G, ∆H and ∆S) and the thermodynamic stability constants of the investigated complexes were evaluated in the presence of 0.1 M NaCl in the temperature range 25-45ºC. The Irving and Rossotti pH-metric titration using Sarin and Munchi technique [13] was used to determine the acid dissociation constants as well as the formation con- stants for the various complexes at 25ºC. The acid dissociation constants were also done in 40% etha- nolic buffer solutions of varying pH values spectro- photometrically [14]. The molar ratio of the metal ions to ligands [M]/[L] were studied spectrophotome- trically using molar-ratio and continuous variation methods and were also determined using conducti- metric titrations in aqueous ethanolic solutions (40% v/v).  S. A. Abdel-Latif et al. / Natural Science 2 (2010) 793-802 Copyright © 2010 SciRes. OPEN ACCESS 2. EXPERIMENTAL 2.1. Materials and Methods All chemicals used in this investigation were chemically pure grade derived from BDH. They include chlorides of Cr3+, Mn2+, Co2+, Ni2+, Cu2+, Zn2+ and VOSO4 · 3H2O, sodium hydroxide (NaOH), sodium nitrite (NaNO2), hydrochloric acid (HCl), acetic acid (CH3COOH), so- dium chloride (NaCl), ethylacetoacetate, ethylbenzoyla- cetate, phenyl hydrazine, ethanol, 2-hydroxyaniline (o-aminophenol), o-aminobenzoic acid, p-aminobenzoic acid and diethyl ether; purchased from BDH. Water used was bidistilled water; distillation process was carried out using both of condensation process and ion exchange technique. 10-3 M of azopyrazolone solutions were pre- pared by dissolving a known mass of the azo compound in a proper volume of ethanol. 10-3 M solution of the metal ion in 0.1 M HCl was prepared by dissolving the appropriate weight of the corresponding metal chlorides of Cr3+, Mn2+, Co2+, Ni2+, Cu2+, Zn2+ and VOSO4·3H2O in a proper volume of 0.1 M HCl to prevent the hydroly- sis of the metal salt solutions. Pure aqueous solutions of metal ions were also prepared for conductimetric studies. 0.1 M HCl was prepared and standardized against stan- dard sodium carbonate solution, the exact concentration of the HCl solution was determined and used in calcula- tions (0.1185 M). 0.2 M (CO2-free) NaOH solution was prepared and standardized against standard HCl solution. NaCl solutions with different concentrations (1, 0.6, 0.3 and 0.15 M) were also prepared. A series of buffer solu- tions covering the range (1.5-12) of pH values were prepared according to Britton method [14] with the modification involving titration of 100 ml of the mixture (0.1 M solution of equal amounts of boric, acetic and phosphoric acids) with 0.5 M NaOH to the desired pH and then making with water up to 250 ml so as to keep the ionic strength constant at all pH values [15]. 2.2. Preparation of 3-Methyl-1-Phenyl-5- Pyrazolone and 1, 3-Diphenyl-5- Pyrazolone A mixture of ethylacetoacetate (6.5 g; 0.05 M) and phenyl hydrazine (5.4 g; 0.05 M) or ethylbenzoylacetate (9.6 g; 0.05 M) and phenyl hydrazine (5.4 g; 0.05 M) was heated in water bath at 100℃ for one hour [7]. The resulting oil was cooled and stirred with diethyl ether (50 ml) until solidification occurred, the crude product was then filtered off, washed with ether until all colored material removed. The final product was recrystallized with 20% ethanol-water solution and collected as white powder of 3-methyl-1-phenyl-5-pyrazolone, yield 90%, m.p. 131℃ or 1,3-diphenyl-5-pyrazolone, yield 90%, m.p.143℃. 2.3. Preparation of Azopyrazolone Derivatives A well-stirred solution of 2-aminophenol, 2-amino- benzoic acid or 4-aminobenzoic acid 0.01 M in 40 ml ethanol and 20 ml of 2 M HCl was cooled in an ice-salt bath and diazotized with aqueous sodium nitrite solution (20 ml, 0.01 M). The cooled (0-5°C) diazonium solution was added slowly to a well-stirred solution of 0.01 M 3-methyl-1-phenyl-5-pyrazolone or 1, 3-diphenyl-5-py- razolone in 100 ml ethanol containing sodium hydroxide (10 g). The reaction mixture was stirred for one hour at room temperature, and then acidified with dilute HCl (100 ml, 2.5 M) to neutralize the reaction mixture and precipitate the azopyrazolone derivatives [16]. The products were recrystallized from ethanol to give the derivatives of both 3-methyl-1-phenyl-4-arylazo-5-py- razolone and 1, 3-diphenyl-4-arylazo-5-pyrazolone. The resulting derivatives have the following formulae: X = C6H5, Y = COOH, Z = H; 1, 3-diphenyl-4-(o-carboxyphenylazo)-5-pyrazolone (L1), X = CH3, Y = COOH, Z = H; 3-met h y l-1-phenyl-4-(o-carboxyphenylazo)-5-pyrazolone (L2), X = C6H5, Y = OH, Z = H; 1, 3-diphenyl-4-(o-hydroxyphenylazo)-5-pyrazolone (L3), X = CH3, Y = OH, Z = H; 3-met h y l-1-phenyl-4-(o-hydroxyphenylazo)-5-pyrazolone (L4), X = C6H5, Y = H, Z = COOH; 1, 3-diphenyl-4-(p-carboxyphenylazo)-5-pyrazolone (L5), X = CH3, Y = H, Z = COOH; 3-methyl-1-phenyl-4-(p-carboxyphenylazo)-5-pyrazolone (L6). Elemental analysis, IR, mass and 1H NMR spectra were carried out to confirm their structures. 2.4. pH-Metric Titration The experimental procedure involved the titration of the following solutions (total volume = 50 ml) against a standard CO2-free (0.21 M) NaOH solution: 1) 5 ml of HCl (0.12 M) + 5 ml of NaCl (1 M) + 20 M ethanol, 2) Solution a + 20 ml of 10-3 M of the ligand under investigation, and,  S. A. Abdel-Latif et al. / Natural Science 2 (2010) 793-802 Copyright © 2010 SciRes. OPEN ACCESS 3) Solution b + 5 ml of metal salt solution (10-3 M). These titrations were repeated for 1) ionic strengths I = 0.167, 0.1, 0.05, and 0.25 M NaCl, at 25ºC, 2) various temperatures (25, 30, 35, and 45ºC) at I = 0.167 M NaCl. The pH measurements were carried out using a Jen- way, pH-meter 3310 with a glass combined electrode. The water thermostat was a Thermo Haake WKL 26, Karlsruhe, Germany accurate to ±0.1ºC. The solutions were equilibrated in the thermostat for about 15 min before titration. The equations used for the various cal- culations [17] were programmed into IBM computer. 2.5. Determination of the Thermodynamic Parameters The following thermodynamic parameters: ∆G°, ∆H° and ∆S° were determined for each chelate depending on their stability constants [18]. The free energy of formation (∆G°) of a complex is related to its stability constant by the relation [18]: –∆G° = 2.303 RT logβ where, R = uni- versal gas constant, T = absolute temperature and logβ = stability constant of the complex. Enthalpy of formation (∆H°) and entropy (∆S°) were calculated by plotting logβ versus 1/T. We can specify the quantitative dependence of the stability constant on temperature from the relation [18]: ∆G° = ∆H° – T∆S° ∆G° = –2.303 RT logβ = ∆H° – T∆S° By rearranging, we get logβ = –∆H°/(2.303 RT) + ∆S°/(2.303 R) This is a linear equation of the form y = mx + b, where y = logβ, m = –∆H°/(2.303 R) = slope, x = 1/T, and b = ∆S°/(2.303 R) = intercept. This means that if the values of K for a given reaction are determined at vari- ous temperature, a plot of logβ versus 1/T will be linear, with slope ∆H°/(2.303 R) and intercept ∆S°/(2.303 R). This result assumes that both ∆H° and ∆S° are indepen- dent of temperature over the temperature range consi- dered. This assumption is a good approximation over a relatively small temperature range [18]. 2.6. Conductimetric Measurements The conductivities of VO2+, Cr3+, Mn2+, Co2+, Ni2+, Cu2+ and Ni2+ metal ions with the investigated ligands (L1-L6) were measured using conductivity meter (Philips pw 9526, digital conductivity meter). The experimental procedure involves a conductimetric titration of 40 ml alcohol-water mixture (50% v/v) solution containing 4 × 10⁻⁵ M of a given azopyrazolone derivative against a standard solution of 10-3 M aqueous metal ion solution using microburette with continuous magnetic stirring. The instrument reading was recorded after each addition. All of the conductivity values were corrected for the effect of dilution during titration. Corrections were made by multiplying conductivity value (instrument reading) by the ratio (V + v)/V, where V is the original volume of the titrand (40 ml and v is the added volume of titrant [19]). The corrected conductivity values were plotted versus the molar ratio (L:M). The resulting curves are composed of straight lines with inflection points indi- cating the number of ligands around each central metal ion. 2.7. Spectrophotometric Method Applied for Determination of PKa Values The absorption spectra of azopyrazolone compounds under investigation (L1-L6) were scanned over a range of wavelengths in universal buffer solutions of different pH values. For this purpose a known volume of (10-3 M) solution of the azopyrazolone derivative was added to the buffer solution in a 10 ml volumetric flask dropwise with continuous shaking. The mixture was then made up to the mark with the buffer solution of appropriate pH. The spectra were obtained at room temperature using spectrophotometer (Jenway, 6305 UV-VIS spectropho- tometer). The method applied for the determination of pKa val- ues of the different azopyrazolone derivatives is the half height method [20]. This method depends on the fact that the limiting absorbance (A1) represents complete con- version of the compound from one form to other. Since pKa is equal to the pH value at which the two forms exist in equivalent amounts (pKa = pH (at A½), the pH corresponding to half the height of the absorbance-pH curve (A½) is equal to pKa. The (A½) value is given by the relation: where A1 = maximum absorbance, Amin = minimum ab- sorption. The absorption spectra of 3 × 10⁻⁵ M solutions of the azopyrazolones under investigation (ligands L1-L6) were dissolved in 40% v/v ethanolic buffer solutions of varying pH values. 2.8. Determination of the Molar Ratio of the Metal Lons to the Ligands Spectrophotometrically The mole ratio of the metal ions to the ligands was stu- died spectrophotometrically using molar ratio and con- tinuous variation methods. The spectrophotometric me- thod was used to confirm the data obtained by conduc- timetric and pH-metric methods. UV absorption can be used to determine stoichiometry of the complexes and this method appears to be valuable for studying com- plexes with low stabilities.  S. A. Abdel-Latif et al. / Natural Science 2 (2010) 793-802 Copyright © 2010 SciRes. OPEN ACCESS 2.8.1. Molar Ratio Method In this investigation, the concentration of the metal ions were maintained constant and the ligands concentrations were varied [21], so a series of metal-ligand aqueous ethanolic solutions were prepared with different [L]/[M] ratios. The absorptions of these solutions were measured using UV spectrophotometer at λmax of the expected complex ML2. Absorbance versus [L]/[M] curves were drawn for all complexes. 2.8.2. Continuous Variation Method This method was used to confirm the data obtained using molar ratio and conductivity methods. In this method, the mole fraction was varied by changing the concentra- tions of the two components, maintaining the total num- ber of moles constant [21]. A series of metal-ligand aqueous ethanolic solutions were prepared with different metal mole fractions. The mole fraction of the metal was plotted against the absorbance of the expected complex at λmax of the complex. The measured absorbance in- crease as the molar ratio [M]/([L] + [M]) increase until the actual molar ratio of the complex is reached, after this point the absorbance becomes lower because the metal has no absorption at λmax of the complex. 3. RESULTS AND DISCUSSION 3.1. Determination of Stability Constants Titration curves were obtained for the titrations of VO2+, Cr3+, Mn2+, Co2+, Ni2+, Cu2+ and Zn2+ metal ions in the presence of different molarities of NaCl and different temperatures. The stability constants of the formed com- plexes were investigated in the pH range of 4-6. The mean values of (the average number of pro- tons associated with the ligand) for the investigated li- gands (L1-L6) at different pH values were calculated from the titration curves of solutions 1 and 2 by em- ploying the relationship derived by Irving and Rossotti [17]. On plotting log/(1 – ) vs. pH, a straight lines having an intercept equal to pKa on the pH axis are ob- tained. From the titration curves of solutions 1-3, the metal + ligand formation number values � (the average number of ligand molecules coordinated to the metal ion) of the metal complexes were obtained at various pH values. The � values were found to be less or equal to 2, indicating the formation of 1:1 and 1:2 complexes. The � values were calculated using the Irving and Rossotti formulation [17]. The free ligand exponent pL was cal- culated from the so obtained values of � by the equa- tion: 1 0 1 10 log = = + =− ∑ yH yB y c LM VV V C n pL C ο ο β where, CM is the concentration of ions Mn+ used, CL is the concentration of the ligand, y is the number of disso- ciable protons ( y = 1 for the investigated ligands), and Vo is the original volume (50 ml), Vc is the volume of alkali (NaOH) consumed to reach the same pH values in curve c corresponding to the titration of solution 3, is the formation constant values of the investigated ligands, and B is the pH value. The mean pKa values obtained from the corresponding different experimental formation curves using the average value and straight line methods. The results obtained for proton-ligand systems (pKa values) were 3.98, 4.04, 7.68, 7.93, 3.45 and 3.66 for the investigated ligands L1-L6, respectively. Referring to these data, the pKa values of ligands L5 and L6 have the lowest values from all of the six ligands used in this work because the ionizble group (–COOH) locates in the para position where there is no attraction with the car- bonyl group of the pyrazolone ring, so it is easy to lose H+ ion, whereas the ligands L1 and L2 have pKa values higher than L5 and L6 because the ionizable group (–COOH) locates in ortho position, so there is a hydro- gen bond between the carbonyl group of the pyrazolone ring and –COOH, as a result; it is more difficult to lose H+, so these two ligands have pKa values higher than L5 and L6 [22]. The pKa values of ligands L3 and L4 have the highest values from all because the ionizable group of these two ligands (–OH) locates in ortho position with lower ability to librate H+ ion because hydroxyl group has lower acidity than carboxyl group and because of the presence of hydrogen with the carbonyl group of the pyrazolone ring [23]. Ligand L1 has pKa value < L2, and L3 < L4, and L5 < L6, that is because of the presence of additional phenyl group (electron withdrawing group) in ligands L1, L3 and L5. The formation curves for the complexes were obtained by plotting the relation be- tween average number of ligands attached per metal ion (�) and free ligand exponent (pL), � and pL were calcu- lated as previously mentioned. To compute successive stability constants (logβ1 and logβ2) the method of in- terpolation is used [17], where logβ1 and logβ2 are equal to the values of (pL) when (�) = 0.5 and 1.5, respectively. logβ1 and logβ2 for all complexes are given in Table 1. 3.2. Relations between the Properties of Central Metal Lons and the Stability Constants of the Complexes The transition metal ions form predominantly ionic and coordinate bonds. If the bonds are ionic, the born rela-  S. A. Abdel-Latif et al. / Natural Science 2 (2010) 793-802 Copyright © 2010 SciRes. OPEN ACCESS Table 1. Collective data of stability constants (logβ1 and logβ2) for all of the investigated complexes. Zn Cu Ni Co Mn Cr VO Ligand logβ2 logβ1 logβ2 logβ1 logβ2 logβ1 logβ2 logβ1 logβ2 logβ1 logβ2 logβ1 logβ2 logβ1 6.23 4.02 6.60 4.21 6.38 4.08 6.18 3.99 5.29 3.53 6.04 3.92 5.83 3.78 L1 7.25 4.82 7.41 4.87 7.53 4.83 8.04 4.90 7.52 4.71 7.31 4.78 7.70 4.72 L2 9.87 5.73 9.94 5.76 10.07 5.75 10.06 5.67 8.81 5.43 9.93 5.65 9.54 5.63 L3 10.19 5.84 10.47 5.94 10.14 5.90 9.91 5.80 9.50 5.63 10.15 5.79 9.76 5.77 L4 6.66 3.78 5.68 3.83 6.71 3.83 5.85 3.75 5.34 3.25 5.68 3.60 4.29 3.26 L5 8.37 4.46 8.01 4.58 8.55 4.52 8.05 4.37 6.78 4.25 6.78 4.33 6.34 4.26 L6 tion (E = Z2/2r [1 – 1/D]) [24] can be hold for the energy change on complexation of an ion of charge (Z) and ra- dius (r) [25-27] in a medium of dielectric constant (D). Since the stability constant is related directly to this energy, logβ values should increase linearly with Z2/r. The stability constants of some transition metal com- plexes show different behaviors which suggest the probable existence of linearity and nonlinearity of logβ with Z2/r [28]. The plots of logβ1 and logβ2 versus Z2/r of the transition metal ions (VO2+, Cr3+, Mn2+, Co2+, Ni2+, Cu2+ and Zn2+) complexes with the investigated ligands (L1-L6), does not exhibit linear increase of logβ with increase of Z2/r. Interpretation in term of the assumption about ionic character of metal-ligand on which the li- nearity based is not valid. The other probable case is steric effects. It is also interest to study the logβ1 and logβ2 values of the transition metal complexes with the investigated ligands (L1-L6) as a function of atomic number 1/r (the inverse of ionic radius) as well as EN (electronegativity) [28] of metal ions. In this investiga- tion, it was found that the stability constants of the first raw transition metal complexes with the investigated ligands (L1-L6) (logβ values) are generally increase with decreasing ionic radius r (or increasing 1/r) and increase with increasing atomic number [29], also logβ increases with increasing electonegativity, this is because upon increasing electronegativity of the metal ions, the elec- tronegativity difference between the metal atom and the donor atom of the ligand would expectedly associate with increase of covalent character of the metal-ligand bond. These relations are not linear and there are some exceptions from the mentioned observations because of the presence of steric effects and ionic bonds. The rela- tions between the ionization constants (pKa) of the li- gands and the stability constants (logβ1, logβ2) of their complexes with the transition metal ions (VO2+, Cr3+, Mn2+, Co2+, Ni2+, Cu2+ and Zn2+) can be studied. It is observed that as pKa of the ligand increases, the stability constant logβ of the complex increase. The semi linear correlation observed in this study demonstrates that fac- tors which increase or decrease pKa of the ligand also affect the logKML values for the metal ions in a parallel fashion. This means that substituent groups that tend to increase electron density on donor atom and hence tend to increase the coordination ability of the ligand increase logKML, and also increase the value of pKa of the ioniza- ble hydrogen [29]. The assumption here is that ligand basicity is directly related to ligand stability i.e., more stable complexes being formed from basic ligands [29]. Such correlation cannot be generalized because of the presence of some exceptions from linearity and because this result was observed form the ligands and the metal ions used in this study only. 3.3. Effect of Lonic Strength on Stability Constants The stability constants of the metal ions (VO2+, Cr3+, Mn2+, Co2+, Ni2+, Cu2+ and Zn2+) complexes with the investigated ligands (L1-L6) were found to decrease with increasing ionic strength of the medium as shown in Table 2. For each complex the relationship between the stability constant and the square root of the ionic strength is plotted in Figures 1, 2 and was in agreement with the Debye-Hűckel equation [30]. The thermody- namic stability constants (logβ°) were obtained by extrapolating the straight line plots of logβ versus √I to zero ionic strength. From the plots of logβ versus √I which illustrated in Figures 1 and 2, the logβ° (thermo- dynamic stability constants) values were obtained and listed in Table 3. Also values of pKa were found to de- crease with increasing ionic strength of the medium which are in agreement with Debye-Hűckel equation [30,31]. The equation ∆G = –2.303 RT logβ gives the relationship between the thermodynamic stability con-  S. A. Abdel-Latif et al. / Natural Science 2 (2010) 793-802 Copyright © 2010 SciRes. OPEN ACCESS Table 2. Stability constants of VO2+, Cr3+, Mn2+, Co2+, Ni2+, Cu2+ and Zn2+ complexes with the investigated ligands L1-L6 at different ionic strengths at room temperature. I (mol/l NaCl) Complex L1- 7.67 7.30 6.72 6.23 Ni 8.03 7.59 7.27 6.60 Cu 8.29 7.98 7.65 7.31 Cr 8.69 8.35 7.95 7.52 Mn 8.07 7.90 7.50 7.25 Zn L3- 10.85 10.45 9.96 9.54 VO 11.52 11.10 10.60 10.07 Ni2+ 11.03 10.70 10.25 9.94 Cu 11.33 11.00 10.50 10.15 Cr3+ 10.82 10.48 10.00 9.50 Mn 11.20 10.89 10.45 10.14 Ni L5- 5.71 5.20 4.70 4.29 VO2+ 6.81 6.60 6.05 5.68 Cr 8.12 7.60 7.25 6.70 Cu L6-  S. A. Abdel-Latif et al. / Natural Science 2 (2010) 793-802 Copyright © 2010 SciRes. OPEN ACCESS Table 3. The Thermodynamic stability constants (logβ°) of VO2+, Cr3+, Mn2+, Co2+, Ni2+, Cu2+ and Zn2+ complexes with the investigated ligands (L1–L6). Figure 1. Plots of logβ versus √I for L1 with the investi- gated metal ion complexes. Figure 2. Plots of logβ versus for L2 with the inves- tigated metal ion complexes. stant and the free energy change according to the com- plex formation. 3.4. Effect of Temperature on Stability Constants From the pKa and logβ values and their temperature de- pendence, the values of the thermodynamic functions ∆G, ∆H and ∆S were calculated [32]. The values of sta- bility constants in Table 4 reveal that the stability con- stants decrease with increasing temperature, along with the pKa value (Figures 3, 4). 3.5. Conductimetric Measurements The calculated molar ratio [L]/[M] were plotted against the corrected molar conductance values. The results in- dicated that the conductance increases with the addition of the metal ion solutions due to the release of the highly conducting hydrogen ions as a result of chelation. In- Figure 3. Plots of logβ versus 1/T for L1 with the inves- tigated metal ion complexes. Figure 4. Plots of logβ versus 1/T for L2 with investigated metal ion complexes. Zn2+ Cu2+ Ni2+ Co2+ Mn2+ Cr3+ VO2+ Metal ion 10.58 9.74 10.66 10.4 7.88 8.72 8.13 L6  S. A. Abdel-Latif et al. / Natural Science 2 (2010) 793-802 Copyright © 2010 SciRes. OPEN ACCESS Table 4. The thermodynamic parameters (△H°, △G° and △S°) for VO2+, Cr3+, Mn2+, Co2+, Ni2+, Cu2+ and Zn2+ complexes with the investigated ligands (L1-L6). 2+ 2+ 2+ 2+ 2+ 3+ 2+ 35.224 37.29 36.047 34.974 29.899 34.318 32.984 –△G°(kJ/mol) L1 26.23 35.04 46.34 37.92 32.94 37.53 36.77 -△H°(kJ/mol) 0.03 0.007 –0.035 –0.011 –0.011 –0.013 –0.013 +△S°(kJ/mol. K) 40.63 41.47 42.184 44.995 42.157 40.966 43.122 –△G°(kJ/mol ) L2 34.47 36.96 38.49 27.19 31.79 36.19 29.87 –△H°(kJ/mol ) 0.022 0.016 0.013 0.062 0.036 0.017 0.046 +△S°(kJ/mol. K) 55.955 56.371 57.147 57.071 49.963 56.314 54.194 –△G°(kJ/mol ) L3 42.89 40.98 33.32 36.96 39.64 34.47 35.85 –△H°(kJ/mol ) 0.043 0.051 0.08 0.067 0.034 0.073 0.064 S°(kJ/mol. K) 58.179 59.878 57.932 56.561 54.258 58.001 55.724 –△G°(kJ/mol ) L4 33.70 40.98 38.49 36.77 35.24 27.77 31.41 –△H°(kJ/mol ) 0.081 0.061 0.063 0.065 0.062 0.1 0.08 +△S°(kJ/mol. K) 38.012 38.292 38.284 33.4 30.499 32.473 24.518 –△G°(kJ /mol) L5 32.94 29.68 55.53 41.94 28.34 36.19 20.68 –△H°(kJ /mol) 0.016 0.027 -0.06 –0.031 0.006 -0.014 0.012 +△S°(kJ /mol. K) 47.307 45.288 48.357 45.514 35.438 38.307 35.87 –△G°(kJ/mol ) L6 35.42 32.17 36.19 24.13 39.26 34.09 34.85 –△H°(kJ/mol ) 0.04 0.044 0.041 0.072 -0.013 0.014 0.003 +△S°(kJ/mol. K) spection of the titration curves shows the presence of two distinctive breaks at metal to ligand molar rations of 1:1 and 1:2, respectively. 3.6. Spectrophotometric Determination of the pKa Values of the Investigated Ligands The absorption spectra were recorded to investigate the spectral properties of the species liable to exist in such media and to determine the ionization constant (pKa) values of the acidic groups present. Britton-Robinson universal buffers [14] were used to control the pH over the range 1.5-12.0. The maximum absorption of the li- gand increases as pH of the buffer increase. The spectra in acidic solutions of pH 1.5-6.0 are characterized by a strong band absorbing maximally within the wavelength range 370-400 nm. These bands are due to absorption of the nonionized form liable to exist in such solutions and may be assigned to π-π* electronic transition within the ligand molecule influenced by intramolecular charge transfer. The spectra in alkaline solutions are characte- rized by the presence of a strong band absorbing max- imally at the same range, which may be assigned to the absorption of the ionized form liable to exist at high pH values as a result of acid base equilibrium. It is noted in this investigation that the absorption bands assigned to the ionized form increases gradually by increasing of pH, attaining the maximum value at pH 10-12.0. The absor- bance-pH curves show that the absorbance attains a li- miting value at the extreme pH values in highly acidic or alkaline solutions indicating the existence of only one ionization step which is the ionization of -OH or -COOH groups. The variation of absorbance with pH is used for the calculation of ionization constants (pKa values) of  S. A. Abdel-Latif et al. / Natural Science 2 (2010) 793-802 Copyright © 2010 SciRes. OPEN ACCESS the investigated ligands using the half height method [20]. The results obtained are of the same order com- pared to those obtained potentiometrically and are 3.98, 4.08, 7.67, 7.98, 3.40 and 3.64 for the investigated li- gands (L1-L6), respectively. The ionization of strong acidic carboxylic group is ionized at lower pH value, due to the high stability of the corresponding anion by re- sonance. They do not impart any spectral changes as the ionizable proton is not conjugated with the π-system of the molecule. 3.7. Determination of the Stoichiometry of the Complexes Spectrophotometrically The mole ratio of the metal ions to the ligands was stu- died spectrophotometrically using molar ratio and con- tinuous variation methods. The spectrophotometric me- thod was used to confirm the data obtained by conduc- timetric method. UV absorption spectra can be used to determine stoichiometry of the complexes, and this me- thod appears to be valuable for studying complexes with low stabilities. 3.7.1. Molar Ratio Method It was observed that the absorption increases linearly as the ligand concentration increase, because of the forma- tion of the complex until the solution reaches the actual molar ratio of the investigated complex. At this point all of the added materials were completely reacted and the absorption observed is the absorption of the investigated complex alone. After this point, the excess amount of the added ligand causes an inflection in the straight line that is because the ligand has an absorption value differ from that of the complex at λmax of the complex [21]. [L]/[M] ratio corresponding to the inflection point in (Abs- [L]/[M] curve) indicates to the actual [L]/[M] ratio of the investigated complex. It was found that all of the com- plexes in this investigation are able to be stable in the form ML2. 3.7.2. Continuous Variation Method This method was used to confirm the data obtained using molar ratio and conductivity methods. In this method, The measured absorbance increases as the molar ratio [M]/([L] + [M] ) increase until the actual molar ratio of the complex is reached, after this point the absorbance becomes lower because the metal has no absorption at λmax of the complex. It was found that all of the curves have inflection points at mole fraction around (0.33); this means that all of the complexes in this investigation have the form ML2 and this form is the most stable form. 4. CONCLUSIONS The results obtained from the potentiometric measure- ments for proton-ligand systems (pKa values) were 3.98, 4.04, 7.68, 7.93, 3.45 and 3.66 for the investigated li- gands L1-L6, respectively. It is observed that as pKa of the ligand increases, the stability constant logβ of the complex increase. The stability constants of the metal ions (VO2+, Cr3+, Mn2+, Co2+, Ni2+, Cu2+ and Zn2+) com- plexes with the investigated ligands (L1-L6) were found to decrease with increasing ionic strength of the medium which was in agreement with the Debye-Hűckel equa- tion. The thermodynamic stability constants (logβ°) were obtained by extrapolating the straight line plots of logβ versus √I to zero ionic strength. Also the values of pKa were found to decrease with increasing ionic strength of the medium. The values of the thermodynamic functions ∆G, ∆H and ∆S were calculated. The values of stability constants reveal that the stability constants decrease with increasing temperature, along with the pKa value. Con- ductimetric measurements show the presence of two distinctive breaks at metal to ligand molar rations of 1:1 and 1:2, respectively. The results obtained from the spectrophotometric measurements are of the same order compared to those obtained potentiometrically and are 3.98, 4.08, 7.67, 7.98, 3.40 and 3.64 for the investigated ligands (L1-L6), respectively. The ionization of strong acidic carboxylic group is ionized at lower pH value due to the high stability of the corresponding anion by re- sonance. They do not impart any spectral changes as the ionizable proton is not conjugated with the π-system. The mole ratio of the metal ions to the ligands was stu- died spectrophotometrically using molar ratio and con- tinuous variation methods. All the investigated com- plexes are found to be stable in the form ML2, which is also the most stable one. REFERENCES [1] Wisniewski, M.Z. (1997) Pd(II) complexes with some derivatives of pyrazol-5-one. Polish Journal of Chemi- stry, 71(2), 259-260. [2] Lu, J., Zhang, L., Li u, L., Liu, G., Jia, D., Wu, D. and Xu, G. (2008) Study of fluorescence properties of several 4-acyl pyrazolone derivatives and their Zn(II) complexes. Spectrochimica Acta Part A, 71(3), 1036-1041. [3] Kuncheria, B. and Indrasenan, P. (1988) Thorium (IV) nitrate complexes with some substituted pyrazole-5-ones. Indian Journal of Chemistry, 27A, 1005-1007. [4] Vogel, I. (1978) A text book of practical organic chemi- stry. 4th Edition, Longman, London. [5] Tantawy, F., Goda, F. and Abdelal, A.M. (1995) Synthesis and characterization of certain new 3-m et hy l-4 - (subs- tituted phenylazo) isoxazol-5-ones and 3-methy l-4- (substituted phenylazo)-pyra zol e-5-ones as potential an- tibacterial agents. The Chinese Pharmaceutical Journal, 47(1), 37-45.  S. A. Abdel-Latif et al. / Natural Science 2 (2010) 793-802 Copyright © 2010 SciRes. OPEN ACCESS [6] Rao, S. and Mittra, A.S. (1978) Synthesis and fungitoxic- ity of 1-pheny l -3-methyl-4-mono arylidene-2-pyrazolin- 5-thione. Journal of the Indian Chemical Society, 55(7), 745-746. [7] Fitton, A.O. and Smalley, R.K. (1968) Practical hetero- cyclic chemistry. Academic Press, London and New York. [8] Karci, F. and Ertan, N. (2002) Hetarylazo disperse dyes derived from 3-methy l-1-(3′, 5′-dipiperidino-s-triazinyl)- 5-pyrazolone as coupling component. Dyes and Pigments, 55(2-3), 99-108. [9] Ibrahim, S.A., El-Gahami, M.A., Khafagi, Z. A. and El-G yar, S.A. (1991) Structure and antimicrobial activity of some new azopyrazolone chelates of Ni(II) and Cu(II) acetates, sulfates and nitrates. Journal of Inorganic Bio- chemistry, 43(1), 1-7. [10] Abdel-Latif, S.A. (2001) Synthesis and characterization of some 3-phenyl-4-arylazo-5-pyrazolones with La(III), Ce(III), Th(IV) and UO2(VI) complexes. Synthesis and Reactivity in Inorganic, Metal-O rganic and Chemistry, 31(8), 1355-1374. [11] Abdel-Latif, S.A. and Hassib, H.B. (2002) Studies of Mn(II), Co(II), Ni(II) and Cu(II) Chelates with 3- Phenyl-4-(p-methoxyphenylazo)-5-pyrazolone . Journal of Thermal Analysis and Calorimetry, 68(3), 983-995. [12] Hassib, H.B. and Abdel-Latif, S.A. (2003) Potentiometric, spectrometric thermal and conductimetric studies on some 3-phenyl -4-(arylazo)-5-pyrazolones and their com- plexes with divalent cobalt metal ion. Spectrochimica Acta Part A, 59(11), 2425-2434. [13] Sarin, R. and Munshi, K.N. (1972) Thermodynamics of complex formation of indium metal ion with mercapto hydroxyl and amino substituted succinic acid. Journal of Inorganic and Nuclear Chem istry, 34(2), 581-590. [14] Britton, H.T.S. (1952) Hydrogen ions. 2nd Edition, Chapman and Hall, London. [15] West, T.S. (1969) Complexemetry with EDTA and re- lated reagents. 3rd Edition, B. D. H. Chemical Ltd Poole, London. [16] Vogel, I. (1956) Practical organic chemistry including quantitative organic analysis. 3rd Edition, Longmans, London. [17] Irving, H. and Rossotti, H.S. (1953) Methods for compu- ting successive stability constants from experimental formation curves. Journal of Chemical Society, 3397- 3405. [18] Zumdal, S.S. (1997) Chemistry. 4th Edition, Houghton Mifflin Company. [19] Vogel, A.I. (1956) Practical organic chemistry including quantitative organic analysis. 3rd Edition, Longmans, London. [20] Issa, Y. M., Abdel -Ghani, N.T. and Abdel-Lati f, S.A. (1996) Spectrophotometric studies on some hydroxy ni- trocoumarins. Egyptian Journal of Chemistry, 39(3), 235-248. [21] Bauer, H.H., Christian, G.D. and O’Reilly, J.E. (1978) Instrumental analysi s. Allyn and Bacon Inc. [22] McMurry, J. (2000) Organic chemistry. 5th Edition, Brooks/Cole, USA. [23] Schwarzenbach, G. and Flaschk, H. (1969) Complex- ometric titrations. Methuen and Co. Ltd., London. [24] Moeller, T., Martin, D.F., Thompson, L.C., Ferrus, R., Feistel, G.R. and Randal, W.J. (1965) The coordination chemistry of yttrium and the rare earth metal ions. Chemical Reviews, 65(1), 1-50. [25] Gutmann, K. (1966) Conductimetric titration of charge transfer complexes in solution. Electrochimica Acta, 11(6), 555-568. [26] Singh, P. and Ojha, A.C. (1980) Synthesis of N-isoni- ctinyl-3-methyl -4-(substituted-hydrazono)-2-py razolin-5- one. Journal of the Indian Chemical Socie ty, 57(12), 1172-1173. [27] Snavely, F. A. and Krecker, B. D. (1959) Metal derivatives of arylazopyrazolone dyes III, molarity quotients of para- and meta-substituted pyrazolone dyes. Journal of the American Chemical Soc iety, 81(16), 4199-4200. [28] Willia m, W.P. (1993) Inorganic chemistry. 2nd Edition, Academic Press Inc. [29] Manku, G.S., Gupta, R.D., Bhat, A.N. and Jain, B.D. (1968) Determination of the stability constants of some lanthanon complexes with 1-nitroso-2-naphthol, 2-ni- troso-1-naphthol, and 3-nitroso-4-hydroxycoumarin. Jour- nal of the Less Common Metals, 16(4), 343-350. [30] Debye, P. and Hückel, E. (1923) Physik. Z., 24, 185-206. [31] Saxena, R.S. and Gupta, A. (1984) Potentiometric deter- mination of dissociation constants of dithiodipropionic acid in different media. Journal of the Electrochemical Society India, 33(1), 89-90. [32] Yadav, S.S. and Saxena, R.S. (2009) Formation constants and thermodynamic parameters of some tri-ligand com- plexes of lanthanides. Journal of the Indian Chemical Society, 86(2), 168-170.
|