Paper Menu >>
Journal Menu >>
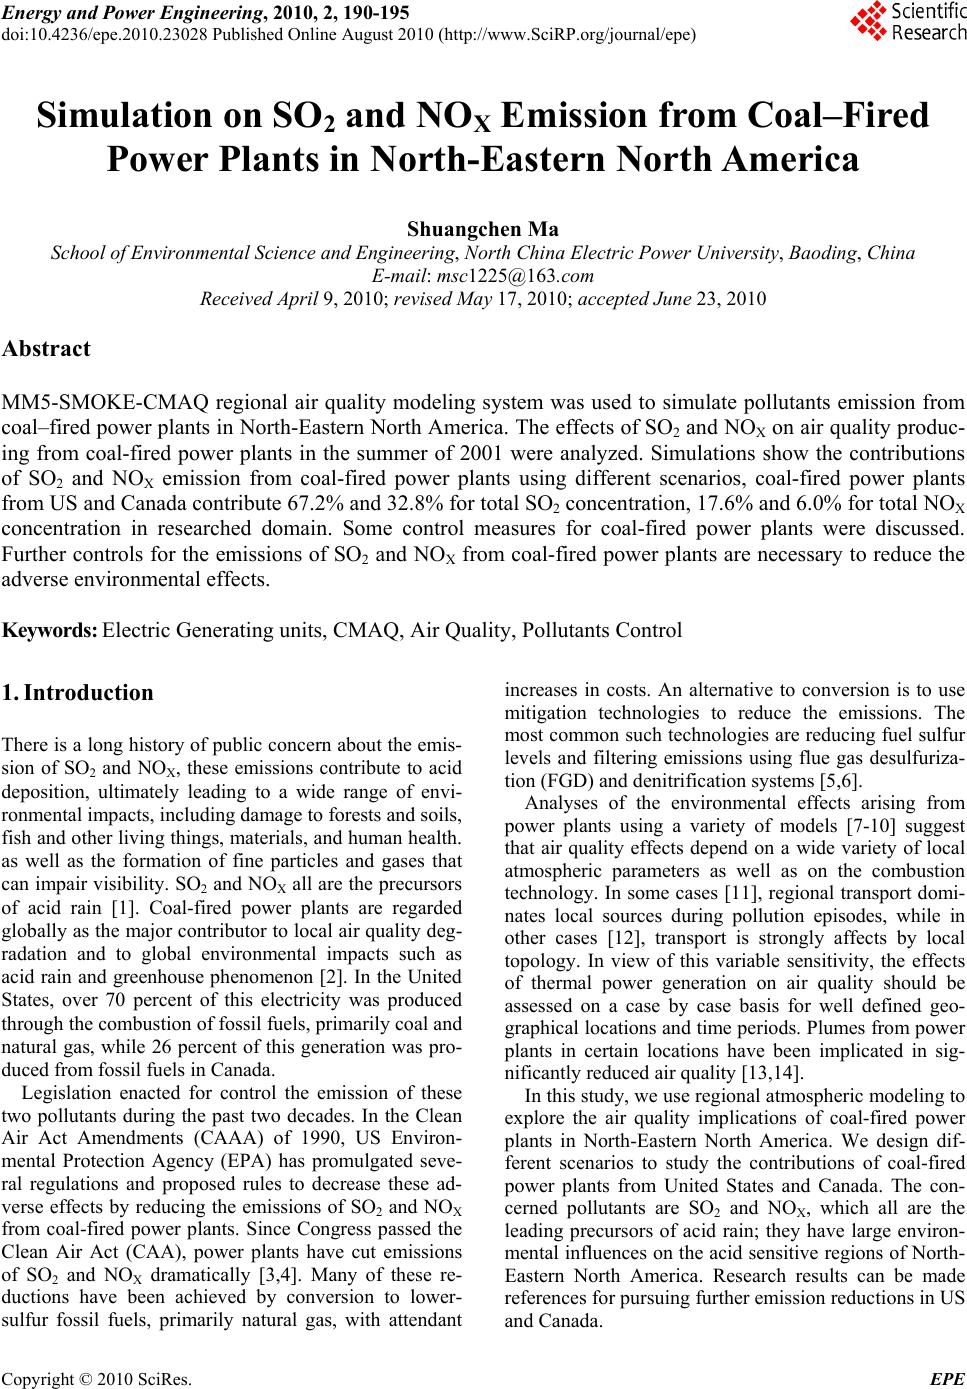 Energy and Power En gineering, 2010, 2, 190-195 doi:10.4236/epe.2010.23028 Published Online August 2010 (http://www.SciRP.org/journal/epe) Copyright © 2010 SciRes. EPE Simulation on SO2 and NOX Emission from Coal–Fired Power Plants in North-Eastern North America Shuangchen Ma School of Environme nt al Sci ence and Engineering , North China Electric Power University , Baoding, China E-mail: msc1225@163.com Received April 9, 2010; revised May 17, 2010; accepted June 23, 2010 Abstract MM5-SMOKE-CMAQ regional air quality modeling system was used to simulate pollutants emission from coal–fired power plants in North-Eastern North America. The effects of SO2 and NOX on air quality produc- ing from coal-fired power plants in the summer of 2001 were analyzed. Simulations show the contributions of SO2 and NOX emission from coal-fired power plants using different scenarios, coal-fired power plants from US and Canada contribute 67.2% and 32.8% for total SO2 concentration, 17.6% and 6.0% for total NOX concentration in researched domain. Some control measures for coal-fired power plants were discussed. Further controls for the emissions of SO2 and NOX from coal-fired power plants are necessary to reduce the adverse environmental effects. Keywords: Electric Generating units, CMAQ, Air Quality, Pollutants Control 1. Introduction There is a long history of public concern about the emis- sion of SO2 and NOX, these emissions contribute to acid deposition, ultimately leading to a wide range of envi- ronmental impacts, including damage to forests and soils, fish and other living things, materials, and human health. as well as the formation of fine particles and gases that can impair visibility. SO2 and NOX all are the precursors of acid rain [1]. Coal-fired power plants are regarded globally as the major con tributor to local air quality deg- radation and to global environmental impacts such as acid rain and greenhouse phenomenon [2]. In the United States, over 70 percent of this electricity was produced through the combustion of fossil fuels, primarily coal and natural gas, while 26 percent of this generation was pro- duced from fossil fuels in Canada. Legislation enacted for control the emission of these two pollutants during the past two decades. In the Clean Air Act Amendments (CAAA) of 1990, US Environ- mental Protection Agency (EPA) has promulgated seve- ral regulations and proposed rules to decrease these ad- verse effects by reducing the emissions of SO2 and NOX from coal-fired power plants. Since Congress passed the Clean Air Act (CAA), power plants have cut emissions of SO2 and NOX dramatically [3,4]. Many of these re- ductions have been achieved by conversion to lower- sulfur fossil fuels, primarily natural gas, with attendant increases in costs. An alternative to conversion is to use mitigation technologies to reduce the emissions. The most common such technologies are reducing fuel sulfur levels and filtering emissions using flue gas desulfuriza- tion (FGD) and denitrification systems [5,6]. Analyses of the environmental effects arising from power plants using a variety of models [7-10] suggest that air quality effects depend on a wide variety of local atmospheric parameters as well as on the combustion technology. In some cases [11], regional transport domi- nates local sources during pollution episodes, while in other cases [12], transport is strongly affects by local topology. In view of this variable sensitivity, the effects of thermal power generation on air quality should be assessed on a case by case basis for well defined geo- graphical locations and time periods. Plumes from power plants in certain locations have been implicated in sig- nificantly reduced air quality [13,14]. In this study, we use regional atmospheric modeling to explore the air quality implications of coal-fired power plants in North-Eastern North America. We design dif- ferent scenarios to study the contributions of coal-fired power plants from United States and Canada. The con- cerned pollutants are SO2 and NOX, which all are the leading precursors of acid rain; they have large environ- mental influences on the acid sensitive region s of North- Eastern North America. Research results can be made references for pursuing further emission reductions in US and Canada. 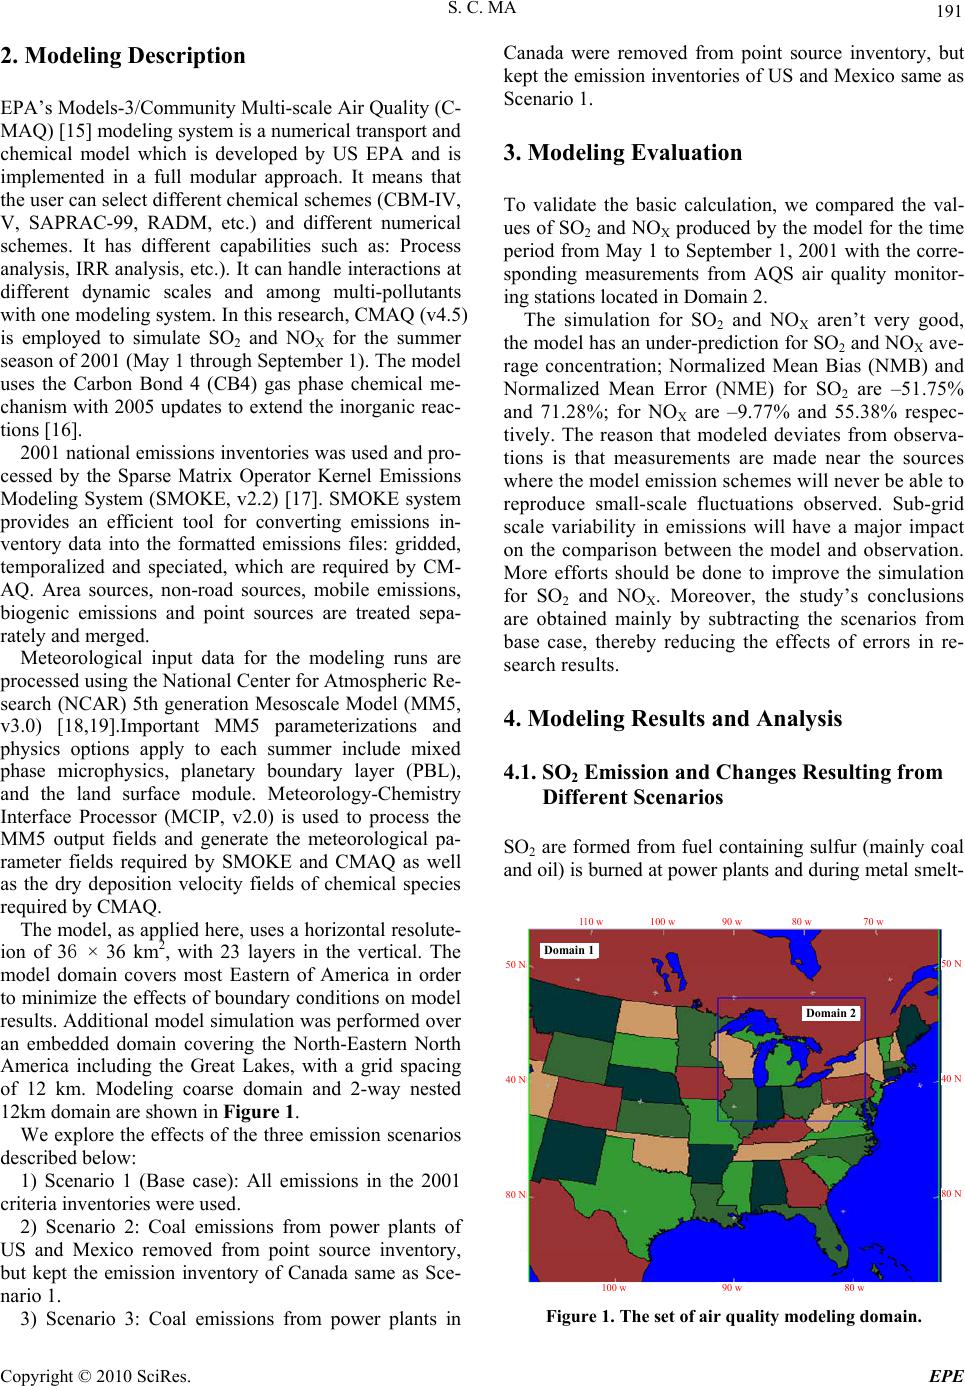 S. C. MA Copyright © 2010 SciRes. EPE 191 2. Modeling Description EPA’s Models-3/Community Multi-scale Air Quality (C- MAQ) [15] modeling system is a numerical transport and chemical model which is developed by US EPA and is implemented in a full modular approach. It means that the user can select different chemical schemes (CBM-IV, V, SAPRAC-99, RADM, etc.) and different numerical schemes. It has different capabilities such as: Process analysis, IRR analysis, etc.). It can handle interactions at different dynamic scales and among multi-pollutants with one modeling system. In this research, CMAQ (v4.5) is employed to simulate SO2 and NOX for the summer season of 2001 (May 1 throu gh Sep tember 1). Th e model uses the Carbon Bond 4 (CB4) gas phase chemical me- chanism with 2005 updates to extend the inorganic reac- tions [16] . 2001 national emissions inventories was used and pro- cessed by the Sparse Matrix Operator Kernel Emissions Modeling System (SMOKE, v2.2) [17]. SMOKE system provides an efficient tool for converting emissions in- ventory data into the formatted emissions files: gridded, temporalized and speciated, which are required by CM- AQ. Area sources, non-road sources, mobile emissions, biogenic emissions and point sources are treated sepa- rately and merged. Meteorological input data for the modeling runs are processed using the National Center for Atmospheric Re- search (NCAR) 5th generation Mesoscale Model (MM5, v3.0) [18,19].Important MM5 parameterizations and physics options apply to each summer include mixed phase microphysics, planetary boundary layer (PBL), and the land surface module. Meteorology-Chemistry Interface Processor (MCIP, v2.0) is used to process the MM5 output fields and generate the meteorological pa- rameter fields required by SMOKE and CMAQ as well as the dry deposition velocity fields of chemical species required by CMAQ. The model, as applied here, uses a horizontal resolute- ion of 36 × 36 km2, with 23 layers in the vertical. The model domain covers most Eastern of America in order to minimize the effects of boundary co nditions on model results. Additional model simulation was performed over an embedded domain covering the North-Eastern North America including the Great Lakes, with a grid spacing of 12 km. Modeling coarse domain and 2-way nested 12km domain are shown in Figure 1. We explore the effects of the three emission scenarios described below: 1) Scenario 1 (Base case): All emissions in the 2001 criteria inventories were used. 2) Scenario 2: Coal emissions from power plants of US and Mexico removed from point source inventory, but kept the emission inventory of Canada same as Sce- nario 1. 3) Scenario 3: Coal emissions from power plants in Canada were removed from point source inventory, but kept the emission inventories of US and Mexico same as Scenario 1. 3. Modeling Evaluation To validate the basic calculation, we compared the val- ues of SO2 and NOX produced by the model for the time period from May 1 to September 1, 2001 with the corre- sponding measurements from AQS air quality monitor- ing stations located in Doma in 2. The simulation for SO2 and NOX aren’t very good, the model has an under-prediction for SO2 and NOX ave- rage concentration; Normalized Mean Bias (NMB) and Normalized Mean Error (NME) for SO2 are –51.75% and 71.28%; for NOX are –9.77% and 55.38% respec- tively. The reason that modeled deviates from observa- tions is that measurements are made near the sources where the model emission schemes will never be able to reproduce small-scale fluctuations observed. Sub-grid scale variability in emissions will have a major impact on the comparison between the model and observation. More efforts should be done to improve the simulation for SO2 and NOX. Moreover, the study’s conclusions are obtained mainly by subtracting the scenarios from base case, thereby reducing the effects of errors in re- search results. 4. Modeling Results and Analysis 4.1. SO2 Emission and Changes Resulting from Different Scenarios SO2 are formed from fuel containing sulfur (mainly coal and oil) is burned at power plants and during metal sme lt- Domain 1 Domain 2 110 w100 w90 w 80 w 70 w 50 N 40 N 80 N 50 N 40 N 80 N 100 w90 w 80 w Figure 1. The set of air quality modeling domain.  S. C. MA Copyright © 2010 SciRes. EPE 192 ing and other industrial processes. SO2 emissions from power plants react with other chemicals in the atmos- phere to form sulfate particles, an important contributor to the fine particle mix that circulates with the air we breathe. Figure 2 and Figure 3 show the average SO2 emission flux and SO2 concentration in North-Eastern North America in the summer season of 2001. Th e aver age SO 2 emission flux was 0.021mol/s in whole domain in the summer. Several regions such as Chicago, southern Ohio, northern West Virginia and western Pennsylvania etc. were responsible for a significant proportion of SO2 em- issions. Many large coal-fired power plants encompasses in Ohio River Valley, which is a well-known emission source of precursors of acid rain in the North America. Same as emission, these areas had higher SO2 average concentration in this summer. Figure 4 shows the average difference of SO2 concen- tration from base case and Scenario 2, which produce by Average SO2 emission flux in the summer of 2001 a = em ission.mai ndata. d2 96 1 1 1.000 0.900 0.800 0.700 0.600 0.500 0.400 0.300 0.200 0.100 0.000 moles/s 102 Figure 2. Average SO2 emission flux in the summer season of 2001 in North-Eastern North America. Average SO 2 concentration in the summer of 2001 a = CCTM_2001 sulfurcon.d2 96 1 1 0.010 0.009 0.008 0.007 0.006 0.005 0.004 0.003 0.002 0.001 0.000 ppmV 102 Figure 3. Spatially resolved hourly Average SO2 concentra- tion in the summer season of 2001 in North-Eastern North America. the average of SO2 concentration simulating from base case minus those of Scenario 2. The regions of high SO2 concentration are the areas affected by the SO2 emission of coal-fired power plants apparently. The highest dif- ference of SO2 concentration exists at the region of west Pennsylvania abou t 0.012 ppmv, it is easy to see that the Ohio River Valley is biggest source of SO2 from coal- fired power plants in researched domain. Figure 5 shows the average SO2 concentration simu- lating from three scenarios in the summer of 2001. The average SO2 concentration of base case in domain 2 is 0.001 ppm in this summer. Average SO2 concentration getting from Scenarios 2 and 3 are 0.00033 and 0.000672 ppm, these mean coal-fired power plants from US and Canada contribute 67.2% and 32.8% for total SO2 con- centration in researched domain. According to EPA report, power plants account for 69% o f total SO 2 emission in the US in 2001 [20]. So, this is consistent with our research results for the most part. Average S O 2 concentration b etween b ase case and scenario 2 a = CCT M_2 001base cas e .d2 , b = CCTM_ 2001s ce nar io 2. d2 96 1 1 0.012 0.011 0.010 0.008 0.007 0.006 0.005 0.004 0.002 0.001 0.000 ppmV 102 Figure 4. Spatially resolved hourly average difference of SO2 concentration from base case and Scenario 2 in the su- mmer season of 2001 in North-Eastern North America. 0 0.0002 0.0004 0.0006 0.0008 0.001 0.0012 Scenario 1Scenario 2Scenario 3 SO 2 co n centration, p pmV Figure 5. Average SO2 concentration simulating from dif- ferent scenarios in the summer of 2001.  S. C. MA Copyright © 2010 SciRes. EPE 193 4.2. SO2 Emission Control from Coal-Fired Power Plants To help reduce acid rain, EPA is implementing a pro- gram to reduce releases of SO2 and other pollutants from coal-fired power plants. The first phase began in 1995 for SO2 and targets the largest and highest emit ting pow- er plants. The second phase (started in 2000) sets tighter restrictions on smaller coal-, gas-, and oil-fired plants. This program will reduce annual SO2 emissions by 10 million tons (almost half the 1980 level) between 1980 and 2010. The control of SO2 emissions is currently achieved using an innovative strategy called cap and trade, established by the CAAA of 1990 and adminis- tered by EPA, which is the world’s first large-scale cap- and-trade program for air pollution. The program is de- signed to reduce electric power sector emissions of SO2 through a national, market-based cap-and-trade system for SO2 emissions with the goal of reducing the adverse effe ct s of acid rain. The total SO2 release allowed is set at a maximum of 8.95 million tons by the year 2010—ap- proximately half of 1980 emissions [21]. Four main technology strategies for SO2 emissions control have b een used by the electricity industry [22]: 1) Tall gas stacks that disperse emissions away from immediate areas; 2) Intermittent controls which involve routine opera- tional adjustments to reduce power plant SO2 emissions in response to atmospheric conditions; 3) Pre-combustion reduction of sulfur from fuels; and 4) Removal of SO2 from the post-combustion gas stream, the main method is FGD. There are a wide vari- ety of FGD techniques, of which the most common are wet scrubbers. Wet scrubbers work by using a slurry or solution to absorb SO2, producing an initially wet by- product. Frequently, limestone is used as the absorbent, generating gypsum as a by-product. Typically, FGD can achieve SO2 removal efficiency more than 90%. 4.3. NOX Emission and Changes Resulting from Different Scenarios NOX is the term used to describe the sum of nitric oxide (NO), nitrogen dioxide (NO2), and other oxides of nitro- gen. NOX plays a major role in the formation of acid rain, secondary PM, ground level ozone, and smog in the atm- osphere through a complex series of reactions with vola- tile organic compounds (VOCs), sunlight and water va- pors. The Relationship between VOC and NOX and O3 has extensive studies [23-26]. NOX also contributes to visibility impairment. The major sources of human-pro- duced NOX emissions are high-temperature combustion processes such as those that occur in electrical power plants and automobiles. Anthropogenic NOx emissions in the US are estimated to total 22.2 Tg (as NO2) per year, with 53% from transportation, coal-fired plants are an- other major sources of NOX because of the fuel they burn [27]. Figure 6 and Figure 7 show the average NOX emiss- ion flux and concentration in North-Eastern North Am- erica in summer season of 2001. The average NOX emis- sion flux was 0.20 mol/s in whole domain in the su mmer. Big cities such as Chicago, Detroit, and Toronto etc. have much more emission of NOX than other areas, wh- ich arising from local motor vehicle emission s primarily. The biggest average NOx concentration is 0.056 ppmv in Toronto city. Figure 8 shows the average NOX concentration simu- lating from three scenarios in the summer of 2001. The average NOX concentration of base case in domain 2 is 0.00199 ppm in this summer. Average NOX concentra- tion getting from Scenario 2 in Toronto city change to 0.029 ppmv, this mean the emissions of coal-fired power plants from US can transport long distance through the Average NO X emission flux in the summer of 2001 a = emission.maindata.d2 96 1 1 8.000 7.200 6.400 5.600 4.800 4.000 3.200 2.400 1.600 0.800 0.000 moles/s 102 Figure 6. Average NOX emission flux in summer season of 2001 in North-Eastern North America. Average NO X concentration in the summer of 2001 a = CCTM_20 01NO X .d2 96 1 1 0.056 0.045 0.034 0.022 0.011 0.000 ppmV 102 Figure 7. Average NOX concentration in summer season of 2001 in North-Eastern North America. 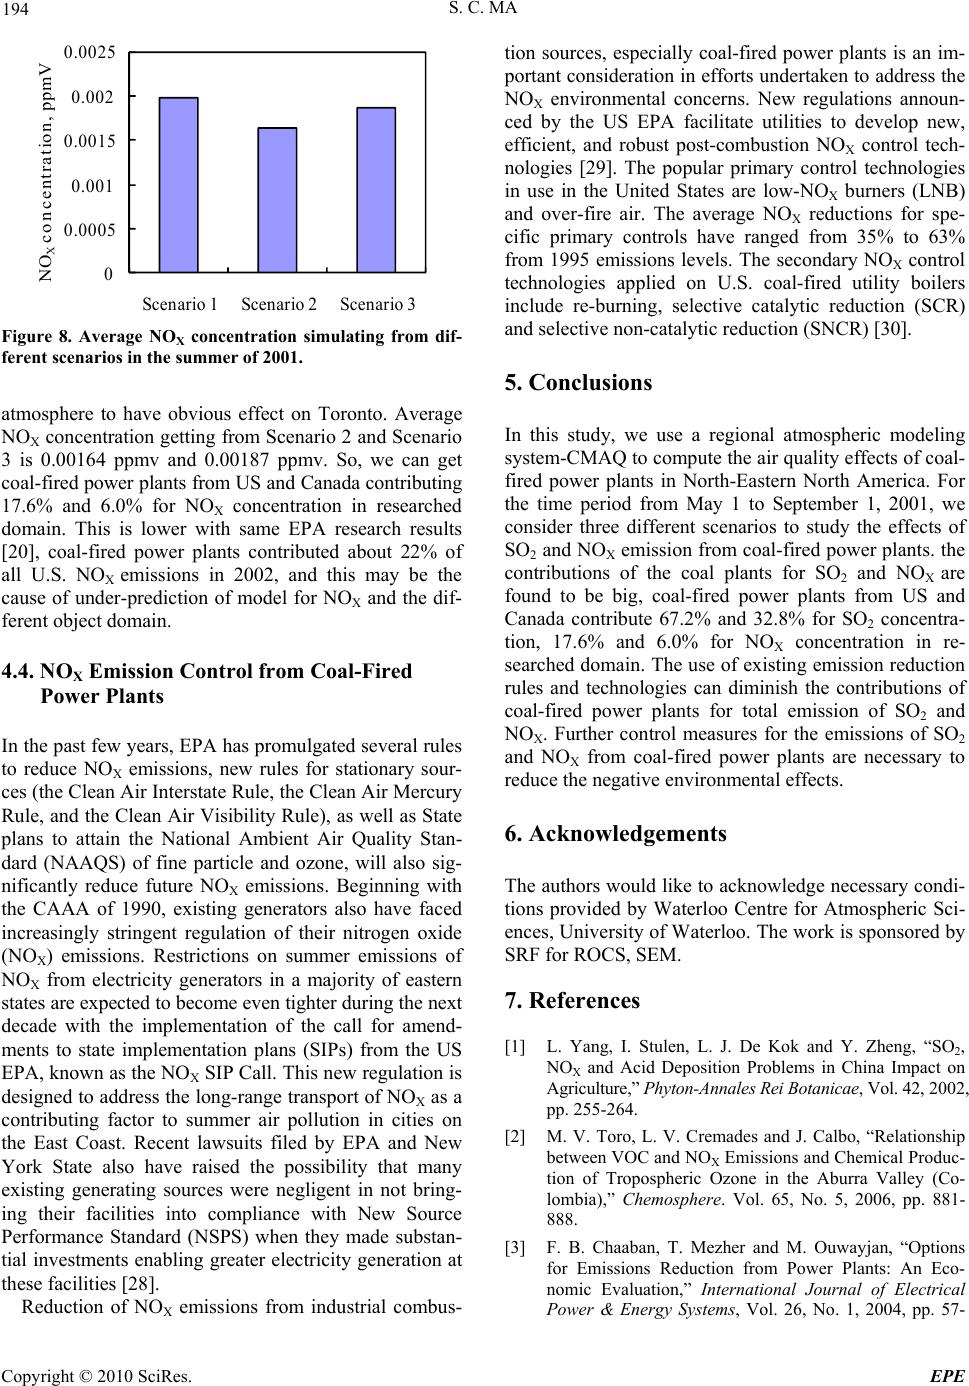 S. C. MA Copyright © 2010 SciRes. EPE 194 0 0.0005 0.001 0.0015 0.002 0.0025 Scenario 1Scenario 2Scenario 3 NO X concent rat ion, ppmV Figure 8. Average NOX concentration simulating from dif- ferent scenarios in the summer of 2001. atmosphere to have obvious effect on Toronto. Average NOX concentratio n getting from Scenario 2 and Scenario 3 is 0.00164 ppmv and 0.00187 ppmv. So, we can get coal-fired power plants from US and Canada contributing 17.6% and 6.0% for NOX concentration in researched domain. This is lower with same EPA research results [20], coal-fired power plants contributed about 22% of all U.S. NOX emissions in 2002, and this may be the cause of under-prediction of model for NOX and the dif- ferent object domain. 4.4. NOX Emission Control from Coal-Fired Power Plants In the past few years, EPA has promulgated several rules to reduce NOX emissions, new rules for stationary sour- ces (the Clean Air Interstate Rule, the Clean Air Mercury Rule, and the Clean Air Visibility Rule), as well as State plans to attain the National Ambient Air Quality Stan- dard (NAAQS) of fine particle and ozone, will also sig- nificantly reduce future NOX emissions. Beginning with the CAAA of 1990, existing generators also have faced increasingly stringent regulation of their nitrogen oxide (NOX) emissions. Restrictions on summer emissions of NOX from electricity generators in a majority of eastern states are expected to become even tighter during the next decade with the implementation of the call for amend- ments to state implementation plans (SIPs) from the US EPA, known as the NOX SIP Call. This new regulation is designed to address the long-range transport of NOX as a contributing factor to summer air pollution in cities on the East Coast. Recent lawsuits filed by EPA and New York State also have raised the possibility that many existing generating sources were negligent in not bring- ing their facilities into compliance with New Source Performance Standard (NSPS) when they made substan- tial investments enabling greater electricity generation at these facilities [28]. Reduction of NOX emissions from industrial combus- tion sources, especially coal-fired power plants is an im- portant consideration in efforts undertaken to address the NOX environmental concerns. New regulations announ- ced by the US EPA facilitate utilities to develop new, efficient, and robust post-combustion NOX control tech- nologies [29]. The popular primary control technologies in use in the United States are low-NOX burners (LNB) and over-fire air. The average NOX reductions for spe- cific primary controls have ranged from 35% to 63% from 1995 emissions levels. The secondary NOX control technologies applied on U.S. coal-fired utility boilers include re-burning, selective catalytic reduction (SCR) and selective non-catalytic reduction (SNCR) [30]. 5. Conclusions In this study, we use a regional atmospheric modeling system-CMAQ to compute the air quality effects of coal- fired power plants in North-Eastern North America. For the time period from May 1 to September 1, 2001, we consider three different scenarios to study the effects of SO2 and NOX emission from coal-fired power plants. the contributions of the coal plants for SO2 and NOX are found to be big, coal-fired power plants from US and Canada contribute 67.2% and 32.8% for SO2 concentra- tion, 17.6% and 6.0% for NOX concentration in re- searched domain. The use of existing emission reduction rules and technologies can diminish the contributions of coal-fired power plants for total emission of SO2 and NOX. Further control measures for the emissions of SO2 and NOX from coal-fired power plants are necessary to reduce the negative environmental effects. 6. Acknowledgements The authors would lik e to acknowledge necessary condi- tions provided by Waterloo Centre for Atmospheric Sci- ences, University of Waterloo. The work is sponsored by SRF for ROCS, SEM. 7. References [1] L. Yang, I. Stulen, L. J. De Kok and Y. Zheng, “SO2, NOX and Acid Deposition Problems in China Impact on Agriculture,” Phyton-Annales Rei Botanicae, Vol. 42, 2002, pp. 255-264. [2] M. V. Toro, L. V. Cremades and J. Calbo, “Relationship between VOC and NOX Emissions and Chemical Produc- tion of Tropospheric Ozone in the Aburra Valley (Co- lombia),” Chemosphere. Vol. 65, No. 5, 2006, pp. 881- 888. [3] F. B. Chaaban, T. Mezher and M. Ouwayjan, “Options for Emissions Reduction from Power Plants: An Eco- nomic Evaluation,” International Journal of Electrical Power & Energy Systems, Vol. 26, No. 1, 2004, pp. 57-  S. C. MA Copyright © 2010 SciRes. EPE 195 63. [4] M. Victor, “Recent EPA Regulatory Actions and Effects on NOX Controls,” Proceedings of the 2006 Environ- mental Controls Conference, U.S. Department of Energy, National Energy Technology Laboratory, Pittsburgh, 2006, pp. 1-2. [5] J. R. Swinton, “Phase I Completed: An Empirical As- sessment of the 1990 CAAA,” Environmental & Re- source Economics, Vol. 27, No. 3, 2004, pp. 227-246. [6] J. H. Goo, M. F. Irfan, S. D. Kim and S. C. Hong, “Ef- fects of NO2 and SO2 on Selective Catalytic Reduction of Nitrogen Oxides by Ammonia,” Chemosphere, Vol. 67, No. 4, 2007, pp. 718-723. [7] D. Stevenson and R. Dale, “Limestone FGD System Ret- rofit to San Juan Generating Station: Start-up Problems and Performance Following Start-up,” Combined Power Plant Air Pollutant Control Mega Symposium, 2004, pp. 823-836. [8] J. M. Hao, L. T. Wang, M. J. Shen, L. Li and J. N. Hu, “Air Quality Impacts of Power Plant Emissions in Bei- jing,” Environmental Pollution, Vol. 147, No. 2, 2007, pp. 401-408. [9] F. Mehdizadeh and H. S. Rifai, “Modeling Point Source Plumes at High Altitudes Using a Modified Gaussian Model,” Atmospheric Environment, Vol. 38, No. 6, 2004, pp. 821-831. [10] R. P. Hermann, et al., “Predicting Premature Mortality from New Power Plant Development in Virginia,” Ar- chives of Environmental Health, Vol. 59, No. 10, 2004, pp. 529-535. [11] M. J. Martin, et al., “High Performance Air Pollution Modeling for a Power Plant Environment,” Parallel Computing, Vol. 29, No. 11-12, 2003, pp. 1763-1790. [12] J. C. H. Fung, et al., “Observational and Modeling Analy- sis of a Severe Air Pollution Episode in Western Hong Kong,” Journal of Geophysical Research, Vol. 110, No. D9, 2005, p. 9105. [13] J. Chen, R. Bornstein and C. G. Lindsey, “Transport of a Power Plant Tracer Plume over Grand Canyon National Park,” Journal of Applied Meteorology, Vol. 38, No. 8, 1999, pp. 1049-1068. [14] S. R. Springston, et al., “Chemical Evolution of an Iso- lated Power Plant Plume during the TexAQS 2000 Stu- dy,” Atmospheric Environment, Vol. 39, No. 19, 2005, pp. 3431-3443. [15] J. C. St John and W. L. Chameides, “Possible Role of Power Plant Plume E missions in Fostering O3 Exceedence Events in Atlanta, Georgia,” Journal of Geophysical Re- search, Vol. 105, No. D7, 2000, pp. 9203-9211. [16] D. W. Byun and J. K. S. Ching, “Science Algorithms of the EPA Models-3 Community Multiscale Air Quality (CMAQ) Modeling System,” U.S. Environmental Protec- tion Agency, NERL, Research Triangle Park, 1999. [17] M. W. Gery, G. Z. Whitten, J. P. Killus and M. C. Dodge, “A Photochemica l Kinetics Mechanism for Urban and Re- gional-Scale Computer Modelin g,” Journal of Geophysical Research, Vol. 94, No. D10, 1989, pp. 12925-12956. [18] M. Houyoux, J. Vukovich and J. Brandmeyer, “Sparse Matrix Kernel Emissions Modeling System: SMOKE User Manual,” MCNC-North Carolina Supercomputing Center, 2000. [19] G. A. Grell, J. Dudhia and D. R. Stauffer, “A Description of the Fifth-Generation Penn State/NCAR Mesoscale Model (MM5),” NCAR Technical Note, NCAR, Boulder, CO, 1995. [20] Y. R. Guo and S. Chen, “Terrain and Land Use for the Fifth-Generation Penn State/NCAR Mesoscale Modeling System (MM5): Program TERRAIN,” NCAR/TN-397+ IA NCAR Technical Note, National Center for Atmos- pheric Research, Boulder, 1994. [21] U.S.EPA, “Acid Rain Program 2002 Progress Report,” EPA 430/R-03-011, Washington DC, 2003. [22] S. Napolitano, J. Schreifels, G. Stevens, M. Witt, M. La- Count, R. Forte and K. Smith, “The U.S. Acid Rain Pro- gram: Key Insights from the Design, Operation, and As- sessment of a Cap-and-Trade Program,” The Electricity Journal, Vol. 20, No. 7, 2007, pp. 47-58. [23] NAPAP, “NAPAP Report to Congress: An Integrated Assessment National Acid,” Precipitation Assessment Program Office of the Director, Washington, D.C., 2005. [24] M. R. Taylor, E. S. Rubin and D. A. Hounshell, “Control of SO2 Emissions from Power Plants: A Case of Induced Technological Innovation in the US,” Technological Fo- recasting and Social Change, Vol. 72, No. 6, pp. 697- 718, 2005. [25] Y. P. Peng, K. S. Chen, C. H. Lai, P. J. Lu and J. H. Kao, “Concentrations of H2O2 and HNO3 and O3-VOC-NOX sensitivity in ambient air in southern Taiwan,” Atmospheric Environment, Vol. 40, No. 35, 2006, pp. 6741-6751. [26] I. Filella and J. Penuelas, “Daily, Weekly and Seasonal Relationships among VOCs, NOX and O3 in a Semi-Ur- ban Area near Barcelona,” Journal of Atmospheric Che- mistry, Vol. 54, No. 2, 2006, pp. 189-201. [27] A. F. Stein, E. Mantilla and M. M. Millan, “Using Meas- ured and Modeled Indicators to Assess Ozone-NOX- VOC Sensitivity in a Western Mediterranean Coastal En- vironment,” Atmospheric Environment. Vol. 39, No. 37, 2005, pp. 7167-7180. [28] U.S. EPA, “National Air Quality and Emissions Trends Report, 1900-1998,” EPA 454/R-00-003, U.S. Environ- mental Protection Agency, Washington, DC, 2000. [29] D. Burtraw, K. Palmer, R. Bharvirkar and A. Paul, “Re- structuring and Cost of Reducing NOX Emissions in Electricity Generation,” Discussion Paper 01-10REV, Resources for the Future, Washington, DC, 2001. [30] Y. Fu and M. D. Urmila, “Cost Effective Environmental Control Technology for Utilities,” Advances in Environ- mental Research, Vol. 8, No. 2, 2004, pp. 173-196. [31] R. K. Srivastava, R. E Hall and S. Khan, “Nitrogen Ox- ides Emission Control Options for Coal-Fired Electric Utility Boilers,” Journal of the Air & Waste Management Association, Vol. 55, No. 9, 2005, pp. 1367-1388. |