 Materials Sciences and Applications, 2010, 1, 141-151 doi:10.4236/msa.2010.13023 Published Online August 2010 (http://www.SciRP.org/journal/msa) Copyright © 2010 SciRes. MSA 141 Optical Absorption of Nano-Composite Thin Films of Au in Teflon Dmytro Grynko1, Konstantin Grytrsenko1, Valeri Lozovski1,2, Mykola Sopinskyy1, Galyna Strilchuk1,2 1V.Lashkaryov Institute of Semiconductor Physics, National Academy of Sciences of Ukraine, Kyiv, Ukraine; 2Kyiv T.Shevchenko National University, Institute of High Technologies, Kyiv, Ukraine. Email: gstrilchuk@gmail.com Received May 13th, 2010; revised June 13th, 2010; accepted June 23rd, 2010. ABSTRACT Nano-composite films of Au particles in Teflon were obtained by thermal vacuum deposition. The obtained films were characterized by the different shapes and dimensions of the inclusion particles. Absorption spectra of the films were measured in-situ. A model for the calculation of the optical properties of the nano-composite thin films with an inho- mogeneous distribution of the inclusions along the thickness of the film is proposed. Absorption properties of inclusions were analyzed by considering the local field interaction. The calculated absorption profiles are compared with the ex- perimentally obtained absorption profiles. This comparison gives a possibility to draw conclusions about the concen- tration, shapes and shape distributions of the inclusion particles. For example, the films obtained by duration deposi- tion are characterized by inclusions having the shape of prolate ellipsoids oriented normally to surface of the film. Keywords: Nano-Composite, Optical Absorption Spectra, Thin Film, Effective Susceptibility, Teflon, Gold, Vacuum Deposition 1. Introduction The study of optical properties of thin nano-composite fi- lms is a powerful tool for understanding the physical pro- perties and the spatial structure of the material. The tailo- ring of physical properties can be performed by choosing appropriate particle sizes, opening the way to a compos- ite material with remarkable effects, especially in optoel- ectronics. The development of composite materials based on semiconductor quantum dots (see for example, [1]) is an example of these applications. Much attention has be- en focused on the physical and optical properties of met- allic clusters embedded in a dielectric matrix. It is well known that metallic nanoparticles show clear size effects in their thermodynamic properties [1-4]. Nanoclusters, mostly of noble metals, are widely studied for applicati- ons in sensors [5-9], photonics devices and plasmonic st- ructures [10], waveguides [11], films for photovoltaics [12], medicine [13], chemical catalysis [14], filters [15], electronic devices [16,17], etc. In this work we consider Au/Teflon nano-composites. The optical properties, such as absorption and lumine- scence [18], are widely used for the determination of ch- anges in the structure of metal/polymer films [15], und- erstanding of electrical processes in thin films, analysis of particles sizes [19], shapes [16] and sizes distributions [16]. We shall analytically simulate the absorption spec- tra and thus have an opportunity to analyze the paramet- ers of the film. These simulations can be performed by taking into account the inhomogeneity of the film and the presence of the third phase (air). It is well known that the macroscopic Maxwell equat- ions can be used only when the characteristic wavelength of the system is much larger than the scale of the mi- crofield inhomogeneities l ( >> l), which can be com- parable to the thicknesses of transition layers in the sur- face or interface domains. Also, when we deal with thin films we should take into account the near-interface lay- ers at both sides. In the case of thin films where the near- interface layer length is comparable to the thickness of the film, the local field inhomogeneity plays an essential role, which makes the use of microscopic approaches not expedient. Indeed, on one hand such an approach is mat- hematically complex and, on the other hand, it depends strongly on the specific model. It is much more reasonab- le to take advantage of a mesoscopic approach, which has been actively developed in near-field optics, in parti- cular, in methods of scanning near-field optical microsc- opy [20-25]. Therefore, we shall consider the electrodyn- amics of thin and ultrathin films in the framework of the self-consistent (local) field approach, which does not dir- ectly involve the Maxwell boundary conditions, and ta- 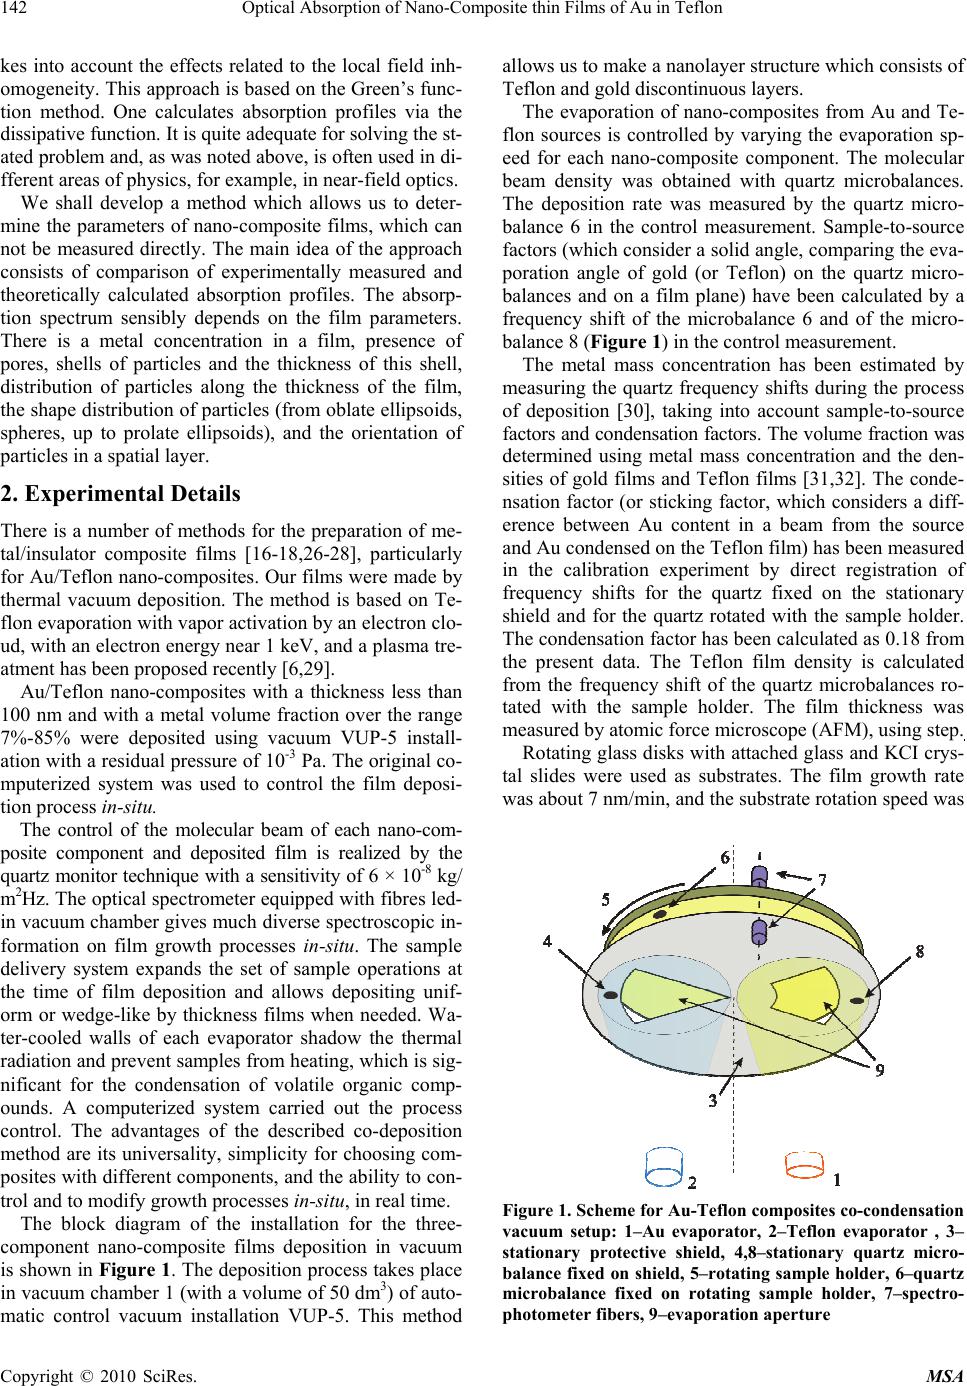 Optical Absorption of Nano-Composite thin Films of Au in Teflon 142 kes into account the effects related to the local field inh- omogeneity. This approach is based on the Green’s func- tion method. One calculates absorption profiles via the dissipative function. It is quite adequate for solving the st- ated problem and, as was noted above, is often used in di- fferent areas of physics, for example, in near-field optics. We shall develop a method which allows us to deter- mine the parameters of nano-composite films, which can not be measured directly. The main idea of the approach consists of comparison of experimentally measured and theoretically calculated absorption profiles. The absorp- tion spectrum sensibly depends on the film parameters. There is a metal concentration in a film, presence of pores, shells of particles and the thickness of this shell, distribution of particles along the thickness of the film, the shape distribution of particles (from oblate ellipsoids, spheres, up to prolate ellipsoids), and the orientation of particles in a spatial layer. 2. Experimental Details There is a number of methods for the preparation of me- tal/insulator composite films [16-18,26-28], particularly for Au/Teflon nano-composites. Our films were made by thermal vacuum deposition. The method is based on Te- flon evaporation with vapor activation by an electron clo- ud, with an electron energy near 1 keV, and a plasma tre- atment has been proposed recently [6,29]. Au/Teflon nano-composites with a thickness less than 100 nm and with a metal volume fraction over the range 7%-85% were deposited using vacuum VUP-5 install- ation with a residual pressure of 10-3 Pa. The original co- mputerized system was used to control the film deposi- tion process in-situ. The control of the molecular beam of each nano-com- posite component and deposited film is realized by the quartz monitor technique with a sensitivity of 6 × 10⁻⁸ kg/ m2Hz. The optical spectrometer equipped with fibres led- in vacuum chamber gives much diverse spectroscopic in- formation on film growth processes in-situ. The sample delivery system expands the set of sample operations at the time of film deposition and allows depositing unif- orm or wedge-like by thickness films when needed. Wa- ter-cooled walls of each evaporator shadow the thermal radiation and prevent samples from heating, which is sig- nificant for the condensation of volatile organic comp- ounds. A computerized system carried out the process control. The advantages of the described co-deposition method are its universality, simplicity for choosing com- posites with different components, and the ability to con- trol and to modify growth processes in-situ, in real time. The block diagram of the installation for the three- component nano-composite films deposition in vacuum is shown in Figure 1. The deposition process takes place in vacuum chamber 1 (with a volume of 50 dm3) of auto- matic control vacuum installation VUP-5. This method allows us to make a nanolayer structure which consists of Teflon and gold discontinuous layers. The evaporation of nano-composites from Au and Te- flon sources is controlled by varying the evaporation sp- eed for each nano-composite component. The molecular beam density was obtained with quartz microbalances. The deposition rate was measured by the quartz micro- balance 6 in the control measurement. Sample-to-source factors (which consider a solid angle, comparing the eva- poration angle of gold (or Teflon) on the quartz micro- balances and on a film plane) have been calculated by a frequency shift of the microbalance 6 and of the micro- balance 8 (Figure 1) in the control measurement. The metal mass concentration has been estimated by measuring the quartz frequency shifts during the process of deposition [30], taking into account sample-to-source factors and condensation factors. The volume fraction was determined using metal mass concentration and the den- sities of gold films and Teflon films [31,32]. The conde- nsation factor (or sticking factor, which considers a diff- erence between Au content in a beam from the source and Au condensed on the Teflon film) has been measured in the calibration experiment by direct registration of frequency shifts for the quartz fixed on the stationary shield and for the quartz rotated with the sample holder. The condensation factor has been calculated as 0.18 from the present data. The Teflon film density is calculated from the frequency shift of the quartz microbalances ro- tated with the sample holder. The film thickness was measured by atomic force microscope (AFM), using step. Rotating glass disks with attached glass and KCI crys- tal slides were used as substrates. The film growth rate was about 7 nm/min, and the substrate rotation speed was Figure 1. Scheme for Au-Teflon composites co-condensation vacuum setup: 1–Au evaporator, 2–Teflon evaporator , 3– stationary protective shield, 4,8–stationary quartz micro- balance fixed on shield, 5–rotating sample holder, 6–quartz microbalance fixed on rotating sample holder, 7–spectro- photometer fibers, 9–evaporation aperture Copyright © 2010 SciRes. MSA 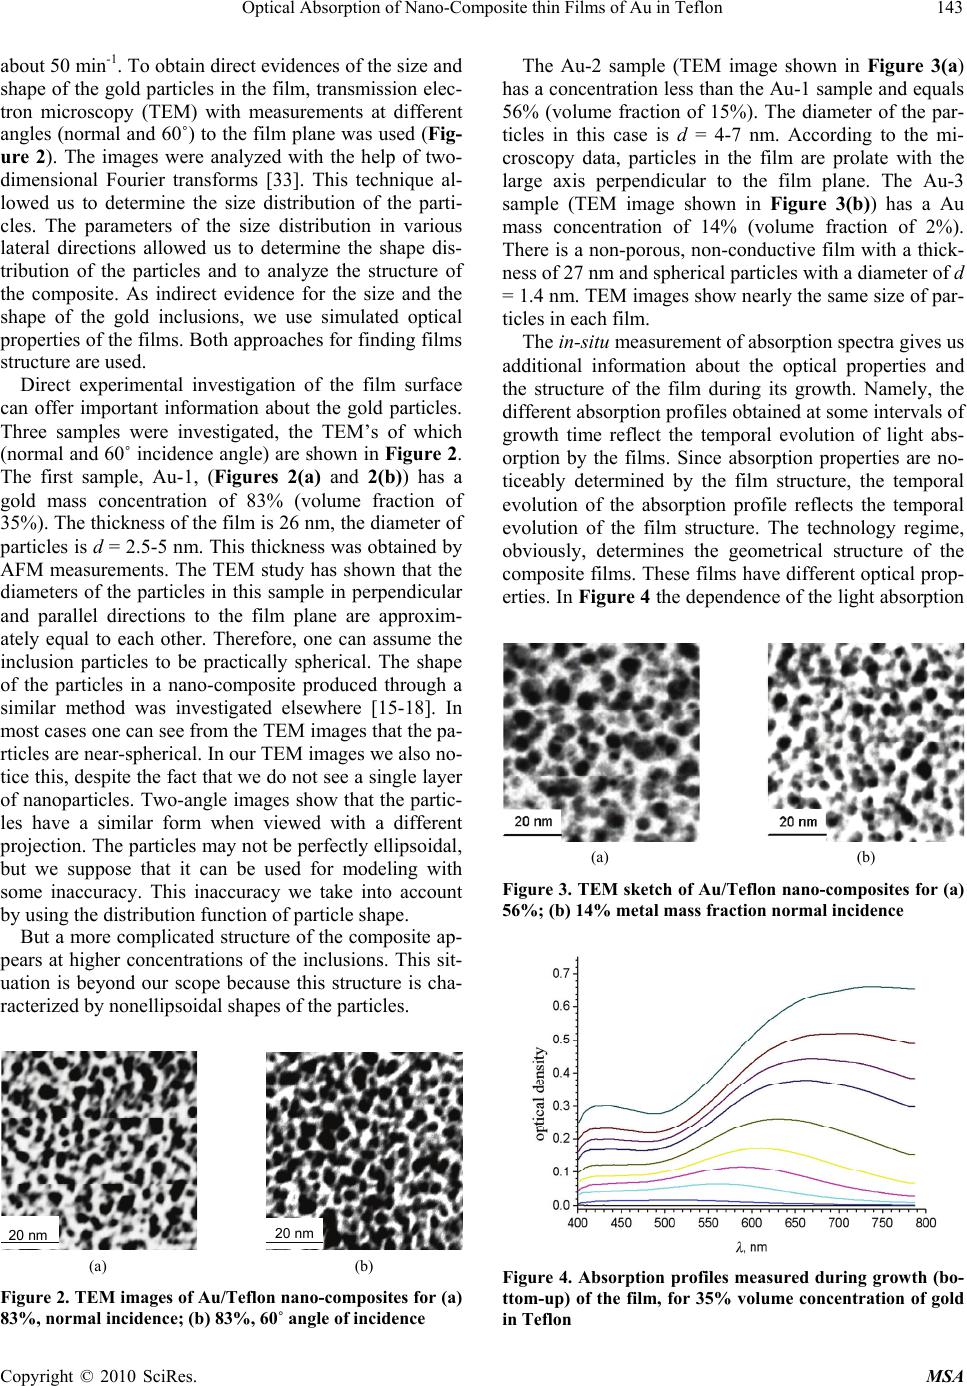 Optical Absorption of Nano-Composite thin Films of Au in Teflon143 about 50 min-1. To obtain direct evidences of the size and shape of the gold particles in the film, transmission elec- tron microscopy (TEM) with measurements at different angles (normal and 60˚) to the film plane was used (Fig- ure 2). The images were analyzed with the help of two- dimensional Fourier transforms [33]. This technique al- lowed us to determine the size distribution of the parti- cles. The parameters of the size distribution in various lateral directions allowed us to determine the shape dis- tribution of the particles and to analyze the structure of the composite. As indirect evidence for the size and the shape of the gold inclusions, we use simulated optical properties of the films. Both approaches for finding films structure are used. Direct experimental investigation of the film surface can offer important information about the gold particles. Three samples were investigated, the TEM’s of which (normal and 60˚ incidence angle) are shown in Figure 2. The first sample, Au-1, (Figures 2(a) and 2(b)) has a gold mass concentration of 83% (volume fraction of 35%). The thickness of the film is 26 nm, the diameter of particles is d = 2.5-5 nm. This thickness was obtained by AFM measurements. The TEM study has shown that the diameters of the particles in this sample in perpendicular and parallel directions to the film plane are approxim- ately equal to each other. Therefore, one can assume the inclusion particles to be practically spherical. The shape of the particles in a nano-composite produced through a similar method was investigated elsewhere [15-18]. In most cases one can see from the TEM images that the pa- rticles are near-spherical. In our TEM images we also no- tice this, despite the fact that we do not see a single layer of nanoparticles. Two-angle images show that the partic- les have a similar form when viewed with a different projection. The particles may not be perfectly ellipsoidal, but we suppose that it can be used for modeling with some inaccuracy. This inaccuracy we take into account by using the distribution function of particle shape. But a more complicated structure of the composite ap- pears at higher concentrations of the inclusions. This sit- uation is beyond our scope because this structure is cha- racterized by nonellipsoidal shapes of the particles. 20 nm 20 nm (a) (b) Figure 2. TEM images of Au/Teflon nano-composites for (a) 83%, normal incidence; (b) 83%, 60˚ angle of incidence The Au-2 sample (TEM image shown in Figure 3(a) has a concentration less than the Au-1 sample and equals 56% (volume fraction of 15%). The diameter of the par- ticles in this case is d = 4-7 nm. According to the mi- croscopy data, particles in the film are prolate with the large axis perpendicular to the film plane. The Au-3 sample (TEM image shown in Figure 3(b)) has a Au mass concentration of 14% (volume fraction of 2%). There is a non-porous, non-conductive film with a thick- ness of 27 nm and spherical particles with a diameter of d = 1.4 nm. TEM images show nearly the same size of par- ticles in each film. The in-situ measurement of absorption spectra gives us additional information about the optical properties and the structure of the film during its growth. Namely, the different absorption profiles obtained at some intervals of growth time reflect the temporal evolution of light abs- orption by the films. Since absorption properties are no- ticeably determined by the film structure, the temporal evolution of the absorption profile reflects the temporal evolution of the film structure. The technology regime, obviously, determines the geometrical structure of the composite films. These films have different optical prop- erties. In Figure 4 the dependence of the light absorption (a) (b) Figure 3. TEM sketch of Au/Teflon nano-composites for (a) 56%; (b) 14% metal mass fraction normal incidence Figure 4. Absorption profiles measured during growth (bo- ttom-up) of the film, for 35% volume concentration of gold in Teflon Copyright © 2010 SciRes. MSA 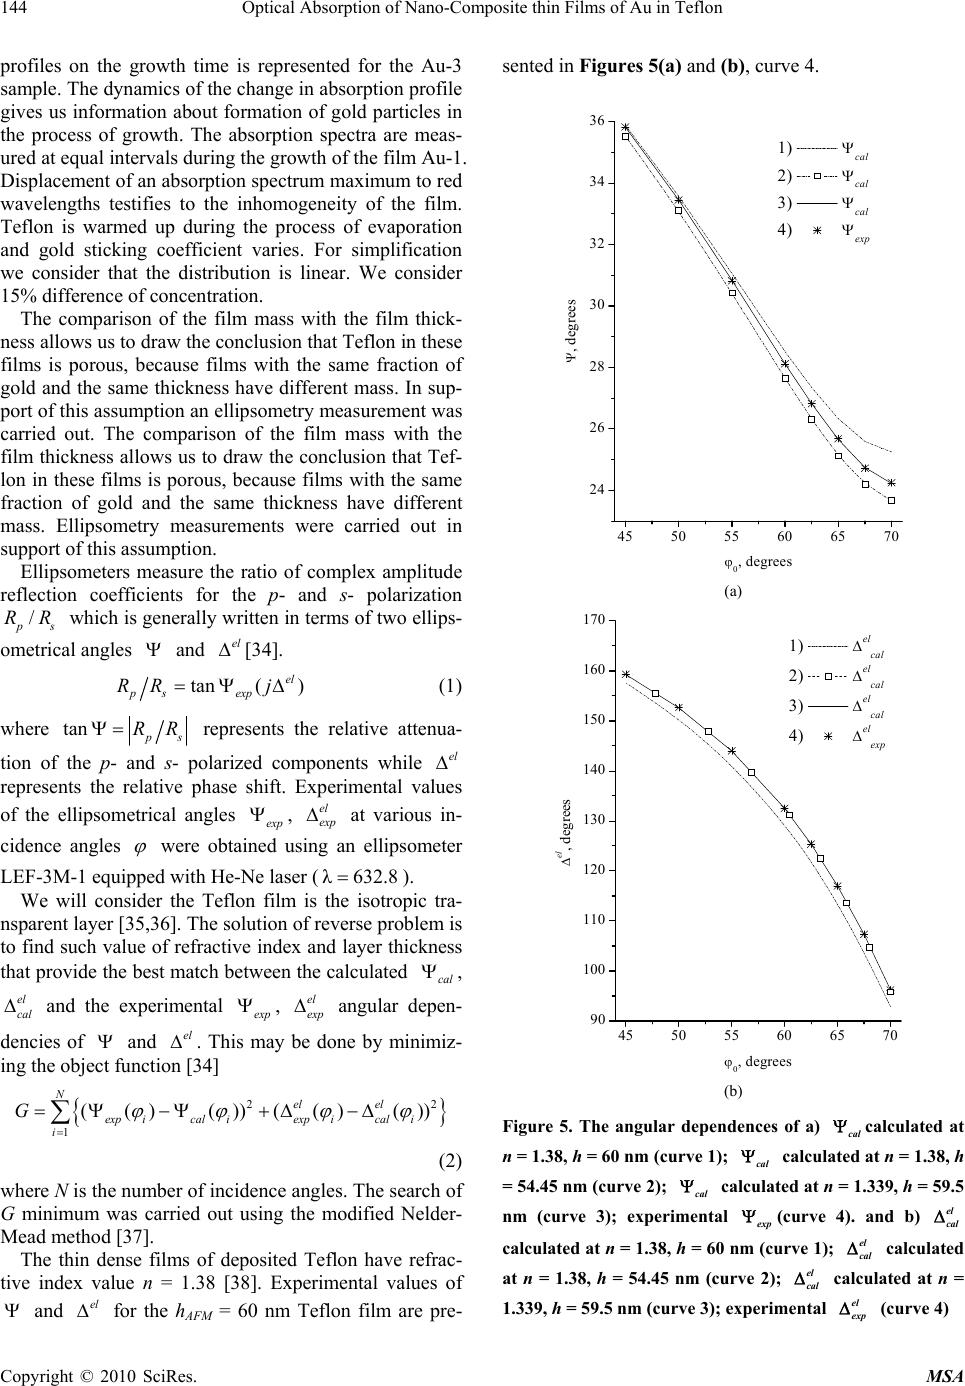 Optical Absorption of Nano-Composite thin Films of Au in Teflon 144 profiles on the growth time is represented for the Au-3 sample. The dynamics of the change in absorption profile gives us information about formation of gold particles in the process of growth. The absorption spectra are meas- ured at equal intervals during the growth of the film Au-1. Displacement of an absorption spectrum maximum to red wavelengths testifies to the inhomogeneity of the film. Teflon is warmed up during the process of evaporation and gold sticking coefficient varies. For simplification we consider that the distribution is linear. We consider 15% difference of concentration. The comparison of the film mass with the film thick- ness allows us to draw the conclusion that Teflon in these films is porous, because films with the same fraction of gold and the same thickness have different mass. In sup- port of this assumption an ellipsometry measurement was carried out. The comparison of the film mass with the film thickness allows us to draw the conclusion that Tef- lon in these films is porous, because films with the same fraction of gold and the same thickness have different mass. Ellipsometry measurements were carried out in support of this assumption. Ellipsometers measure the ratio of complex amplitude reflection coefficients for the p- and s- polarization / s RR which is generally written in terms of two ellips- ometrical angles and [34]. el tan( ) el ps exp RR j (1) where tan s RR represents the relative attenua- tion of the p- and s- polarized components while el represents the relative phase shift. Experimental values of the ellipsometrical angles exp , at various in- cidence angles el exp were obtained using an ellipsometer LEF-3M-1 equipped with He-Ne laser (). λ632.8 We will consider the Teflon film is the isotropic tra- nsparent layer [35,36]. The solution of reverse problem is to find such value of refractive index and layer thickness that provide the best match between the calculated cal , and the experimental el cal exp , angular depen- dencies of and . This may be done by minimiz- ing the object function [34] el exp el 22 1 (( )( ))(( )( )) Nel el exp ical iexp ical i i G (2) where N is the number of incidence angles. The search of G minimum was carried out using the modified Nelder- Mead method [37]. The thin dense films of deposited Teflon have refrac- tive index value n = 1.38 [38]. Experimental values of and for the hAFM = 60 nm Teflon film are pre- sented in Figures 5(a) and (b), curve 4. el 45 50 55 60 65 70 24 26 28 30 32 34 36 1) cal 2) cal 3) cal 4) exp , degrees 0, degrees (a) 45 50 55 60 65 70 90 100 110 120 130 140 150 160 170 1) el cal 2) el cal 3) el cal 4) el exp el, degrees 0, degrees (b) Figure 5. The angular dependences of a) calculated at n = 1.38, h = 60 nm (curve 1); calculated at n = 1.38, h = 54.45 nm (curve 2); cal cal cal calculated at n = 1.339, h = 59.5 nm (curve 3); experimental (curve 4). and b) exp el cal calculated at n = 1.38, h = 60 nm (curve 1); calculated at n = 1.38, h = 54.45 nm (curve 2); calculated at n = 1.339, h = 59.5 nm (curve 3); experimental (curve 4) el cal el exp el cal Copyright © 2010 SciRes. MSA 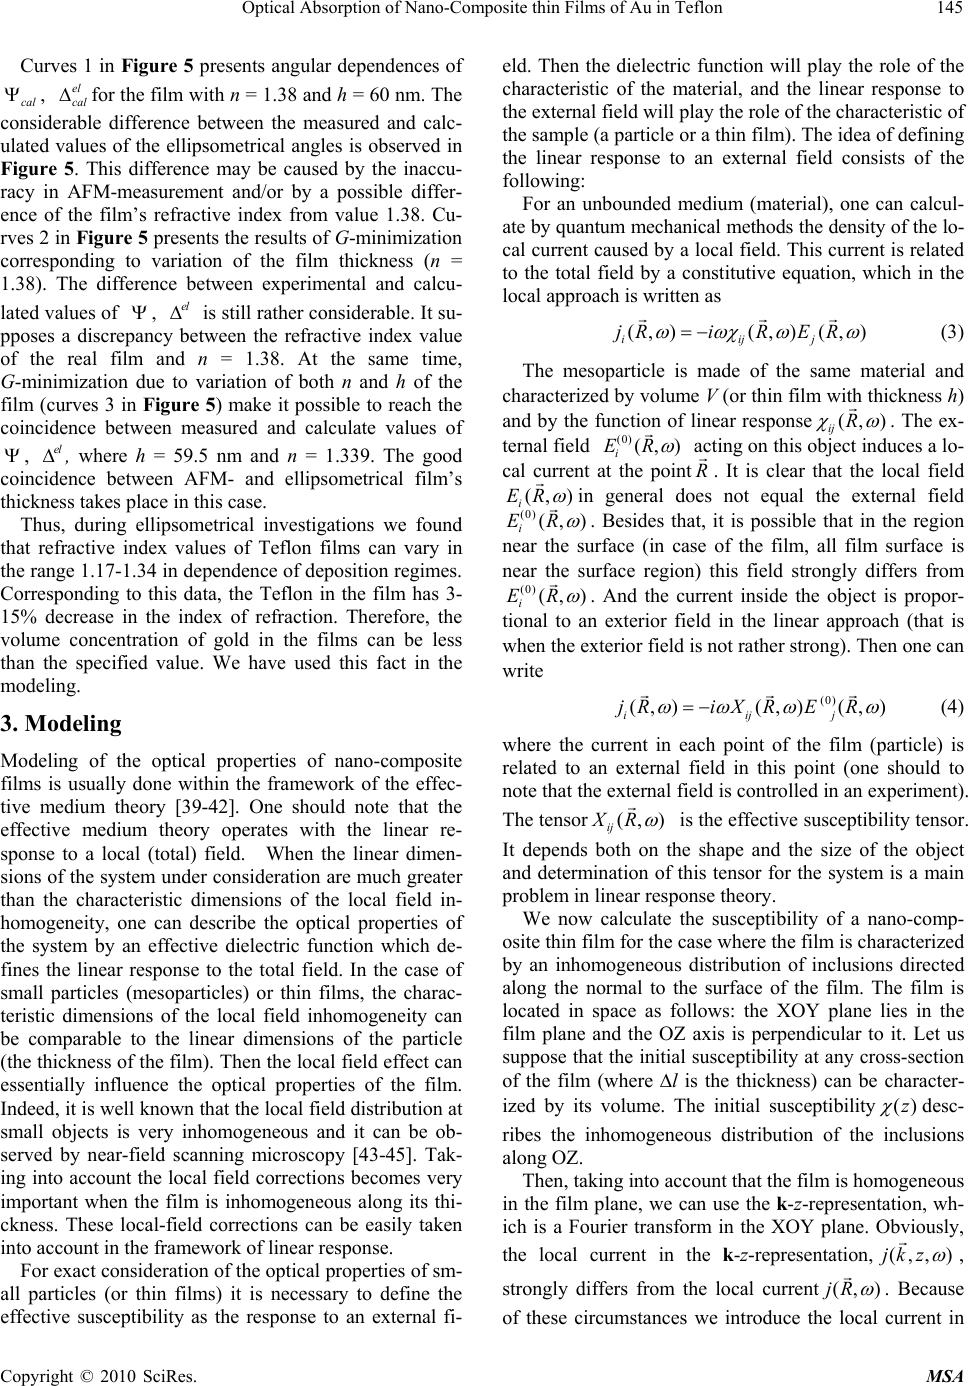 Optical Absorption of Nano-Composite thin Films of Au in Teflon145 Curves 1 in Figure 5 presents angular dependences of , for the film with n = 1.38 and h = 60 nm. The considerable difference between the measured and calc- ulated values of the ellipsometrical angles is observed in Figure 5. This difference may be caused by the inaccu- racy in AFM-measurement and/or by a possible differ- ence of the film’s refractive index from value 1.38. Cu- rves 2 in Figure 5 presents the results of G-minimization corresponding to variation of the film thickness (n = 1.38). The difference between experimental and calcu- lated values of , is still rather considerable. It su- pposes a discrepancy between the refractive index value of the real film and n = 1.38. At the same time, G-minimization due to variation of both n and h of the film (curves 3 in Figure 5) make it possible to reach the coincidence between measured and calculate values of , , where h = 59.5 nm and n = 1.339. The good coincidence between AFM- and ellipsometrical film’s thickness takes place in this case. cal el cal el el Thus, during ellipsometrical investigations we found that refractive index values of Teflon films can vary in the range 1.17-1.34 in dependence of deposition regimes. Corresponding to this data, the Teflon in the film has 3- 15% decrease in the index of refraction. Therefore, the volume concentration of gold in the films can be less than the specified value. We have used this fact in the modeling. 3. Modeling Modeling of the optical properties of nano-composite films is usually done within the framework of the effec- tive medium theory [39-42]. One should note that the effective medium theory operates with the linear re- sponse to a local (total) field. When the linear dimen- sions of the system under consideration are much greater than the characteristic dimensions of the local field in- homogeneity, one can describe the optical properties of the system by an effective dielectric function which de- fines the linear response to the total field. In the case of small particles (mesoparticles) or thin films, the charac- teristic dimensions of the local field inhomogeneity can be comparable to the linear dimensions of the particle (the thickness of the film). Then the local field effect can essentially influence the optical properties of the film. Indeed, it is well known that the local field distribution at small objects is very inhomogeneous and it can be ob- served by near-field scanning microscopy [43-45]. Tak- ing into account the local field corrections becomes very important when the film is inhomogeneous along its thi- ckness. These local-field corrections can be easily taken into account in the framework of linear response. For exact consideration of the optical properties of sm- all particles (or thin films) it is necessary to define the effective susceptibility as the response to an external fi- eld. Then the dielectric function will play the role of the characteristic of the material, and the linear response to the external field will play the role of the characteristic of the sample (a particle or a thin film). The idea of defining the linear response to an external field consists of the following: For an unbounded medium (material), one can calcul- ate by quantum mechanical methods the density of the lo- cal current caused by a local field. This current is related to the total field by a constitutive equation, which in the local approach is written as (, )(, )(, ) iijj jRiRE R (3) The mesoparticle is made of the same material and characterized by volume V (or thin film with thickness h) and by the function of linear response(, ) ij R . The ex- ternal field (0) (, ) i ER acting on this object induces a lo- cal current at the pointR . It is clear that the local field (, ) i ER in general does not equal the external field (0) (, i ER) . Besides that, it is possible that in the region near the surface (in case of the film, all film surface is near the surface region) this field strongly differs from (0) (, i ER) . And the current inside the object is propor- tional to an exterior field in the linear approach (that is when the exterior field is not rather strong). Then one can write (0) (, )(,)(, ) iijj jRiX RER (4) where the current in each point of the film (particle) is related to an external field in this point (one should to note that the external field is controlled in an experiment). The tensor(, ) ij XR is the effective susceptibility tensor. It depends both on the shape and the size of the object and determination of this tensor for the system is a main problem in linear response theory. We now calculate the susceptibility of a nano-comp- osite thin film for the case where the film is characterized by an inhomogeneous distribution of inclusions directed along the normal to the surface of the film. The film is located in space as follows: the XOY plane lies in the film plane and the OZ axis is perpendicular to it. Let us suppose that the initial susceptibility at any cross-section of the film (where l is the thickness) can be character- ized by its volume. The initial susceptibility() desc- ribes the inhomogeneous distribution of the inclusions along OZ. Then, taking into account that the film is homogeneous in the film plane, we can use the k-z-representation, wh- ich is a Fourier transform in the XOY plane. Obviously, the local current in the k-z-representation, (,, )jk z , strongly differs from the local current(,jR ) . Because of these circumstances we introduce the local current in Copyright © 2010 SciRes. MSA 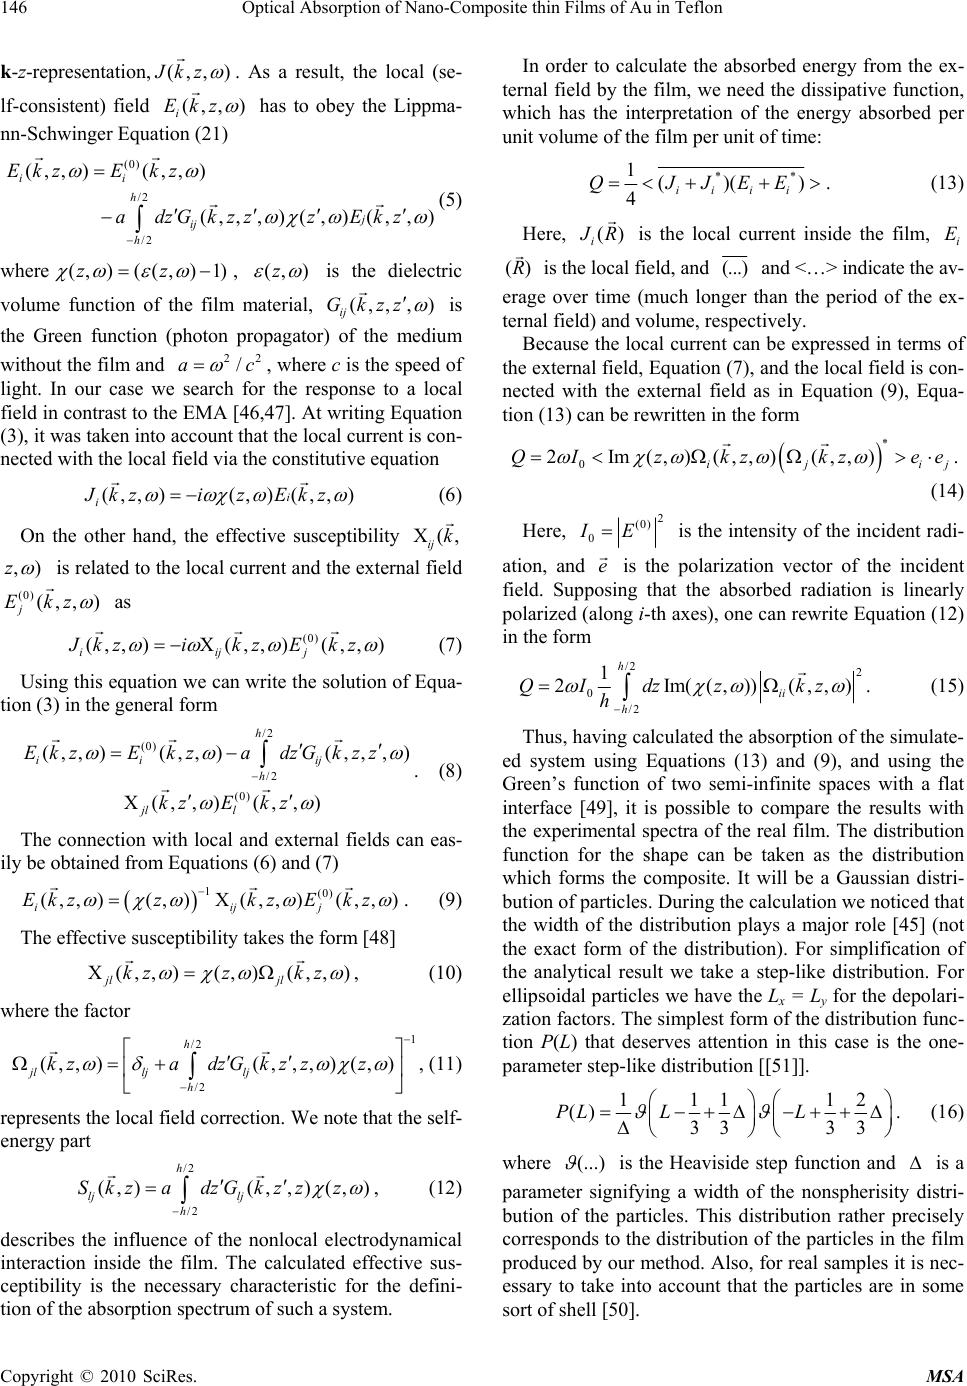 Optical Absorption of Nano-Composite thin Films of Au in Teflon 146 k-z-representation, (,, )Jkz (,, i Ekz . As a result, the local (se- lf-consistent) field ) /2 (,, ) ( ,, ij kz adzGk has to obey the Lippma- nn-Schwinger Equation (21) (0) /2 (,, ) ,)(,)(,,) ii h j h Ekz E zz Ekzz (,) 1)z (5) where(, )(z , (, )z is the dielectric volume function of the film material, (,, , ) ij Gkzz is the Green function (photon propagator) of the medium without the film and , where c is the speed of light. In our case we search for the response to a local field in contrast to the EMA [46,47]. At writing Equation (3), it was taken into account that the local current is con- nected with the local field via the constitutive equation 2 /a , )(i 2 c (,)(,, )i i Jkz Ekz,z (6) On the other hand, the effective susceptibility (, ij k ,)z is related to the local current and the external field (0) j Ek(,, )z as (0) (,,),) (,,) jj JkzzEkz( ii i,k (0) (0 (,, ) ( ,,) l kz kz E (7) Using this equation we can write the solution of Equa- tion (3) in the general form /2 /2 (,, )(,, , ) (,,) h ii ij h jl EkzEdzG kzz kz ) a j ( 1 (, )z . (8) The connection with local and external fields can eas- ily be obtained from Equations (6) and (7) (0) (,, ),, )(,, ) iij EkzkzE kz ) (,z . (9) The effective susceptibility takes the form [48] (,,)(,, ) jl jl kz kz /2 /2 h h a dz , (10) where the factor 1 (,, )(, ,, )(, ) jl lj kzkz zz lj G /2 /2 h lj h a dzG , (11) represents the local field correction. We note that the self- energy part (,)(,,) (,) lj Skzkzz z , (12) describes the influence of the nonlocal electrodynamical interaction inside the film. The calculated effective sus- ceptibility is the necessary characteristic for the defini- tion of the absorption spectrum of such a system. In order to calculate the absorbed energy from the ex- ternal field by the film, we need the dissipative function, which has the interpretation of the energy absorbed per unit volume of the film per unit of time: ** 1()( ) 4iii i QJJEE . (13) Here, () i R is the local current inside the film, i E ()R is the local field, and (...) and <…> indicate the av- erage over time (much longer than the period of the ex- ternal field) and volume, respectively. Because the local current can be expressed in terms of the external field, Equation (7), and the local field is con- nected with the external field as in Equation (9), Equa- tion (13) can be rewritten in the form * 0 2Im(,)(,,)(,,) ij QIz kzkze ij e . (14) Here, 2 (0) 0 IE is the intensity of the incident radi- ation, and e is the polarization vector of the incident field. Supposing that the absorbed radiation is linearly polarized (along i-th axes), one can rewrite Equation (12) in the form /2 2 0 /2 1 2Im((,))(, h ii h QIdz zkz h,) . (15) Thus, having calculated the absorption of the simulate- ed system using Equations (13) and (9), and using the Green’s function of two semi-infinite spaces with a flat interface [49], it is possible to compare the results with the experimental spectra of the real film. The distribution function for the shape can be taken as the distribution which forms the composite. It will be a Gaussian distri- bution of particles. During the calculation we noticed that the width of the distribution plays a major role [45] (not the exact form of the distribution). For simplification of the analytical result we take a step-like distribution. For ellipsoidal particles we have the Lx = Ly for the depolari- zation factors. The simplest form of the distribution func- tion P(L) that deserves attention in this case is the one- parameter step-like distribution [[51]]. 111 12 () 33 33 PL LL . (16) where (...) is the Heaviside step function and is a parameter signifying a width of the nonspherisity distri- bution of the particles. This distribution rather precisely corresponds to the distribution of the particles in the film produced by our method. Also, for real samples it is nec- essary to take into account that the particles are in some sort of shell [50]. Copyright © 2010 SciRes. MSA 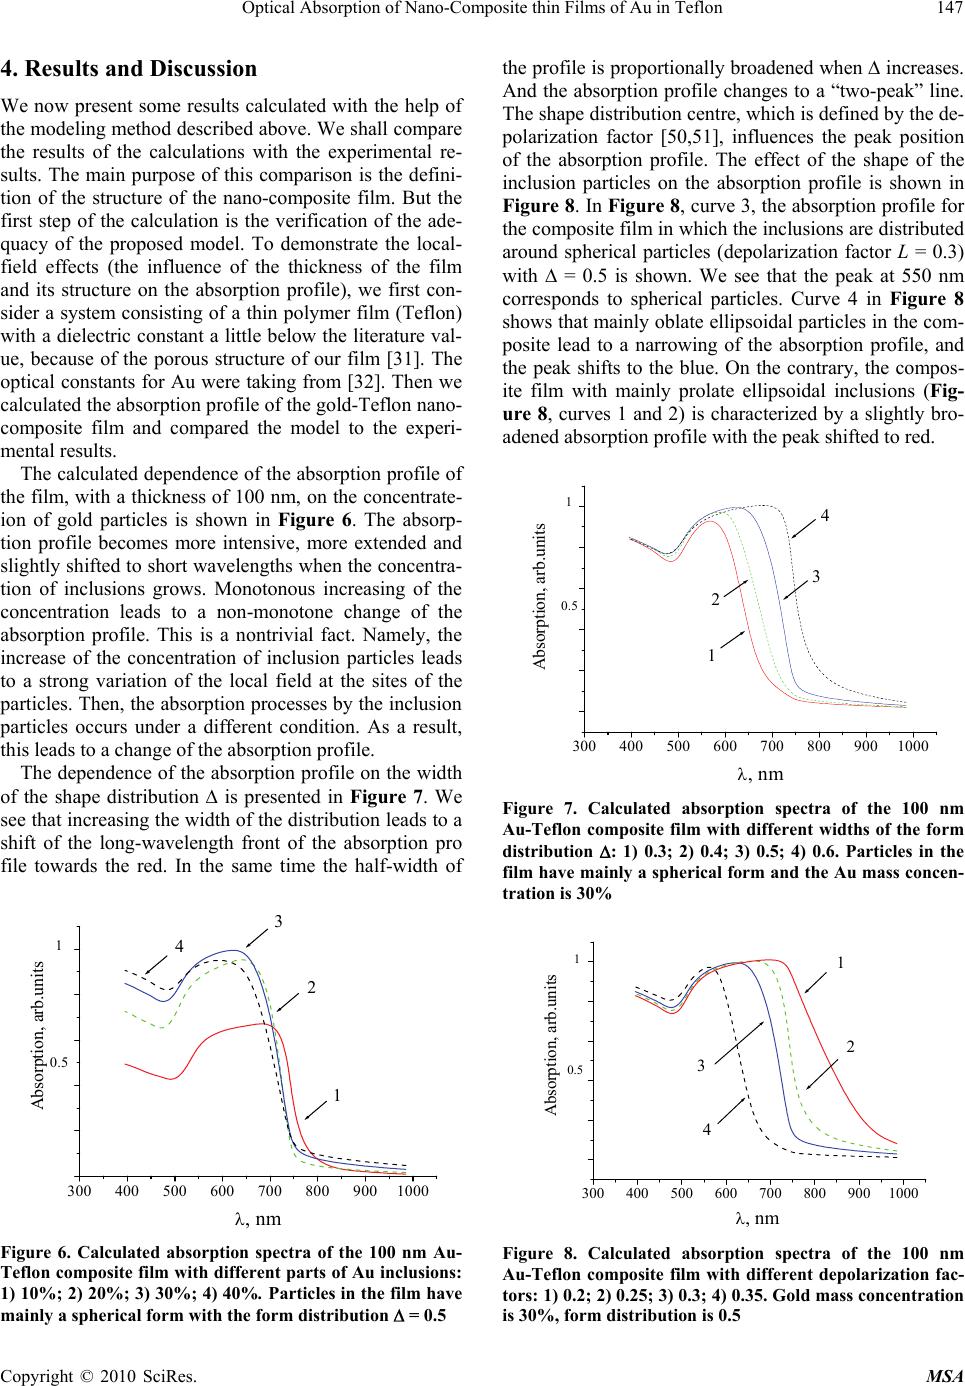 Optical Absorption of Nano-Composite thin Films of Au in Teflon147 4. Results and Discussion We now present some results calculated with the help of the modeling method described above. We shall compare the results of the calculations with the experimental re- sults. The main purpose of this comparison is the defini- tion of the structure of the nano-composite film. But the first step of the calculation is the verification of the ade- quacy of the proposed model. To demonstrate the local- field effects (the influence of the thickness of the film and its structure on the absorption profile), we first con- sider a system consisting of a thin polymer film (Teflon) with a dielectric constant a little below the literature val- ue, because of the porous structure of our film [31]. The optical constants for Au were taking from [32]. Then we calculated the absorption profile of the gold-Teflon nano- composite film and compared the model to the experi- mental results. The calculated dependence of the absorption profile of the film, with a thickness of 100 nm, on the concentrate- ion of gold particles is shown in Figure 6. The absorp- tion profile becomes more intensive, more extended and slightly shifted to short wavelengths when the concentra- tion of inclusions grows. Monotonous increasing of the concentration leads to a non-monotone change of the absorption profile. This is a nontrivial fact. Namely, the increase of the concentration of inclusion particles leads to a strong variation of the local field at the sites of the particles. Then, the absorption processes by the inclusion particles occurs under a different condition. As a result, this leads to a change of the absorption profile. The dependence of the absorption profile on the width of the shape distribution is presented in Figure 7. We see that increasing the width of the distribution leads to a shift of the long-wavelength front of the absorption pro file towards the red. In the same time the half-width of 300 400500 600 700800 9001000 4 3 2 1 Absorption, arb.units 0.5 1 , nm Figure 6. Calculated absorption spectra of the 100 nm Au- Teflon composite film with different parts of Au inclusions: 1) 10%; 2) 20%; 3) 30%; 4) 40%. Particles in the film have mainly a spherical form with the form distribution = 0.5 the profile is proportionally broadened when increases. And the absorption profile changes to a “two-peak” line. The shape distribution centre, which is defined by the de- polarization factor [50,51], influences the peak position of the absorption profile. The effect of the shape of the inclusion particles on the absorption profile is shown in Figure 8. In Figure 8, curve 3, the absorption profile for the composite film in which the inclusions are distributed around spherical particles (depolarization factor L = 0.3) with = 0.5 is shown. We see that the peak at 550 nm corresponds to spherical particles. Curve 4 in Figure 8 shows that mainly oblate ellipsoidal particles in the com- posite lead to a narrowing of the absorption profile, and the peak shifts to the blue. On the contrary, the compos- ite film with mainly prolate ellipsoidal inclusions (Fig- ure 8, curves 1 and 2) is characterized by a slightly bro- adened absorption profile with the peak shifted to red. 300 400 500 600 700 800 9001000 4 3 2 1 0.5 1 Absorption, arb.units , nm Figure 7. Calculated absorption spectra of the 100 nm Au-Teflon composite film with different widths of the form distribution : 1) 0.3; 2) 0.4; 3) 0.5; 4) 0.6. Particles in the film have mainly a spherical form and the Au mass concen- tration is 30% 300400500600700800 9001000 4 3 2 1 Absorption, arb.units 0.5 1 , nm Figure 8. Calculated absorption spectra of the 100 nm Au-Teflon composite film with different depolarization fac- tors: 1) 0.2; 2) 0.25; 3) 0.3; 4) 0.35. Gold mass concentration is 30%, form distribution is 0.5 Copyright © 2010 SciRes. MSA 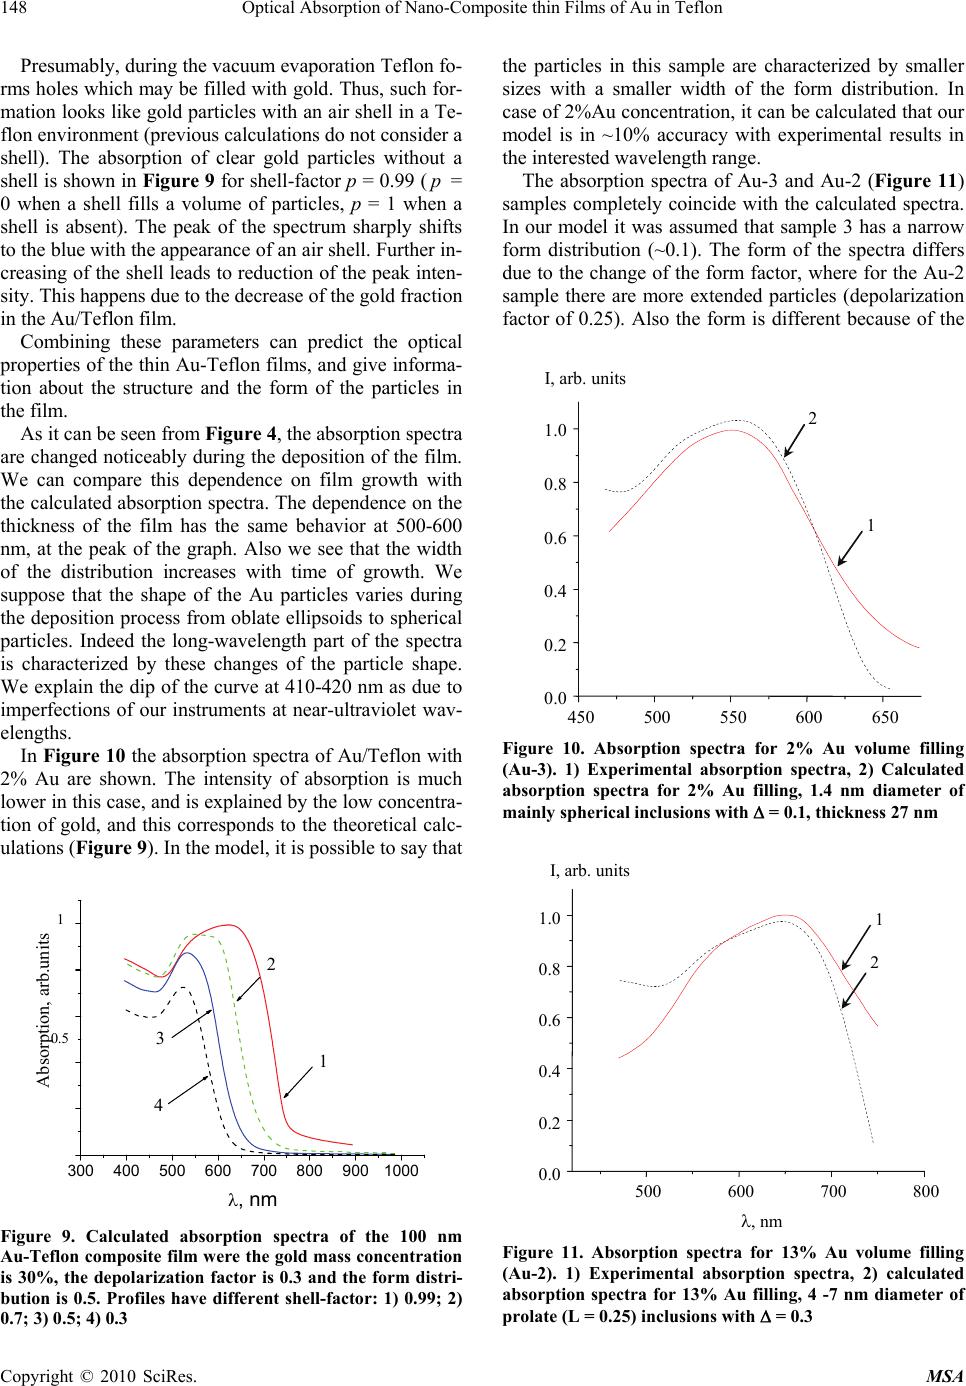 Optical Absorption of Nano-Composite thin Films of Au in Teflon 148 Presumably, during the vacuum evaporation Teflon fo- rms holes which may be filled with gold. Thus, such for- mation looks like gold particles with an air shell in a Te- flon environment (previous calculations do not consider a shell). The absorption of clear gold particles without a shell is shown in Figure 9 for shell-factor p = 0.99 (p = 0 when a shell fills a volume of particles, p = 1 when a shell is absent). The peak of the spectrum sharply shifts to the blue with the appearance of an air shell. Further in- creasing of the shell leads to reduction of the peak inten- sity. This happens due to the decrease of the gold fraction in the Au/Teflon film. Combining these parameters can predict the optical properties of the thin Au-Teflon films, and give informa- tion about the structure and the form of the particles in the film. As it can be seen from Figure 4, the absorption spectra are changed noticeably during the deposition of the film. We can compare this dependence on film growth with the calculated absorption spectra. The dependence on the thickness of the film has the same behavior at 500-600 nm, at the peak of the graph. Also we see that the width of the distribution increases with time of growth. We suppose that the shape of the Au particles varies during the deposition process from oblate ellipsoids to spherical particles. Indeed the long-wavelength part of the spectra is characterized by these changes of the particle shape. We explain the dip of the curve at 410-420 nm as due to imperfections of our instruments at near-ultraviolet wav- elengths. In Figure 10 the absorption spectra of Au/Teflon with 2% Au are shown. The intensity of absorption is much lower in this case, and is explained by the low concentra- tion of gold, and this corresponds to the theoretical calc- ulations (Figure 9). In the model, it is possible to say that 300 400 500 600 700 800 9001000 4 3 2 1 Absorption, arb.units 0.5 1 , nm Figure 9. Calculated absorption spectra of the 100 nm Au-Teflon composite film were the gold mass concentration is 30%, the depolarization factor is 0.3 and the form distri- bution is 0.5. Profiles have different shell-factor: 1) 0.99; 2) 0.7; 3) 0.5; 4) 0.3 the particles in this sample are characterized by smaller sizes with a smaller width of the form distribution. In case of 2%Au concentration, it can be calculated that our model is in ~10% accuracy with experimental results in the interested wavelength range. The absorption spectra of Au-3 and Au-2 (Figure 11) samples completely coincide with the calculated spectra. In our model it was assumed that sample 3 has a narrow form distribution (~0.1). The form of the spectra differs due to the change of the form factor, where for the Au-2 sample there are more extended particles (depolarization factor of 0.25). Also the form is different because of the І, arb. units 2 1 450 500 550 600 650 0.0 0.2 0.4 0.6 0.8 1.0 Figure 10. Absorption spectra for 2% Au volume filling (Au-3). 1) Experimental absorption spectra, 2) Calculated absorption spectra for 2% Au filling, 1.4 nm diameter of mainly spherical inclusions with = 0.1, thickness 27 nm n І, arb. units 2 1 500 600 700 800 0.0 0.2 0.4 0.6 0.8 1.0 Figure 11. Absorption spectra for 13% Au volume filling (Au-2). 1) Experimental absorption spectra, 2) calculated absorption spectra for 13% Au filling, 4 -7 nm diameter of prolate (L = 0.25) inclusions with = 0.3 Copyright © 2010 SciRes. MSA 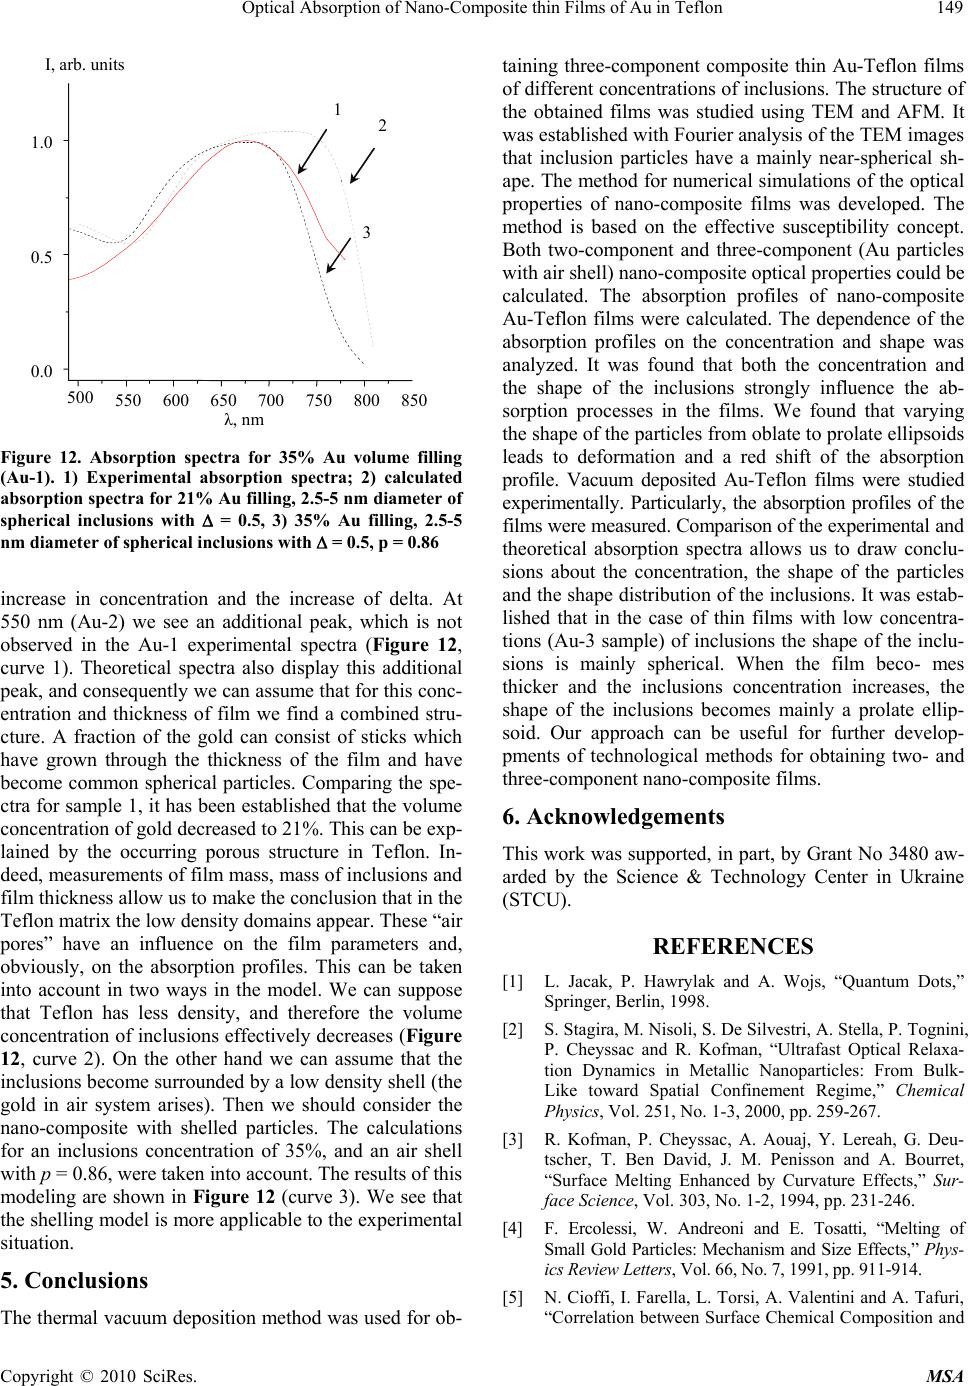 Optical Absorption of Nano-Composite thin Films of Au in Teflon149 2 1 3 І, arb. units λ, nm 500 550 600 650 700 750 800 850 0.0 0.5 1.0 Figure 12. Absorption spectra for 35% Au volume filling (Au-1). 1) Experimental absorption spectra; 2) calculated absorption spectra for 21% Au filling, 2.5-5 nm diameter of spherical inclusions with = 0.5, 3) 35% Au filling, 2.5-5 nm diameter of spherical inclusions with = 0.5, p = 0.86 increase in concentration and the increase of delta. At 550 nm (Au-2) we see an additional peak, which is not observed in the Au-1 experimental spectra (Figure 12, curve 1). Theoretical spectra also display this additional peak, and consequently we can assume that for this conc- entration and thickness of film we find a combined stru- cture. A fraction of the gold can consist of sticks which have grown through the thickness of the film and have become common spherical particles. Comparing the spe- ctra for sample 1, it has been established that the volume concentration of gold decreased to 21%. This can be exp- lained by the occurring porous structure in Teflon. In- deed, measurements of film mass, mass of inclusions and film thickness allow us to make the conclusion that in the Teflon matrix the low density domains appear. These “air pores” have an influence on the film parameters and, obviously, on the absorption profiles. This can be taken into account in two ways in the model. We can suppose that Teflon has less density, and therefore the volume concentration of inclusions effectively decreases (Figure 12, curve 2). On the other hand we can assume that the inclusions become surrounded by a low density shell (the gold in air system arises). Then we should consider the nano-composite with shelled particles. The calculations for an inclusions concentration of 35%, and an air shell with p = 0.86, were taken into account. The results of this modeling are shown in Figure 12 (curve 3). We see that the shelling model is more applicable to the experimental situation. 5. Conclusions The thermal vacuum deposition method was used for ob- taining three-component composite thin Au-Teflon films of different concentrations of inclusions. The structure of the obtained films was studied using TEM and AFM. It was established with Fourier analysis of the TEM images that inclusion particles have a mainly near-spherical sh- ape. The method for numerical simulations of the optical properties of nano-composite films was developed. The method is based on the effective susceptibility concept. Both two-component and three-component (Au particles with air shell) nano-composite optical properties could be calculated. The absorption profiles of nano-composite Au-Teflon films were calculated. The dependence of the absorption profiles on the concentration and shape was analyzed. It was found that both the concentration and the shape of the inclusions strongly influence the ab- sorption processes in the films. We found that varying the shape of the particles from oblate to prolate ellipsoids leads to deformation and a red shift of the absorption profile. Vacuum deposited Au-Teflon films were studied experimentally. Particularly, the absorption profiles of the films were measured. Comparison of the experimental and theoretical absorption spectra allows us to draw conclu- sions about the concentration, the shape of the particles and the shape distribution of the inclusions. It was estab- lished that in the case of thin films with low concentra- tions (Au-3 sample) of inclusions the shape of the inclu- sions is mainly spherical. When the film beco- mes thicker and the inclusions concentration increases, the shape of the inclusions becomes mainly a prolate ellip- soid. Our approach can be useful for further develop- pments of technological methods for obtaining two- and three-component nano-composite films. 6. Acknowledgements This work was supported, in part, by Grant No 3480 aw- arded by the Science & Technology Center in Ukraine (STCU). REFERENCES [1] L. Jacak, P. Hawrylak and A. Wojs, “Quantum Dots,” Springer, Berlin, 1998. [2] S. Stagira, M. Nisoli, S. De Silvestri, A. Stella, P. Tognini, P. Cheyssac and R. Kofman, “Ultrafast Optical Relaxa- tion Dynamics in Metallic Nanoparticles: From Bulk- Like toward Spatial Confinement Regime,” Chemical Physics, Vol. 251, No. 1-3, 2000, pp. 259-267. [3] R. Kofman, P. Cheyssac, A. Aouaj, Y. Lereah, G. Deu- tscher, T. Ben David, J. M. Penisson and A. Bourret, “Surface Melting Enhanced by Curvature Effects,” Sur- face Science, Vol. 303, No. 1-2, 1994, pp. 231-246. [4] F. Ercolessi, W. Andreoni and E. Tosatti, “Melting of Small Gold Particles: Mechanism and Size Effects,” Phys- ics Review Letters, Vol. 66, No. 7, 1991, pp. 911-914. [5] N. Cioffi, I. Farella, L. Torsi, A. Valentini and A. Tafuri, “Correlation between Surface Chemical Composition and Copyright © 2010 SciRes. MSA  Optical Absorption of Nano-Composite thin Films of Au in Teflon 150 Vapor Sensing Properties of Gold-Fluorocarbon Nano- composites,” Sensors and Actuators B, Vol. 84, No. 1, 2002, pp. 49-54. [6] A. V. Goncharenko, D. O. Grynko, K. P. Grytsenko and V. Z. Lozovski, “Preparation and Optical Properties of Au/Teflon Nanocomposites,” Journal of Nanoscience and Nanotechnology, Vol. 5, No. 11, 2005, pp. 1919-1924. [7] J. H. Holts and S. A. Asher, “Polymerized Colloidal Crystal Hydrogel Films as Intelligent Chemical Sensing Materials,” Nature, Vol. 389, 1997, pp. 829-832. [8] A. D’Addabbo, A. Valentini and A. Convertin, “Swelling of CFx and CFx(Au) Films,” Journal of Applied Physics, Vol. 87, No. 1, 2000, pp. 2039-2043. [9] A. Convertino, A. Capobianchi, A. Valentini and E. N. Cirillo, “A New Approach to Organic Solvent Detection: High-Reflectivity Bragg Reflectors Based on a Gold Nanoparticle/Teflon-like Composite Material,” Advanced Materials, Vol. 15, No. 13, 2000, pp. 1103-1105. [10] S. I. Bozhevolnyi, V. S. Volkov and K. Leosson, “Local- ization and Waveguiding of Surface Plasmon Polaritons in Random Nanostructures,” Physics Review Letters, Vol. 89, No. 18, 2002, pp. 186801-186805. [11] I. V. Barca, A. P. Brown, M. P. Andrews, T. Galstian, et al., “Linear and Nonlinear Optical Response of Dye Anchored to Gold Nanoparticles,” Canadian Journal of Chemistry, Vol. 80, 2002, pp. 1625-1633. [12] K. G. Thomas and P. Kamat, “Chromophore-Functionalized Gold Nanoparticles,” Accounts of Chemical Research, Vol. 36, No. 12, 2003, pp. 888-898. [13] Y. P. Bao, M. Huber, T.-F. Wei, S. S. Marla, J. J. Storhoff and U. R. Müller, “SNP Identification in Unamplified Human Genomic DNA with Gold Nanoparticle Probes,” Nucleic Acids Research, Vol. 33, No. 2, 2005, p. e15. [14] H. Hakkinen, S. Abbet, A. Sanchez, U. Heiz and U. Landmanet, “Structural, Electronic, and Impurity-Doping Effects in Nanoscale Chemistry: Supported Gold Nano- clusters,” Angewandte Chemie International Edition, Vol. 42, No. 11, 2003, pp. 1297-1300. [15] A. Biswas, O. C. Aktas, J. Kanzow, U. Saeed, T. Strunsk- us, V. Zaporojtchenko and F. Faupel, “Polymer-Metal Optical Nanocomposites with Tunable Particle Plasmon Resonance Prepared by Vapor Phase Co-Deposition,” Materials Letters, Vol. 58, No. 9, 2004, pp. 1530-1534. [16] U. Schurmann, W. Hartung, H. Takele, V. Zaporojtchenko and F. Faupel, “Controlled Syntheses of Ag-Polytetrafluo- roethylene Nanocomposite Thin Films by Co-Sputtering from Two Magnetron Sources,” Nanotec hnol ogy, Vol. 16, No. 8, 2005, p. 1078. [17] A. Kiesow, J. E. Morris, C. Radehaus and A. Heilmann, “Switching Behavior of Plasma Polymer Films Contain- ing Silver Nanoparticles,” Journal of Applied Physics, Vol. 94, No. 10, 2003, pp. 6988-6991. [18] E. Dulkeith, T. Niedereichholz, T. A. Klar, J. Feldmann, G. von Plessen, D. I. Gittins, K. S. Mayya and F. Caruso, “Plasmon Emission in Photoexcited Gold Nanoparticles,” Physical Review B, Vol. 70, No. 20, 2004, pp. 205424- 205428. [19] Y. Yang, J. Huang, S. Liu and J. Shen, “Preparation, Char- acterization and Electroluminescence of Zns Nanocrystals in a Polymer Matrix,” Journal of Material Chemistry, Vol. 7, No. 1, 1997, pp. 131-133. [20] L. A. Baraban and V. Z. Lozovski, “Reflection and Ab- sorption of Light by a Thin Semiconductor Film,” Optics and Spectroscopy, Vol. 97, No. 5, 2004, pp. 810-816. [21] O. Keller, “Local Fields in the Electrodynamics of Meso- scopic Media,” Physics Reports, Vol. 85, No. 2-3, 1996, pp. 85-262. [22] J.-J. Griffet and R. Carminati, “Image Formation in Near-Field Optics,” Progress in Surface Science, Vol. 56, No. 3, 1997, pp. 133-237. [23] “Near Field Optics,” In: D. W. Pohl and D. Courjon, Eds., Kluwer, Dordrecht, 1993. [24] S. I. Bozhevolnyi, “Optics of Nanostructured Materials,” In: V. M. Markel and T. F. George, Eds., Wiley, New York, 2001. [25] C. Girard, C. Joachim, and S. Gauthier, “The Physics of the Near-Field,” Reports on Progress in Physics, Vol. 63, No. 6, 2000, pp. 893-938. [26] L. A. Cury, L. O. Ladeira and A. Righi, “Large Blue Shift in the Absorption Spectra of BEH-PPV Films Containing Gold Nanoparticles,” Synthetic Metals, Vol. 139, No. 2, 2003, pp. 283-286. [27] H. Song, O. J. Ilegbusi and L. I. Trakhtenberg, “Modeling vapor Deposition of Metal/Semiconductor-Polymer Nano- composite,” Thin Solid Films, Vol. 476, No. 1, 2005, pp. 190-195. [28] G. Carotenuto and L. Nicolais, “Synthesis and Characteri- zation of Gold-Based Nanoscopic Additives for Poly- mers,” Composites, Part B, Vol. 35, No. 5, 2004, pp. 385- 391. [29] D. Gritsenko, V. Grynko, V. Lozovski, J. Friedrich, R.-D. Schulze, J. Jurga, A. Convertino and A. Kotko, “Proper- ties of Au-Nano-Clusters in PTFE Film Prepared by Co-Evaporation in a Vacuum,” New Directions in Modi- fication and Application of Polymers, Wydanictwo Politechniki Poznanskiej, Poland, 2004. [30] C. K. O’Sullivan and G. G. Guilbault, “Commercial Quartz Crystal Microbalances―Theory and Applica- tions,” Biosensors and Bioelectronics, Vol. 14, No. 8-9, 1999, pp. 663-670. [31] J. C. Salamone, “Polymeric Materials Encyclopedia” CRC Press, New York, 1996. [32] P. B. Johnson and R. W. Christy, “Optical Constants of the Noble Metals,” Physical Review B, Vol. 6, No. 12, 1972, pp. 4370-4379. [33] H. Stark, “Applications of Optical Fourier Transforms,” Radio i Svyaz’, Moscow, 1988. [34] R. M. Azzam and N. M. Bashara, “Ellipsometry and Pol- arized Light, ” Holland Publishing, Amsterdam, 1977. [35] M. V. Sopinskyy, P. E. Shepelyavyi, A. V. Stronski and E. F. Venger, “Ellipsometry and AFM Study of Post- Depo- sition Transformations in Vacuum-Evaporated As-S-Se Films,” Journal of Optoelectronics and Advanced Mate- Copyright © 2010 SciRes. MSA  Optical Absorption of Nano-Composite thin Films of Au in Teflon Copyright © 2010 SciRes. MSA 151 rials, Vol. 7, No. 5, 2005, pp. 2255- 2266. [36] I. V. Lysy, O. I. Vlasenko, M. V. Sopinskyy, A. O. Gu- banova and T. A. Kryskov, “Ellipsometric Measurements of Refractive Index of Chalcogenide and Chalcogenide- Based Bulk Glassy Samples,” Moldavian Journal of the Physical Sciences, Vol. 6, No. 2-3, 2007, pp. 320-328. [37] J. A. Nelder and R. Mead, “A Simplex Method for Func- tion Minimization,” Computational Journal, Vol. 7, No. 2, 1965, pp. 308-313. [38] M. Pierno, C. S. Casari, R. Piazza and C. E. Bottani, “Structural Evolution of Crystalline Polymer Latex Films: Propagating and Confined Acoustic Modes,” Applied Physics Letter, Vol. 82, No. 10, 2003, pp. 1532-1535. [39] D. J. Bergman, “The Dielectric Constant of a Composite Material—A Problem in Classical Physics,” Physics Re- ports, Vol. 43, 1978, pp. 377-407. [40] D. J. Bergman and D. Stroud. “Physical Properties of Macroscopically Inhomogeneous Media,” Solid-State Physics, Vol. 46, 1992, pp. 147-269. [41] K. E. Peiponen, E. M. Varianen, J. J. Saarinen and M. O. A. Makinen, “The Dispersion Theory of Optically Linear and Nonlinear Bruggeman Liquids,” Optics Communica- tions, Vol. 205, No. 1-3, 2002, pp. 17-24. [42] E. F. Venger, A. V. Goncharenko and M. L. Dmitruk, “Optics of Small Particles and Disperse Media,” Naukova Dumka, Kyiv, 1999. [43] D. W. Pohl, “Scanning Near-Field Optical Microscopy,” In: C. J. R. Sheppard and T. Mulvey, Eds., Advances in Optical and Electron Microscopy, 12 Edition, Academic Press, London, 1990, p. 243. [44] G. Kaupp, “Atomic Force Microscopy, Scanning Nearfield Optical Microscopy and Nanoscratching: Application to Rough and Natural Surfaces,” Springer, Heidelberg, 2006. [45] V. Lozovski, Y. Nazarok and S. I. Bozhevolnyi, “Near- Field Imaging of Pyramid-Like Nanoparticles at a Sur- face,” Physica E, Vol. 11, No. 4, 2001, pp. 323-331. [46] V. Kochergin, V. Zaporojtchenko, H. Takele, F. Faupel, and H. Föll, “Improved Effective Medium Approach: Application to Metal Nanocomposites,” Journal of Ap- plied Physics, Vol. 101, No. 2, 2007, pp. 024302-024309. [47] D. Dalacu and L. Martinu, “Spectroellipsometric Charac- terization of Plasma-Deposited Au/Fluoropolymer Nano- composite Films,” Journal Vacuum Science and Tech- nology A, Vol. 17, No. 3, 1999, pp. 877-883. [48] L. Baraban and V. Lozovski, “Light Absorption by Thin Nano-Composite Films with Different Distributions of Inclusions along Film Thickness,” Semiconductor Physics, Quantum Electronics and Optoelectronics, Vol. 6, No. 3, 2009, pp. 667-672. [49] A. A. Maradudin and D. L. Mills, “Scattering and Ab- sorption of Electromagnetic Radiation by a Semi-Infinite Medium in the Presence of Surface Roughness,” Physical Review B, Vol. 11, No. 4, 1975, pp. 1392-1415. [50] A. V. Goncharenko, “Effective Dielectric Response of a Shape-Distributed Particle System,” Journal of Physics: Condensed Matter, Vol. 13, No. 35, 2001, pp. 8217-8225. [51] A. V. Goncharenko, “Generalizations of the Bruggeman Equation and a Concept of Shape-Distributed Particle Composites,” Physical Review E, Vol. 68, No. 4, 2003, pp. 041108-041121.
|