 Journal of Cancer Therapy, 2012, 3, 662-672 http://dx.doi.org/10.4236/jct.2012.325086 Published Online October 2012 (http://www.SciRP.org/journal/jct) 1 Meta-Analysis: 18F-FDG PET or PET/CT for the Evaluation of Neoadj uvant Chemotherapy in Locally Advanced Breast Cancer Yun Xi, Min Zhang, Rui Guo, Miao Zhang, Jiajia Hu, Biao Li* Department of Nuclear Medicine, Ruijin Hospital, Shanghai, China. Email: *lb10363@rjh.com.cn Received April 22nd, 2012; revised May 26th, 2012; accepted June 15th, 2012 ABSTRACT Purpose: To evaluate the accuracy and the predictive value of 18F-FDG PET or PET/CT in the assessment of neoadju- vant chemotherapy (NAC) in locally advanced breast cancer by meta-analysis. Materials and Methods: Relevant studies were identified by systematic searches of PUBMED and COCHRANE databases, published in English. To en- sure homogeneity of all included studies, selection criteria were established and all the studies were scored according to Quality Assessment of Diagnostic Accuracy Studies (QUADAS) criteria. Meta-analysis was done on the diagnostic performance data from eligible studies. Draw funnel plots to explore the publication bias. Draw forest plots to exclude abnormal data(s). Use Spearman correlation coefficients ρ, likelihood ratio χ2 test and I2 index in order to indicate het- erogeneity. Estimate and compare the weighted summary sensitivities (SEs), specificities (SPs), diagnostic odds ratios (DORs), and summary receiver operating characteristic (SROC) curves of PET and other examinations (measuring the size of tumor). Subgroup analyses were performed to identify heterogeneity potential sources. Do Z test to find signifi- cant difference between each results. Results: 27 groups of data in 19 eligible studies were included with a total of 1164 subjects evaluated by 18F-FDG PET or PET/CT and 291 ones evaluated by other examinations. Funnel plots showed the existence of publication bias. Spearman correlation coefficients ρ, likelihood ratio χ2 test and I2 index explored the het- erogeneity. The Results of the Weighted Summary: SEPET was significantly higher than SED [83.7% (329/393) vs. 59.0% (98/166), p < 0.001], SPPET was significantly higher than SPD [66.8% (512/766) vs. 40.8% (51/125), p < 0.001], DORPET was significantly higher than DORD (14.02 vs. 1.29, p < 0.05). The results show that FDG-PET was more ac- curate in assessment NAC efficiency. Draw SROC curves with Metadisc 14.0 and caculate results showed AUCPET and Q* PET were both significantly higher than AUCD and Q* D (AUCs 0.8838 vs. 0.6046; Q*s 0.8143 vs. 0.5788, p < 0.001), which confirmed the advantage of FDG-PET. Subgroup analysis showed that performing FDG-PET after the 1st or 2nd cycle of NAC was a litter better than later with higher SE (p = 0.083). Standardized uptake value (SUV) reduction rate between 40% and 45% as FDG-PET response threshold value was used for its highest SP (p = 0.01), while no signifi- cant difference was found comparing SEs and DORs (p > 0.05). Trend of higher SE and lower SP were found at ER negative breast cancers than ER positive ones (SEs 93.94% vs. 83.33%; SPs 35.76% vs. 62.24%), though Z test did not find significant difference (p > 0.05). Conclusion: This meta-analysis showed that FDG-PET or PET/CT does have a higher global accuracy in assessing the response for NAC in breast cancer. Comparing with clinical response, metabolic response plays a potential role in directing therapy for breast cancer. Factors which affected the accuracy of FDG-PET assessmnet included PET timing point, SUV reduction rate as threshold value and ER expression. Keywords: Breast Cancer; Fluorodeoxyglucose; Position Emission Tomography; Neoadjuvant Chemotherapy; Meta-Analysis 1. Introduction Breast carcinoma is the most common cancer in women in Western Europe and the United States with an inci- dence highest in the 40 - 55 age range, and its prevalence is still on the rise [1,2]. It accounts for 40,000 and 14,000 deaths yearly in the US and UK, respectively, and that makes it the second cause of cancer death in women in those countries [1,3]. Neoadjuvant chemotherapy (NAC), initially used only for locally advanced breast cancer, is now commonly used in patients with operable but large breast cancer. This strategy allows patients to undergo breast-conserv- *Corresponding author. Copyright © 2012 SciRes. JCT  Meta-Analysis: 18 F-FDG PET or PET/CT for the Evaluation of Neoadjuvant Chemotherapy in Locally Advanced Breast Cancer 663 ing surgery and gives information on the efficacy of chemotherapy [4]. Long-term outcomes are significantly correlated with pathological tumour response rates [5]. Patients who achieve pathological complete response (pCR) have longer disease-free and overall survival rates compared with nonresponder [5-7]. Therefore an inva- sive method for early evaluation of the response to NAC in patients with operable breast cancer is necessary. According to the recommendations of the American Society of Clinical Oncology (ASCO) 2006 update of the breast cancer follow-up and management guidelines in the adjuvant setting, physical examination and mam- mography should be used routinely in the breast cancer surveillance. Additional imaging methods, such as ultra- sound (US), computed tomography (CT) scans, breast magnetic resonance imaging (MRI) and positron emis- sion tomography (PET) with 18F-fluoro-deoxy-glucose (FDG) scans are not recommended [8]. But physical examination and mammography have their limitations, especially for evaluation of the changes in breast tissue. US, CT and MRI mainly provide information about the tumor size to assess the response to NAC, which is called clinical response. The whole-body imaging modality PET provides information about the metabolical activity of tumors to assess the response to NAC, which is called metabolical response. Previous studies [9-13] performed some meta-analysis to assess FDG-PET for the evalua- tion of breast cancer recurrences and metastases. Thus, Our study aims to perform a comprehensive systematic review to obtain the role of an early evaluation with FDG-PET of the response to NAC before surgery, and we also focus on the comparison between clinical re- sponse and metabolic response, which, to our knowledge, had not previously been studied. 2. Materials and Methods 2.1. Data Sources and Eligibility Published studies of NAC evaluation in breast cancer with FDG-PET or PET/CT were identified by systematic searches of PUBMED and COCHRANE databases. The following kewords were used: (“PET” OR “positron emission tomography” OR “FDG” OR “fluorodeoxyglu- cose”) AND (“breast carcinoma” OR “breast cancer” OR “carcinoma of breast”) AND (“neoadjuvant” OR “che- motherapy”). Articles were limited to the period between 1966 and 2012, and were performed with the assistance of JIAO TONG UNIVERSITY LIBRARIAN. The inclusion criteria were as follows: 1) full reports published in English; 2) articles dealt with the perform- ance of PET (alone or in combination, but not in se- quence); 3) use of 18F-FDG as imaging radiotracer; 4) pathological results as golden standard; 5) changes of semi-quantitative value were for evaluation criterion and set a threshold value to distinguish between metabolical responders and metabolical non-responders; 6) only arti- cles that present sufficient data to calculate the true posi- tive (TP), false positive (FP), false negative (FN), true negative (TN) values were included; 7) sample size was at least 10 subjects; 8) assess pre-chemotherapy and post- chemotherapy in locally advanced breast cancers. Since the validity of the individual studies may affect the interpretation of a diagnostic meta-analysis, Quality Assessment of Diagnostic Accuracy Studies (QUADAS) criteria [14] were adapted for assessment the quality of each article. Removing unsuitable items (question 3, 7, 9 were not suitable for our golden index standard—patho- logical test; question 12 was not suitable for reference test which set a threshold value for evaluation), there remained ten (all items were listed in Table 1). Each question should be answered as yes, no or unclear. All in- cluded studies were scored on all 10 items to provide an overall score. For the purpose of this analysis, “yes” was scored as “1”, while “no” and “unclear” were both scored as “0”. Articles with score upon “6” were eligible for analysis. Six reviewers, among who 3 had at least 3 years work experience in nuclear medicine, independently checked retrieved articles. In case of discordances, a consensus re-review between all reviewers was performed. 2.2. Data Synthesis and Statistical Analysis Data from individual studies were summarized in a 2 × 2 table classifying patients or lesions as TP, FN, FP and TN. If an article included several assessment time points, they were enrolled into study as different groups of data. If an article included upon two threshold values of semi- quantitative value decrease rate, select the highest accu- rate data. Test publication bias by drawing funnel plots. Forest plots were to find abnormal data to exclude. Test the fol- lowing items to find heterogeneity: threshold effects be- tween studies using Spearman correlation coefficients ρ (the cutoff effect was considered present in case of a ρ value > 0.4); heterogeneity using the likelihood ratio χ2 test (if p < 0.05 was considered having apparent hetero- geneity) and I2 index which is a measure of the percent- age of total variation across studies due to heterogeneity beyond chance and takes values between 0 and 100%. Its values over 50% indicate heterogeneity. If all tests con- firmed publication bias and heterogeneity, a random ef- fect model was used for the primary meta-analysis to obtain the weighted mean sensitivity (SE), specificity (SP) and diagnostic odds ratio (DOR) with 95% confi- dence intervals (CIs) of FDG-PET and other examina- tions. Otherwise, a fixed effect model was used. DOR is the best single global measure of diagnostic test per- Copyright © 2012 SciRes. JCT  Meta-Analysis: 18 F-FDG PET or PET/CT for the Evaluation of Neoadjuvant Chemotherapy in Locally Advanced Breast Cancer Copyright © 2012 SciRes. JCT 664 formance that encompasses both SE and SP. Golden standard was not pathological results (n = 4); 6) The changes of semi-quantitative value were not as evalu- ation criteria (n = 16); 7) Data were insufficient for cal- culating SE and SP (n = 9); 8) Sample size was under 10 (n = 5); 9) Studies not compared changes of values be- tween pre-therapy and post-therapy (n = 19). All of the 19 studies scored upon 6 according to QUADAS criteria. Table 1 pooled the results of the distribution of study design characteristics and Figure 1 summarizes the QUADAS criteria results of the 19 studies. The informa- tions of all included studies and the main characteristics of data for evaluation metabolical response and clinical response were listed in Tables 2-4. Because other ex- aminations assessed the effect of NAC by tumor size, we defined them as “D” for subscript. Asymmetric summary receiver operating characteristic (SROC) curves were fitted using weighted regression or inverse variance method (Moses’ model [15]), and their area under the curve (AUC) and Q* index calculated. AUC summarizes diagnostic performance as a single number, while Q* index is the point where SE and SP are equal. When statistical heterogeneity was identified, sub- group analysis was performed to identify its potential sources (e.g., different PET timing points, response crite- ria and molecular phenotype of primary breast cancer). Z test was employed to identify if significant difference existed between subgroups. Z test was employed to identify if significant differ- ence existed between two modalities of examinations and subgroups, including SE, SP, DOR, AUC and Q* index. If p < 0.05 was considered as statistically significant. All of the statistical analyses were undertaken using RevMan 5.1, STATA 11.0 and Meta-Disc14.0. 3. Results 3.1. Literature Search and Study Design Characteristics The computerized search yielded 202 primary studies, of which 106 were excluded after reading titles and ab- stracts because of the relationship far from our purpose. Among the left 96 articles, 19 met all of the criteria [16-34]. The reasons for exclusion were as follows: 1) Cannot obtain full articles (n = 4); 2) Articles were re- views, case reports or other non-treatises (n = 14); 3) The evaluation lesions were non-locally breast carcinomas (n = 5); 4) Radiotracer was other than FDG (n = 1); 5) The total proportion of quality score was 81.58%, which suggested high quality. Figure 1. Summarises the QUADAS criteria results of the 19 studies. Table 1. Results of the distribution of study design characteristics in 19 studies. Question about study design characteristic Yes No Unclear 1 Was the spectrum of patients representative of the patients who receive the test in practice? 8 9 2 2 Were selection criteria clearly described? 13 3 3 3 Is the reference standard likely to help to correctly classify the target condition? / / / 4 Is the time between performance of the reference standard and the index test short enough? 11 7 1 5 Did the whole sample or a random selection of the sample receive verification by using a reference standard? 19 0 0 6 Did patients undergo examination with the same reference standard regardless of the index test result? 18 0 1 7 Was the reference standard performed independently of the index test? / / / 8 Was the execution of the index test described in sufficient detail to permit replication of the test? 19 0 0 9 Was the execution of the reference standard described in sufficent detail to permit replication of the test? / / / 10 Were the index test results interpreted without knowledge of the reference standard results? 13 2 4 11 Were the reference standard results interpreted without knowledge of the index standard results? 18 0 1 12 Were the same clinical data available when test results were interpreted as would be available in practice / / / 13 Were uninterpretable and/or intermediate test results reported? 19 0 0 14 Were withdrawals from the study explained? 17 0 2 Data were the numbers of responses from the QUADAS tool. The numbers indicated how many articles were assigned a point of “Yes”, “No” or “Unclear”. Removed catalogue 3, 7, 9 because of insuitableness for our golden index test—pathological test and catalogue 12 of insuitableness for reference test which set a threshold value for evaluation.  Meta-Analysis: 18 F-FDG PET or PET/CT for the Evaluation of Neoadjuvant Chemotherapy in Locally Advanced Breast Cancer 665 Table 2. Main characteristics of all include d studie s. No Author Publication year Age (y) Pre-treatment size (cm) Stage NAC regimen Surgery time 1 Schelling M [16] 2000 41 - 60 3.5 - 12.0 II-III anthracycline-based/combination 3rd/4th cycle 2 Smith IC [17] 2000 unknown 1 - 8 II-III anthracycline-based >5th cycle 3 Kim SJ [18] 2004 27 - 68 1.5 - 7.5 II-III taxane-based/combination unknown 4 Rousseau C [19] 2006 32.8 - 75 1 - 10 II-III anthracycline-based/combination 6th cycle 5 Li D [20] 2007 34 - 65 2.1 - 9.5 II-IV anthracycline-based/combination 3rd cycle 6 Berriolo-Riedinger A [21] 2007 48 ± 9 unknown II-III anthracycline-based/taxane-base d/ combination 4th/6th cycle 7 McDermott GM [22] 2007 51 ± 10 >3 II-III anthracycline-based 6th/8th cycle 8 Duch J [23] 2009 32 - 82 >3 II-III anthracycline-based 4th cycle 9 Kumar A [24] 2009 25 - 60 4.1 - 12 II-III anthracycline-based 6th cycle 10 Schwarz-Dose J [25] 2009 29 - 65 3 - 12 II-III anthracycline + taxane 4th/6th cycle 11 Choi JH [26] 2010 24.1 - 63.1>4 II-III anthracycline-based/combination 3rd ~ 8th cycle 12 Jung SY [27] 2010 21 - 64 unknown II-III taxane-based 4th cycle 13 Ueda S [28] 2010 60 - 83 1.2 - 4.9 II-III letrozole 12th week 14 Schneider-Kolsky ME [29] 2010 30 - 70 >2 II-III anthracycline-based+taxane 8th cycle 15 Martoni AA [30] 2010 31 - 72 unknown II-IV anthracycline-based/taxane-base d 6th/8th cycle 16 Park JS [31] 2011 28 - 67 1.3 - 10 II-III taxane-based/combination 3th/6th cycle 17 Ueda S [32] 2011 55 ± 9.8 ≤2 II-IV anthracycline-based+taxane 8th cycle 18 Park SH [33] 2011 27 - 60 >2 II-III taxane-based/combination 3th/6th cycle 19 Keam B [34] 2011 29 - 69 2 - 11 II-III anthracycline/taxane 3th cycle NAC: neoadjuvant chemotherapy. 3.2. Publication Bias, Heterogeneity and Cutoff Effect After extraction informations of 19 articles, there in- cluded 27 groups of data for FDG-PET and 8 groups of data for other examinations. To assess a possible publi- cation bias, scatter plots were designed using the log- DORs of individual data against their sample size. The funnel plots of FDG-PET and other examinations were given in Figure 2. In detail, figure of FDG-PET showed nearly symmetry but one plot beyond 95% CIs. Figure of other examinations showed marked asymmetry with fewer studies above the horizontal line. There were 2 plots beyond 95%CIs. Analysing with the figures, we thought a possible publication bias in both FDG-PET and oher examinations. The forest plots of DORs (Figure 3) showed an abnormal value comparing others (other ex- aminations of study written by Park JS [31]). The proba- bly reason was that the study add a criterion of the en- hancement significancy on post-chemotherapy MRI scan. Therefore, other examination data of this study was ex- cluded. The heterogeneity test results were as follows: There was no heterogeneity for FDG-PET except the test of SP. There was heterogeneity for other examinations except the test of DOR, which confirmed either by like- lihood ratio χ2 test or I2 index (Table 5). There was no conclusive evidence of a cutoff effect for FDG-PET to Spearman correlation coefficients (p value = 0.269 < 0.4). But a cut off effect was present for other examinations (p value = 0.714 > 0.4). As stated previously, a random ef- fect model was used for analysing FDG-PET and other examinations. 3.3. Pooled SE, Pooled SP and Pooled DOR 27 eligible groups of date were included with a total of 1164 subjects evaluated by FDG-PET or PET/CT and 291 ones evaluated by other examinations. On the basis of a random effect model for analysing FDG-PET and other examinations, weighted summary SEs, SPs and Copyright © 2012 SciRes. JCT  Meta-Analysis: 18 F-FDG PET or PET/CT for the Evaluation of Neoadjuvant Chemotherapy in Locally Advanced Breast Cancer 666 Table 3. Characteristics of the include d data for evaluation metabolical response. No Equipment for evaluate metabolic response Second examination time Criteria Threshold Number of patients/lesions 1 PET 1st cycle SUVmax 55% 16 1 PET 2nd cycle SUVmax 55% 22 2 PET 1st cycle DUR 20% 29 3 PET Unknown SUVp 88% 25 4 PET/CT 1st cycle SUVmax 40% 63 4 PET/CT 2nd cycle SUVmax 40% 63 4 PET/CT 3rd cycle SUVmax 45% 63 5 PET/CT 3rd cycle SUV T/N 20% 45 6 PET 2nd cycle SUVmax 60% 47 7 PET 1st cycle SUVmax 64% 24 7 PET 3rd/4th cycle SUVmax 64% 13 7 PET 6th/8th cycle SUVmax 64% 20 8 PET/CT 2nd cycle SUVmax 40% 50 9 PET/CT 2nd cycle SUVmax 50% 23 10 PET 1st cycle SUVmax 50% 69 10 PET 2nd cycle SUVmax 50% 64 11 PET 3rd - 8th cycle SUVp 50% 41 12 PET 4th cycle SUVp 35.50% 66 13 PET/CT 4th week SUVmax 40% 12 14 PET/CT 4th cycle SUVmax 75% 60 15 PET/CT 2nd cycle SUVmax 50% 34 15 PET/CT 4th cycle SUVmax 50% 34 15 PET/CT 6th/8th cycle SUVmax 50% 34 16 PET/CT 3rd/6th cycle SUVmax 50% 32 17 PET/CT 4th cycle SUVmax 72.10% 98 18 PET/CT 3rd/6th cycle SUVmax 63.90% 34 19 PET/CT 1st cycle SUVmax 50% 78 SUV: standardized uptake value; SUVp: peak standardized uptake value; SUVmax: maximum standardized uptake value; SUV T/N: standardized uptake value of tumor tissue compared with normal tissue; DUR: dose uptake ratio. Table 4. Characteristics of the included data for evaluation clinical response. No Equipment for evaluate metabolic response 2nd examination time Size threshold Number of patients/lesions 1 Mammo, US, MRI 4th/3rd cycle 50% 32 2 Palpation 1st cycle 50% 31 3 Majority with CT Unknown 50% 50 4 US 6th cycle 60% 63 4 Mammo 6th cycle 60% 63 9 Vernier calliper, CT 2nd cycle 50% 23 11 MRI 3rd - 8th cycle 30% 29 16 MRI 3rd/6th cycle 30% 32 Mammo: mammography; US: ultrasond; CT: computed tomography; MRI: magnetic resonance imaging. Copyright © 2012 SciRes. JCT  Meta-Analysis: 18 F-FDG PET or PET/CT for the Evaluation of Neoadjuvant Chemotherapy in Locally Advanced Breast Cancer 667 Figure 2. Funnel plot with pseudo 95% confidence limits. Figure 3. Forest plots of FDG-PET and other examinations. DORs of both modalities were shown in Table 5. Pooled SEs of PET and other examinations were 83.7% (329/ 393) and 59.0% (98/166), respectively. High statistical significant difference was found (p < 0.001). Pooled SPs of PET and other examinations were 66.8% (512/766) and 40.8% (51/125), respectively. High statistical significant difference was found (p < 0.001). Pooled DORs of PET and other examinations were 14.02 and 1.29, respectively. Statistical significant difference was found (p = 0.015 < 0.05). 3.4. SROC Curves, AUC and the Q* Index Summary receiver operating characteristic analysis was used to generally compare FDG-PET and other examina- tions (Figure 4). The AUCs of FDG-PET and other ex- aminations were 0.8838 ± 0.0190, 0.6046 ± 0.1003. AUCPET was significantly higher than AUCD (p < 0.001). The Q* index of FDG-PET and other examina- tions were 0.8143 ± 0.0194, 0.5788 ± 0.0764. Q* PET was significantly higher than Q* D (p < 0.001). 3.5. Subgroup Analysis for Primary Breast Cancer Response The heterogeneity of SP in FDG-PET among the 27 groups of data rationalized several subgroup analyses to identify its possible sources. It was noted that those stud- ies employed different regimen of FDG-PET, including the PET timing points and cutoff values of semi-quanti- tative value as metabolical response criteria. Influence of different molecular phenotypes to the accuracy of FDG- PET evaluation was also analysed. Table 5 Test for heterogeneity and threshold effect in the meta-analysis. SE SP DOR FDG-PET Pooled value 83.7%** 66.8%** 14.017* 95% CIs [78.6%, 86.3%] [63.3%, 70.1%] [9.713, 20.229] χ230.62 155.78 29.10 Likelihood ratio p0.243 0.000 0.243 I2% 15.1% 83.3% 15.1% Other examination Pooled value 59.0%** 40.8%** 1.288* 95%CIs [51.1%, 66.6%] [32.1%, 49.9%] [0.560, 2.965] χ245.00 27.72 11.06 Likelihood ratio p0.000 0.000 0.086 I2% 86.7% 78.4% 45.8% SE: sensitivity; SP: specificity; DOR: diagnostic odds ratio; 95%CIs: 95% confidential interval;* means statistical significant difference;**means high statistical significant difference. Copyright © 2012 SciRes. JCT  Meta-Analysis: 18 F-FDG PET or PET/CT for the Evaluation of Neoadjuvant Chemotherapy in Locally Advanced Breast Cancer 668 Figure 4. SROC curves of FDG-PET and other examina- tions. 3.5.1. Evaluation of PET Timing Points One study [28] used letrozole for NAC that chemother- apy cycle was not as unit to measure PET timing points. And one study [18] didn’t discribe time of the second FDG- PET after completion of NAC. The remaining 25 groups of data were divided into 2 subgroups: evaluation FDG-PET after 1 - 2 cycles of NAC (subgroup A) and after upon 3 cycles (subgroup B). Results were showed in Figure 5. Pooled SEs of subgroup A and subgroup B were 86.0% (175/218) and 93.3% (150/172), respectively. Low statistical significant difference was found (p = 0.083). Pooled SPs of FDG-PET and other examinations were 72.7% (252/366) and 62.1% (241/371), respectively. There was no statistical significant difference (p = 0.232). Pooled DORs of PET and other examinations were 32.67 and 24.19, respectively. There was no statistical signifi- cant difference, too (p = 0.447). 3.5.2. Cuto ff Value as PET Response Criteria Two studies [17,20] were excluded for not using SUVmax or SUVp as FDG-PET response criteria. And groups that using under 40% or upon 70% for threshold value were too few to consolidate, which were also excluded. Then 22 groups of data were divided into subgroup I (cutoff value 40% - 45%), subgroup II (cutoff value 50% - 55%) and subgroup III (cutoff value 60% - 65%). Results were showed in Figure 6. Z test was employed which explored high significant difference between subgroup I and sub- group II comparing SPs (p = 0.01). 3.5.3. Influence of Different Molecular Phenotypes Of all 19 studies, 4 consisted correlation bewteen SU- Vmax and estrogen receptor [ER] expression. Data were showed in Table 6. At ER positive group, pathological response rate and metabolical response rate were 12.39% and 48.42%, respectively, at the same time reduction rate of SUV (△SUV%) was 45.00%; Pooled metabolical response accuracy, SE and SP were 83.33% and 62.24%, respectively. At ER negative group, pathological response rate and metabolical response rate were 49.05% and 80.26%, respectively, meanwhile △SUV% was 62.95%; pooled metabolical response accuracy, SE and SP were 93.94% and 35.76%, respectively. No significant differ- ence was found in all above-mentioned results (p > 0.05). Figure 5. Evaluation sensitivity and specifity with FDG- PET according to different PET timing. Figure 6. Evaluation sensitivity and specifity with FDG- PET according to different cutoff values of semi-quantita- tive reduction rate as PET response criteria. Copyright © 2012 SciRes. JCT 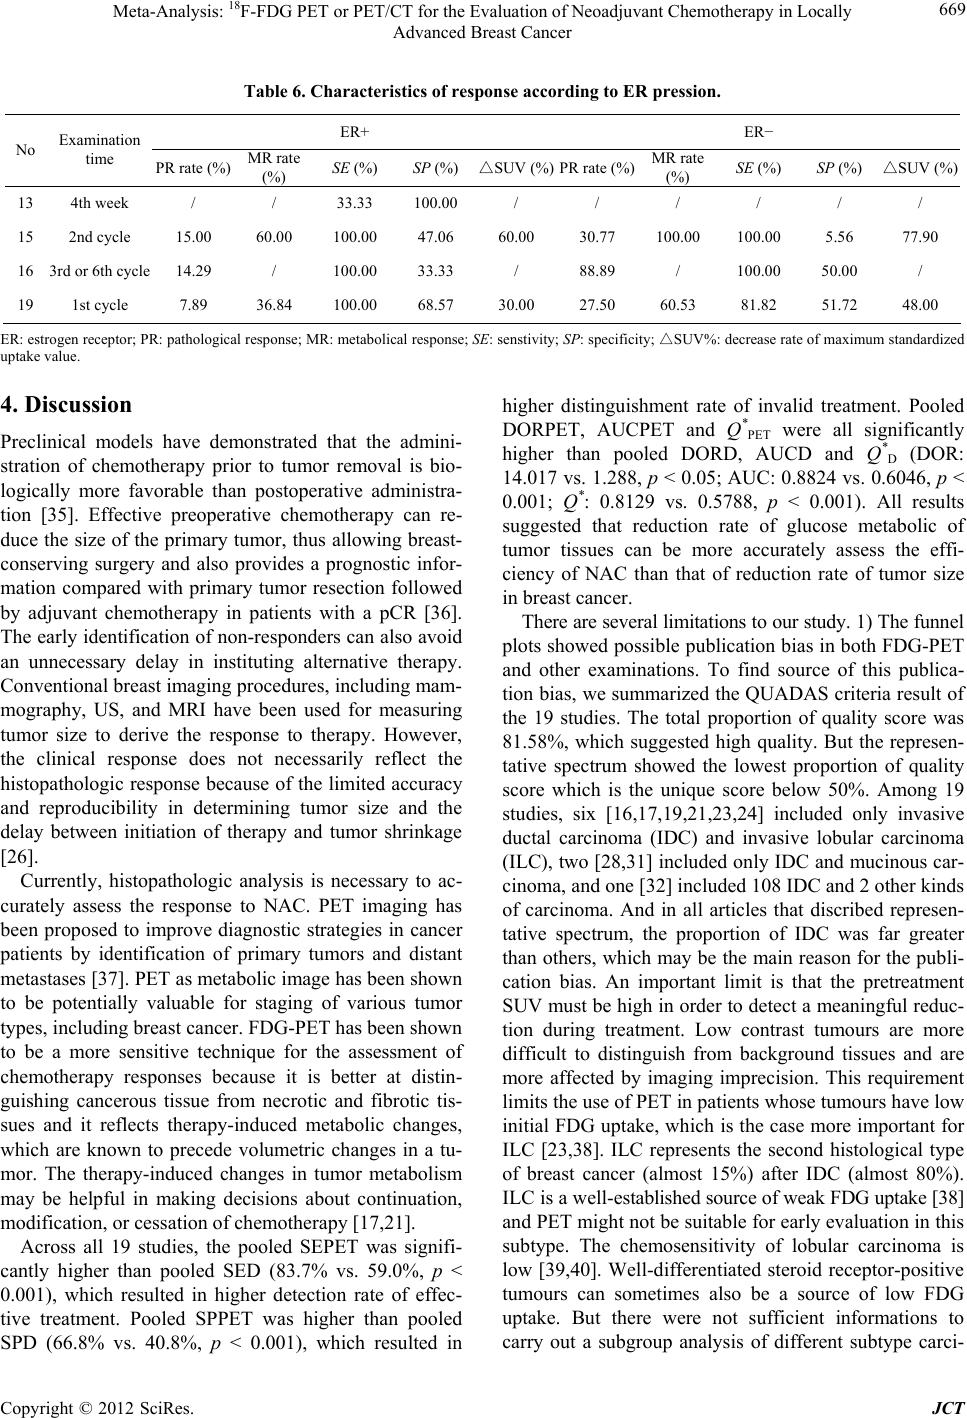 Meta-Analysis: 18 F-FDG PET or PET/CT for the Evaluation of Neoadjuvant Chemotherapy in Locally Advanced Breast Cancer Copyright © 2012 SciRes. JCT 669 Table 6. Characteristics of response according to ER pression. ER+ ER− No Examination time PR rate (%) MR rate (%) SE (%) SP (%) △SUV (%)PR rate (%)MR rate (%) SE (%) SP (%) △SUV (%) 13 4th week / / 33.33 100.00 / / / / / / 15 2nd cycle 15.00 60.00 100.00 47.06 60.00 30.77 100.00 100.00 5.56 77.90 16 3rd or 6th cycle 14.29 / 100.00 33.33 / 88.89 / 100.00 50.00 / 19 1st cycle 7.89 36.84 100.00 68.57 30.00 27.50 60.53 81.82 51.72 48.00 ER: estrogen receptor; PR: pathological response; MR: metabolical response; SE: senstivity; SP △ : specificity; SUV%: decrease rate of maximum standardized uptake value. 4. Discussion Preclinical models have demonstrated that the admini- stration of chemotherapy prior to tumor removal is bio- logically more favorable than postoperative administra- tion [35]. Effective preoperative chemotherapy can re- duce the size of the primary tumor, thus allowing breast- conserving surgery and also provides a prognostic infor- mation compared with primary tumor resection followed by adjuvant chemotherapy in patients with a pCR [36]. The early identification of non-responders can also avoid an unnecessary delay in instituting alternative therapy. Conventional breast imaging procedures, including mam- mography, US, and MRI have been used for measuring tumor size to derive the response to therapy. However, the clinical response does not necessarily reflect the histopathologic response because of the limited accuracy and reproducibility in determining tumor size and the delay between initiation of therapy and tumor shrinkage [26]. Currently, histopathologic analysis is necessary to ac- curately assess the response to NAC. PET imaging has been proposed to improve diagnostic strategies in cancer patients by identification of primary tumors and distant metastases [37]. PET as metabolic image has been shown to be potentially valuable for staging of various tumor types, including breast cancer. FDG-PET has been shown to be a more sensitive technique for the assessment of chemotherapy responses because it is better at distin- guishing cancerous tissue from necrotic and fibrotic tis- sues and it reflects therapy-induced metabolic changes, which are known to precede volumetric changes in a tu- mor. The therapy-induced changes in tumor metabolism may be helpful in making decisions about continuation, modification, or cessation of chemotherapy [17,21]. Across all 19 studies, the pooled SEPET was signifi- cantly higher than pooled SED (83.7% vs. 59.0%, p < 0.001), which resulted in higher detection rate of effec- tive treatment. Pooled SPPET was higher than pooled SPD (66.8% vs. 40.8%, p < 0.001), which resulted in higher distinguishment rate of invalid treatment. Pooled DORPET, AUCPET and Q* PET were all significantly higher than pooled DORD, AUCD and Q* D (DOR: 14.017 vs. 1.288, p < 0.05; AUC: 0.8824 vs. 0.6046, p < 0.001; Q*: 0.8129 vs. 0.5788, p < 0.001). All results suggested that reduction rate of glucose metabolic of tumor tissues can be more accurately assess the effi- ciency of NAC than that of reduction rate of tumor size in breast cancer. There are several limitations to our study. 1) The funnel plots showed possible publication bias in both FDG-PET and other examinations. To find source of this publica- tion bias, we summarized the QUADAS criteria result of the 19 studies. The total proportion of quality score was 81.58%, which suggested high quality. But the represen- tative spectrum showed the lowest proportion of quality score which is the unique score below 50%. Among 19 studies, six [16,17,19,21,23,24] included only invasive ductal carcinoma (IDC) and invasive lobular carcinoma (ILC), two [28,31] included only IDC and mucinous car- cinoma, and one [32] included 108 IDC and 2 other kinds of carcinoma. And in all articles that discribed represen- tative spectrum, the proportion of IDC was far greater than others, which may be the main reason for the publi- cation bias. An important limit is that the pretreatment SUV must be high in order to detect a meaningful reduc- tion during treatment. Low contrast tumours are more difficult to distinguish from background tissues and are more affected by imaging imprecision. This requirement limits the use of PET in patients whose tumours have low initial FDG uptake, which is the case more important for ILC [23,38]. ILC represents the second histological type of breast cancer (almost 15%) after IDC (almost 80%). ILC is a well-established source of weak FDG uptake [38] and PET might not be suitable for early evaluation in this subtype. The chemosensitivity of lobular carcinoma is low [39,40]. Well-differentiated steroid receptor-positive tumours can sometimes also be a source of low FDG uptake. But there were not sufficient informations to carry out a subgroup analysis of different subtype carci-  Meta-Analysis: 18 F-FDG PET or PET/CT for the Evaluation of Neoadjuvant Chemotherapy in Locally Advanced Breast Cancer 670 noma or receptor expression; 2) The heterogeneity test results were as follows: There was no heterogeneity for FDG-PET except the test of SP, while heterogeneity for other examinations except the test of DOR. There was no conclusive evidence of a cutoff effect for FDG-PET to Spearman correlation coefficients (p value < 0.4). But a cut off effect was present for other examinations (p value > 0.4). The existence of heterogeniety suggested the needs for higher quality prospective studies and multi- center trials. In this meta-analysis, Subgroup analyses were performed to identify heterogeneity potential sources, including PET timing points and cutoff values as me- tabolical response criteria. Figure 5 suggested SE rose and SP decrease gradually as time goes on. The best time point was after the second cycle of NAC while DOR was the highest. Figure 6 showed 40% - 45% was the best cutoff value of SUVmax as metabolical response with the highest DOR, especially for highest SP which will avoid over-treatment during NAC. These results were something different from those of Yuting Wang et al. [41]. Since breast cancer is a heterogeneous disease with a demonstrated in prognosis based on molecular pheno- types, many researchers have attempted to perform risk stratification and individualized treatment according to molecular phenotypes and a few studies tried to find the proof of which molecular phenotypes of breast cancer interpret FDG-PET evaluation accuracy [28,30,31,33,34]. In this meta-analysis, we found a trend that ER negative breast cancers had higher SE than ER positive, but lower SP, which probably because of a higher baseline SU- Vmax level [42] and lower metabolical response rate (48.42% vs. 80.26%) in ER positive resulted in greater SUVmax changes (62.95% vs. 45.00%) which leaded to difficultly decided thresold value for metabolical re- sponse criteria. Furthermore, lower pathological response rate (12.39% vs. 49.05%) and lower metabolical re- sponse rate in ER positive than in ER negative suggested that the NAC effect is not obvious to ER positive, and also reduced quality of PET image. Therefore, further study will focus on research different criteria according to molecular phenotypes for more accurate evaluation. 5. Conclusion Based on the studies reviewed, FDG-PET does have a higher global accuracy in assessing the NAC response in breast cancer. It seems to be a more useful supplement to current surveillance technique to reflect the histopa- thologic results. Comparing with clinical response, me- tabolical response plays a potential role in directing therapy for breast cancer. In order to have better correla- tion with pathological response, it’s suggested to perform FDG-PET after second cycle of NAC and employ cutoff value between 40% and 45% as FDG-PET criteria for metabolical response. Furthermore, different criteria will be drawn up according to molecular phenotypes in breast cancer for individualizing examinations. With the devel- opment of medical equipment and the improvement of PET technology, it is important to collect more random- ized studies, which can provide more useful information for guidance clinical work. 6. Acknowledgements This work was supported by Shanghai Leading Aca- demic Discipline Project S30203. REFERENCES [1] S. L. Parker, T. Tong, S. Bolden and P. A. Wingo, “Can- cer Statistics, 1997,” CA: A Cancer Journal for Clinicians, Vol. 47, No. 1, 1997, pp. 5-27. doi:10.3322/canjclin.47.1.5 [2] D. von Fournier, H. W. Anton, H. Junkermann, G. Bastert and G. van Kaick, “Breast Cancer Screening. State of the Art and Introduction to Preventive Measures,” Radiologe, Vol. 33, No. 5, 1993, pp. 227-235. [3] G. A. Atlanta, “Breast Cancer Facts and Figures,” Ameri- can Cancer Society, 2002. [4] B. Fisher, J. Bryant, N. Wolmark, E. Mamounas, A. Brown, E. R. Fisher, D. L. Wickerham, M. Begovic, A. DeCillis, A. Robidoux, R. G. Margolese, A. B. Cruz Jr., J. L. Hoehn, A. W. Lees, N. V. Dimitrov and H. D. Bear, “Effect of Preoperative Chemotherapy on the Outcome of Women with Operable Breast Cancer,” Journal of Clini- cal Oncology, Vol. 16, No. 8, 1998, pp. 2672-2685. [5] P. Rastogi, S. J. Anderson, H. D. Bear, C. E. Geyer, M. S. Kahlenberg, A. Robidoux, R. G. Margolese, J. L. Hoehn, V. G. Vogel, S. R. Dakhil, D. Tamkus, K. M. King, E. R. Pajon, M. J. Wright, J. Robert, S. Paik, E. P. Mamounas and N. Wolmark, “Preoperative Chemotherapy: Updates of National Surgical Adjuvant Breast and Bowel Project Protocols B-18 and B-27,” Journal of Clinical Oncology, Vol. 26, No. 5, 2008, pp. 778-785. doi:10.1200/JCO.2007.15.0235 [6] S. Chia, S. M. Swain, D. R. Byrd and D. A. Mankoff, “Locally Advanced and Inflammatory Breast Cancer,” Journal of Clinical Oncology, Vol. 26, No. 5, 2008, pp. 786-790. doi:10.1200/JCO.2008.15.0243 [7] E. R. Fisher, J. Wang, J. Bryant, B. Fisher, E. Mamounas and N. Wolmark, “Pathobiology of Preoperative Chemo- therapy: Findings from the National Surgical Adjuvant Breast and Bowel (NSABP) Protocol B-18,” Cancer, Vol. 95, No. 4, 2002, pp. 681-695. doi:10.1002/cncr.10741 [8] J. L. Khatcheressian, A. C. Wolff, T. J. Smith, E. Grun- feld, H. B. Muss, V. G. Vogel, F. Halberg, M. R. Somer- field and N. E. Davidson, “American Society of Clinical Oncology 2006 Update of the Breast Cancer Follow-Up and Management Guidelines in the Adjuvant Setting,” Journal of Clinical Oncology, Vol. 24, No. 31, 2006, pp. Copyright © 2012 SciRes. JCT  Meta-Analysis: 18 F-FDG PET or PET/CT for the Evaluation of Neoadjuvant Chemotherapy in Locally Advanced Breast Cancer 671 5091-5097. doi:10.1200/JCO.2006.08.8575 [9] C. R. Isasi, R. M. Moadel and M. D. Blaufox, “A Meta- Analysis of Fdg-Pet for the Evaluation of Breast Cancer Recurrence and Metastases,” Breast Cancer Research and Treatment, Vol. 90, No. 2, 2005, pp. 105-112. doi:10.1007/s10549-004-3291-7 [10] N. Houssami, P. Macaskill, M. L. Marinovich, J. M. Dixon, L. Irwig, M. E. Brennan and L. J. Solin, “Meta- Analysis of the Impact of Surgical Margins on Local Re- currence in Women with Early-Stage Invasive Breast Cancer Treated with Breast-Conserving Therapy,” Euro- pean Journal of Cancer, Vol. 46, No. 18, 2010, pp. 3219- 3232. doi:10.1016/j.ejca.2010.07.043 [11] L. Pan, Y. Han, X. Sun, J. Liu and H. Gang, “FDG-PET and Other Imaging Modalities for the Evaluation of Breast Cancer Recurrence and Metastases: A Meta- Analysis,” Journal of Cancer Research and Clinical On- cology, Vol. 136, No. 7, 2010, pp. 1007-1022. doi:10.1007/s00432-009-0746-6 [12] T. Liu, T. Cheng, W. Xu, W. L. Yan, J. Liu and H. L. Yang, “A Meta-Analysis of 18FDG-PET, MRI and Bone Scintigraphy for Diagnosis of Bone Metastases in Patients with Breast Cancer,” Skeletal Radiology, Vol. 40, No. 5, 2011, pp. 523-531. doi:10.1007/s00256-010-0963-8 [13] P. Shie, R. Cardarelli, D. Brandon, W. Erdman and N. Abdulrahim, “Meta-Analysis: Comparison of F-18 Fluoro- deoxyglucose-Positron Emission Tomography and Bone Scintigraphy in the Detection of Bone Metastases in Pa- tients with Breast Cancer,” Clinical Nuclear Medicine, Vol. 33, No. 2, 2008, pp. 97-101. doi:10.1097/RLU.0b013e31815f23b7 [14] P. Whiting, A. W. Rutjes, J. B. Reitsma, P. M. Bossuyt and J. Kleijnen, “The Development of QUADAS: A Tool for the Quality Assessment of Studies of Diagnostic Ac- curacy Included in Systematic Reviews,” BMC Medical Research Methodology, Vol. 3, 2003, p. 25. [15] L. E. Moses, D. Shapiro and B. Littenberg, “Combining Independent Studies of a Diagnostic Test into a Summary ROC Curve: Data-Analytic Approaches and Some Addi- tional Considerations,” Statistics in Medicine, Vol. 12, No. 14, 1993, pp. 1293-1316. doi:10.1002/sim.4780121403 [16] M. Schelling, N. Avril, J. Nahrig, W. Kuhn, W. Romer, D. Sattler, M. Werner, J. Dose, F. Janicke, H. Graeff and M. Schwaiger, “Positron Emission Tomography Using [(18)F] Fluorodeoxyglucose for Monitoring Primary Chemother- apy in Breast Cancer,” Journal of Clinical Oncology, Vol. 18, No. 8, 2000, pp. 1689-1695. [17] I. C. Smith, A. E. Welch, A. W. Hutcheon, I. D. Miller, S. Payne, F. Chilcott, S. Waikar, T. Whitaker, A. K. Ah-See, O. Eremin, S. D. Heys, F. J. Gilbert and P. F. Sharp, “Positron Emission Tomography Using [(18)F]-Fluoro- deoxy-D-Glucose to Predict the Pathologic Response of Breast Cancer to Primary Chemotherapy,” Journal of Cli- nical Oncology, Vol. 18, No. 8, 2000, pp. 1676-1688. [18] S. J. Kim, “Predictive Value of [18F]FDG PET for Patho- logical Response of Breast Cancer to Neo-Adjuvant Che- motherapy,” Annals of Oncology, Vol. 15, No. 9, 2004, pp. 1352-1357. doi:10.1093/annonc/mdh345 [19] C. Rousseau, A. Devillers, C. Sagan, L. Ferrer, B. Bridji, L. Campion, M. Ricaud, E. Bourbouloux, I. Doutriaux, M. Clouet, D. Berton-Rigaud, C. Bouriel, V. Delecroix, E. Garin, S. Rouquette, I. Resche, P. Kerbrat, J. F. Chatal and M. Campone, “Monitoring of Early Response to Neo- adjuvant Chemotherapy in Stage II and III Breast Cancer by [18F]Fluorodeoxyglucose Positron Emission Tomo- graphy,” Journal of Clinical Oncology, Vol. 24, No. 34, 2006, pp. 5366-5372. doi:10.1200/JCO.2006.05.7406 [20] D. Li, Q. Yao, L. Li, L. Wang and J. Chen, “Correlation between Hybrid 18F-FDG PET/CT and Apoptosis In- duced by Neoadjuvant Chemotherapy in Breast Cancer,” Cancer Biology & Therapy, Vol. 6, No. 9, 2007, pp. 1442- 1448. doi:10.4161/cbt.6.9.4621 [21] A. Berriolo-Riedinger, C. Touzery, J.-M. Riedinger, M. Toubeau, B. Coudert, L. Arnould, C. Boichot, A. Cochet, P. Fumoleau and F. Brunotte, “[18F]FDG-PET Predicts Complete Pathological Response of Breast Cancer to Neoadjuvant Chemotherapy,” European Journal of Nu- clear Medicine and Molecular Imaging, Vol. 34, No. 12, 2007, pp. 1915-1924. doi:10.1007/s00259-007-0459-5 [22] G. M. McDermott, A. Welch, R. T. Staff, F. J. Gilbert, L. Schweiger, S. I. K. Semple, T. A. D. Smith, A. W. Hutch- eon, I. D. Miller, I. C. Smith and S. D. Heys, “Monitoring Primary Breast Cancer Throughout Chemotherapy Using FDG-PET,” Breast Cancer Research and Treatment, Vol. 102, No. 1, 2006, pp. 75-84. doi:10.1007/s10549-006-9316-7 [23] J. Duch, D. Fuster, M. Muñoz, P. L. Fernández, P. Pare- des, M. Fontanillas, F. Guzmán, S. Rubí, F. J. Lomeña and F. Pons, “18F-FDG PET/CT for Early Prediction of Response to Neoadjuvant Chemotherapy in Breast Can- cer,” European Journal of Nuclear Medicine and Mo- lecular Imaging, Vol. 36, No. 10, 2009, pp. 1551-1557. doi:10.1007/s00259-009-1116-y [24] A. Kumar, R. Kumar, V. Seenu, S. D. Gupta, M. Chawla, A. Malhotra and S. N. Mehta, “The Role of 18F-FDG PET/CT in Evaluation of Early Response to Neoadjuvant Chemotherapy in Patients with Locally Advanced Breast Cancer,” European Radiology, Vol. 19, No. 6, 2009, pp. 1347-1357. doi:10.1007/s00330-009-1303-z [25] J. Schwarz-Dose, M. Untch, R. Tiling, S. Sassen, S. Mahner, S. Kahlert, N. Harbeck, A. Lebeau, W. Brenner, M. Schwaiger, F. Jaenicke and N. Avril, “Monitoring Primary Systemic Therapy of Large and Locally Ad- vanced Breast Cancer by Using Sequential Positron Emission Tomography Imaging with [18f]Fluorodeoxy- glucose,” Journal of Clinical Oncology, Vol. 27, No. 4, 2009, pp. 535-541. doi:10.1200/JCO.2008.17.2650 [26] J. H. Choi, H. I. Lim, S. K. Lee, W. W. Kim, S. M. Kim, E. Cho, E. Y. Ko, B.-K. Han, Y. H. Park, J.-S. Ahn, Y.-H. Im, J. E. Lee, J.-H. Yang and S. J. Nam, “The Role of PET CT to Evaluate the Response to Neoadjuvant Che- motherapy in Advanced Breast Cancer: Comparison with Ultrasonography and Magnetic Resonance Imaging,” Jour- nal of Surgical Oncology, Vol. 102, No. 5, 2009, pp. 392- 397. doi:10.1002/jso.21424 [27] S.-Y. Jung, S.-K. Kim, B.-H. Nam, S. Y. Min, S. J. Lee, C. Park, Y. Kwon, E.-A. Kim, K. L. Ko, I. H. Park, K. S. Copyright © 2012 SciRes. JCT  Meta-Analysis: 18 F-FDG PET or PET/CT for the Evaluation of Neoadjuvant Chemotherapy in Locally Advanced Breast Cancer Copyright © 2012 SciRes. JCT 672 Lee, K. H. Shin, S. Lee, S. W. Kim, H.-S. Kang and J. Ro, “Prognostic Impact of [18F] FDG-PET in Operable Breast Cancer Treated with Neoadjuvant Chemotherapy,” An- nals of Surgical Oncology, Vol. 17, No. 1, 2009, pp. 247- 253. doi:10.1245/s10434-009-0710-3 [28] S. Ueda, H. Tsuda, T. Saeki, J. Omata, A. Osaki, T. Shi- gekawa, J. Ishida, K. Tamura, Y. Abe, T. Moriya and J. Yamamoto, “Early Metabolic Response to Neoadjuvant Letrozole, Measured by FDG PET/CT, Is Correlated with a Decrease in the Ki67 Labeling Index in Patients with Hormone Receptor-Positive Primary Breast Cancer: A Pilot Study[J/OL],” Breast Cancer, Vol. 18, No. 4, 2010, pp. 299-308. [29] M. E. Schneider-Kolsky, S. Hart, J. Fox, P. Midolo, J. Stuckey, M. Hofman and V. Ganju, “The Role of Che- motherapeutic Drugs in the Evaluation of Breast Tumour Response to Chemotherapy Using Serial FDG-PET,” Breast Cancer Research, Vol. 12, No. 3, 2010, p. R37. doi:10.1186/bcr2591 [30] A. A. Martoni, C. Zamagni, S. Quercia, M. Rosati, N. Cacciari, A. Bernardi, A. Musto, S. Fanti, D. Santini and M. Taffurelli, “Early18F-2-Fluoro-2-Deoxy-D-Glucose Po- sitron Emission Tomography May Identify a Subset of Patients with Estrogen Receptor-Positive Breast Cancer Who Will Not Respond Optimally to Preoperative Che- motherapy,” Cancer, Vol. 116, No. 4, 2010, pp. 805-813. doi:10.1002/cncr.24820 [31] J. S. Park, W. K. Moon, C. Y. Lyou, N. Cho, K. W. Kang and J. K. Chung, “The Assessment of Breast Cancer Re- sponse to Neoadjuvant Chemotherapy: Comparison of Magnetic Resonance Imaging and 18F-Fluorodeoxy- glucose Positron Emission Tomography,” Acta Radio- logica, Vol. 52, No. 1, 2011, pp. 21-28. doi:10.1258/ar.2010.100142 [32] S. Ueda, T. Saeki, T. Shigekawa, J. Omata, T. Moriya, J. Yamamoto, A. Osaki, N. Fujiuchi, M. Misumi, H. Ta- keuchi, T. Sakurai, H. Tsuda, K. Tamura, J. Ishida, Y. Abe, E. Imabayashi, I. Kuji and H. Matsuda, “18F- Fluorodeoxyglucose Positron Emission Tomography Op- timizes Neoadjuvant Chemotherapy for Primary Breast Cancer to Achieve Pathological Complete Response,” In- ternational Journal of Clinical Oncology, Vol. 17, No. 3, 2011, pp. 276-282. [33] S. H. Park, W. K. Moon, N. Cho, J. M. Chang, S.-A. Im, I. A. Park, K. W. Kang, W. Han and D.-Y. Noh, “Com- parison of Diffusion-Weighted MR Imaging and FDG PET/CT to Predict Pathological Complete Response to Neoadjuvant Chemotherapy in Patients with Breast Can- cer,” European Radiology, Vol. 22, No. 1, 2011, pp. 18- 25. [34] B. Keam, S. A. Im, Y. Koh, S. W. Han, D. Y. Oh, N. Cho, J. H. Kim, W. Han, K. W. Kang, W. K. Moon, T. Y. Kim, I. A. Park, D. Y. Noh, J. K. Chung and Y. J. Bang, “Early Metabolic Response Using FDG PET/CT and Molecular Phenotypes of Breast Cancer Treated with Neoadjuvant Chemotherapy,” BMC Cancer, Vol. 11, No. 1, 2011, p. 452. [35] B. Fisher, N. Gunduz and E. A. Saffer, “Influence of the Interval between Primary Tumor Removal and Chemo- therapy on Kinetics and Growth of Metastases,” Cancer Research, Vol. 43, No. 4, 1983, pp. 1488-1492. [36] S. Chaturvedi, C. McLaren, A. C. Schofield, K. N. Og- ston, T. K. Sarkar, A. W. Hutcheon, I. D. Miller and S. D. Heys, “Patterns of Local and Distant Disease Relapse in Patients with Breast Cancer Treated with Primary Che- motherapy: Do Patients with a Complete Pathological Response Differ from Those with Residual Tumour in the Breast?” Breast Cancer Research and Treatment, Vol. 93, No. 2, 2005, pp. 151-158. doi:10.1007/s10549-005-4615-y [37] W. B. Eubank, D. A. Mankoff, H. J. Vesselle, J. F. Eary, E. K. Schubert, L. K. Dunnwald, S. K. Lindsley, J. R. Gralow, M. M. Austin-Seymour, G. K. Ellis and R. B. Livingston, “Detection of Locoregional and Distant Re- currences in Breast Cancer Patients by Using FDG PET,” Radiographics, Vol. 22, No. 1, 2002, pp. 5-17. [38] D. Groheux, S. Giacchetti, J. L. Moretti, R. Porcher, M. Espie, J. Lehmann-Che, A. de Roquancourt, A. S. Hamy, C. Cuvier, L. Vercellino and E. Hindie, “Correlation of High 18F-FDG Uptake to Clinical, Pathological and Bio- logical Prognostic Factors in Breast Cancer,” European Journal of Nuclear Medicine and Molecular Imaging, Vol. 38, No. 3, 2011, pp. 426-435. doi:10.1007/s00259-010-1640-9 [39] M. E. Straver, E. J. Rutgers, S. Rodenhuis, S. C. Linn, C. E. Loo, J. Wesseling, N. S. Russell, H. S. Oldenburg, N. Antonini and M. T. Vrancken Peeters, “The Relevance of Breast Cancer Subtypes in the Outcome of Neoadjuvant Chemotherapy,” Annals of Surgical Oncology, Vol. 17, No. 9, 2010, pp. 2411-2418. doi:10.1245/s10434-010-1008-1 [40] G. von Minckwitz, S. Kummel, P. Vogel, C. Hanusch, H. Eidtmann, J. Hilfrich, B. Gerber, J. Huober, S. D. Costa, C. Jackisch, S. Loibl, K. Mehta and M. Kaufmann, “In- tensified Neoadjuvant Chemotherapy in Early-Respond- ing Breast Cancer: Phase III Randomized GeparTrio Study,” Journal of the National Cancer Institute, Vol. 100, No. 8, 2008, pp. 552-562. doi:10.1093/jnci/djn089 [41] Y. Wang, C. Zhang, J. Liu and G. Huang, “Is 18F-FDG PET Accurate to Predict Neoadjuvant Therapy Response in Breast Cancer? A Meta-Analysis,” Breast Cancer Re- search and Treatment, Vol. 131, No. 2, 2012, pp. 357- 369. doi:10.1007/s10549-011-1780-z [42] Y. Sanli, S. Kuyumcu, Z. G. Ozkan, G. Isik, H. Karanlik, B. Guzelbey, C. Turkmen, S. Ozel, E. Yavuz and A. Mudun, “Increased FDG Uptake in Breast Cancer Is As- sociated with Prognostic Factors,” Annals of Nuclear Medicine, Vol. 26, No. 4, 2012, pp. 345-350. doi:10.1007/s12149-012-0579-2
|