Journal of Minerals and Materials Characterization and Engineering, 2012, 11, 1012-1019
Published Online October 2012 (http://www.SciRP.org/journal/jmmce)
Electrochemical Impedance Spectroscopy of Hybrid
Epoxy Resin Emulsion Coatings
Rakesh N. Patil, Brihbihari V. Sharma, Prakash A. Mahanwar
Department of Polymer & Surface Engineering, Institute of Chemical Technology, Mumbai, India
Email: rakeshpatil1508@gmail.com
Received May 9, 2012; revised June 13, 2012; accepted June 25, 2012
ABSTRACT
A hybrid epoxy resin one pack emulsion with acrylate was synthesized for application in the field of corrosion protec-
tion. Electrochemical impedance tests were applied to steel specimens coated with hybrid epoxy and tested after im-
mersion in 3.5% NaCl solution at room temperature. Results taken from Nyquist and Bode plots as were analyzed by
means of software provided with the instrument. Specimens were examined under scanning electron microscope shows
a clear rupture and degradation in hybrid epoxy coating after prolonged exposer to salt solution.
Keywords: Hybrid; Epoxy; Electrochemical Impedance Spectroscopy; Coatings
1. Introduction
Epoxy resins have excellent characteristic property of
corrosion resistance [1]. They have been used as two
pack systems in combination of different curing agents as
protective coatings [2]. However; they have poor or low
fracture energy, high shrinkage, and show brittle beha-
vior [3]. To overcome this disadvantages hybrid of epoxy
resin was synthesized with acrylate monomers using
emulsion polymerization technique. The hybrid can be
defined as, the system synthesized from two or more par-
ticipating components having superior properties then
both the participants. The hybrid epoxy resin synthesized
emulsion obtained was one pack system with longer shelf
life. For the hybrid to be used as a protective coating,
corrosion resistance properties must be satisfactory.
Electrochemical Impedance Spectroscopy (EIS) has
many advantages in comparison with other electroche-
mical techniques. It is a non-destructive method for the
evaluation of a wide range of materials, including coat-
ings, anodized films and corrosion inhibitors. It can also
provide detailed information of the systems under exami-
nation; parameters such as corrosion rate, electroche-
mical mechanisms and detection of localized corrosion.
Polymer based coatings use barrier technology to protect
substrates from corrosive chemicals and environments,
particularly when in immersion service [4].
This paper reports, results of an investigation of the
corrosion resistance of the hybrid coatings using EIS
techniques. The hybrid one pack epoxy system was syn-
thesized with conventional emulsion polymerization
technique. The effects of coating thickness on water
absorbance and ultimately on corrosion resistance were
also studied. Nyquist and bode plots was analyzed to
predict the corrosion performance of hybrid coatings.
SEM analysis of the specimen was performed after im-
mersion to get a closer view of coating degradation.
2. Experimental
2.1. Materials
Diglycidyl ethers of bisphenol A (DGEBA) epoxy resin
(D.E.R. 336) Kindly provided by Dow Chemical inter-
national, India. n-butylacrylate (BA) and methylmetha-
crylate (MMA) were used as the acrylic monomers.
Acrylic acid (AA) and 2-hydroxyl ethyl methacrylate
(HEMA) were used as the functional acrylic monomers
purchased from Indofil chemicals, Potassium persulfate
(KPS) used as initiator, Ethylene diamine (EDA) solution
used for neutralisation and sodium bicarbonate (SBC) as
a buffer was purchased from Sigma Aldrich, Nonyl phe-
noxy polyethyleneoxy ethanol nonionic surfactant HLB
17.8 (Neoigen DK X 405) nonionic surfactant and sodium
dodecyl benzene sulfonate (Daninol 25P) were used as
anionic surfactant supplied by Dai-Ichi Karkaria. Dis-
tilled and Deionized water was used throughout all
experiments arranged here. All the other chemicals used
in this work were AR grades obtained from a S.D. Fines
Chemicals used without further purification.
2.2. Preparation of Hybrid Epoxy Resin
Emulsion
The synthesis of hybrid emulsion was carried out in a
Copyright © 2012 SciRes. JMMCE
R. N. PATIL ET AL. 1013
500 mL four necked reaction vessel equipped with a
reflux condenser, nitrogen gas inlet, mechanical stirrer,
addition funnels, and a thermometer placed in a water
bath. Solid content of the emulsion was designed as 45%
by weight. Aqueous phase for emulsion polymerization
was prepared by addition of D.I. Water, surfactants and
buffer to the reactor (weight ratio: D.I. Water/surfactant/
NaHCO3 = 0.96/0.031/0.009), followed by the addition
of the initiator (KPS, 0.8% based on total monomer
mixture) at 70˚C under nitrogen atmosphere. The poly-
merization was performed at 70˚C by adding a mixture of
epoxy resin dissolved in acrylate monomers (weight ratio:
ER/BA/MMA/2-HEMA/AA = 0.60/0.22/0.15/0.015/0.015).
Finally, naturalization was carried out with ethylene dia-
mine solution and emulsion was stored in sealed con-
tainer.
2.3. Preparation of Specimen for Testing
Specimens in the form of mild steel strips with 1000 ×
700 × 0.5 mm size were used for analysis. Specimens
were cleaned and degreased before coating application.
Hybrid epoxy coatings were applied to specimen surfaces
and they were left to dry for 24 hours at 28˚C. Dry film
thickness was measured by a thickness gage. Two speci-
mens were tested as soon as they were immersed in test-
ing solution and were considered as time zero. Data were
collected from specimens immersed in solution for 12
days at room temperature.
2.4. Methods
Electrochemical Impedance Tests
The corrosion behavior of the specimens was monitored
using electrochemical impedance spectroscopy (EIS)
during immersion in 3.5% NaCl solution open to air and
at room temperature for up to 12 days. A three-electrode
set-up was used to record corrosion potential of coating.
A saturated calomel electrode (SCE) was used as the re-
ference electrode. It was coupled capacitively to a Pt
wire to reduce the phase shift at higher frequencies. Ele-
ctrochemical impedance tests were carried out by using
Versa STAT 3 provided with frequency response analy-
zer, frequency in the range from 1 Hz to 1 kHz to collect
data with a total number of 40 readings for the whole
range. The amplitude of the sinusoidal voltage signal was
50 mV. Data were collected by means of Frequency
Response Analyzer software developed by Princeton
Applied Research instruments and were in the form of
Nyquist plots. Tested specimens were washed with dis-
tilled water, and then gold coated to examined under
scanning electron microscope.
2.5. Results & Discussion
The equivalent circuit for polymer coated steel can be
represented by the model shown in Figure 1. Where, RS
is the solution resistance, RP is the pore resistance of the
coating, RT is the charge transfer resistance of the metal/
solution interface, Cdl is the double layer capacitance,
and Cc is the coating resistance.
Figures 3-7 represent the Nyquist plots for the impe-
dance of specimens tested after immersion in 3% Nacl
solution at room temperature for a period of 12 days.
Figure 3 shows, the Nyquist plot for the specimen tested
at the time of immersion, the behavior takes a shape of a
part of a semicircle with high capacitive and resistive
values. The overlay of bode plots for hybrid coating with
different thickness are presented in the Figure 2. From
which it can be predicted that hybrid coating possesses
good corrosion resistance properties.
The effect of exposure time on the impedance beha-
vior of hybrid epoxy coating can be seen from Figures 8
and 9, a severe change in capacitance and resistance
values just after immersion for 4 days. Further immersion
had also a great effect on the behavior of hybrid epoxy
coat- ings. Immersion for 12 days and above, yielded a
double semi-circle, Nyquist plot with an indication about
the failure of hybrid coating and the interaction of metal
surfaces with a solution. Figures 8 and 9 show the values
of Capacitance (Cd) and Resistance (Rc) for specimen E
as a function of immersion time. The capacitance values
of the samples were very low, these values increased gra-
dually as they were immersed in the solution. In the case
of hybrid epoxy coatings, the value of Cd increases after
Figure 1. Equivalent RC circuit for organic coating/metal
systems.
Figure 2. Overlay of Bode plot for hybrid coatings with
different thickness.
Copyright © 2012 SciRes. JMMCE
R. N. PATIL ET AL.
Copyright © 2012 SciRes. JMMCE
1014
Z , Msd.
unknown.txt
Model : R(C(R(CR))) Wgt : Modulus
Z ', ohm-sq. cm
5.50E+055.00E+054.50E+054.00E+053.50E+053.00E+052.50E+052.00E+051.50E+051.00E+055.00E+040.00E+00
- Z '', ohm-sq. cm
3.40E+05
3.20E+05
3.00E+05
2.80E+05
2.60E+05
2.40E+05
2.20E+05
2.00E+05
1.80E+05
1.60E+05
1.40E+05
1.20E+05
1.00E+05
8.00E+04
6.00E+04
4.00E+04
2.00E+04
0.00E+00
Figure 3. Nyquist plot of the epoxy-acrylate tested just after immersion in the testing solution.
Z , Msd.
unknown.txt
Model : R(C(R(CR ))) Wgt : Modulus
Z ', ohm-sq. cm
1.40E+071.30E+071.20E+071.10E+071.00E+079.00E+068.00E+067.00E+066.00E+065.00E+064.00E+063.00E+062.00E+061.00E+060.00E+00
- Z '', ohm-sq. cm
9.00E+06
8.50E+06
8.00E+06
7.50E+06
7.00E+06
6.50E+06
6.00E+06
5.50E+06
5.00E+06
4.50E+06
4.00E+06
3.50E+06
3.00E+06
2.50E+06
2.00E+06
1.50E+06
1.00E+06
5.00E+05
0.00E+00
Figure 4. Nyquist plot of the epoxy-acrylate after 4 days of immersion.
R. N. PATIL ET AL. 1015
Z , Msd.
unknown.txt
Model : R(Q(R(CR ))) Wgt : Modulus
Z ', ohm-sq. cm
3.50E+053.00E+052.50E+052.00E+051.50E+051.00E+055.00E+040.00E+00
- Z '', ohm-sq. cm
2.30E+05
2.20E+05
2.10E+05
2.00E+05
1.90E+05
1.80E+05
1.70E+05
1.60E+05
1.50E+05
1.40E+05
1.30E+05
1.20E+05
1.10E+05
1.00E+05
9.00E+04
8.00E+04
7.00E+04
6.00E+04
5.00E+04
4.00E+04
3.00E+04
2.00E+04
1.00E+04
0.00E+00
Figure 5. Nyquist plot of the sample after 8 days immersion.
Figure 6. Nyquist plot of the sample after 10 days immersion.
Copyright © 2012 SciRes. JMMCE
R. N. PATIL ET AL.
Copyright © 2012 SciRes. JMMCE
1016
Figure 7. Nyquist plot of the sample after 12 days immersion.
15
10
5
0
0510
log Cd
Time in Days
15
surface. This penetration can be through breakdown sites
of the coating. The high viscosity of salt water compared
to water may make water uptake a time consuming
process. The other parameter, (Rc), gives an indication
about the corrosion process at the steel surface. This
parameter can be used to study the effectiveness of some
coating in the protection of metals. Figure 9 shows the
decrease in the value of Rc with respect to immersion
time. Scanning Electron Micrographs taken from speci-
mens tested after 10 days of immersion show a clear
coating degradation in the form of holidays and rupture.
This can be seen from Figures 13. The effect of immer-
sion time on the performance of epoxy coating is clear,
and can be seen from the values of Cd and Rc.
Figure 8. The value of Cd versus immersion time for spe-
cimen E.
0.00E+00
5.00E+04
1.00E+05
1.50E+05
2.00E+05
2.50E+05
0510 15
Rc of Coatings
Time in Da
y
s
Water Absorbance Study of Hybrid Coating
The pore resistance, RP, which represents the ability of
coating to protect the substrate, can be determined in the
low frequency region in which the coating impedance is
independent of frequency. The results show that hybrid
coatings have their well-defined pore resistance; Table 1
summarizes the coating impedance at 0.1 Hz obtained in
this investigation as a function of immersion time for
coatings of varying thickness.
Figure 9. Rc versus immersion time for specimen E.
immersion in the electrolyte, reaching a constant value.
The plateau period of Cd indicates the beginning of
detachment of the coating from the substrate due to
adhesion loss. Figure 10 plots the IZI at 0.1 Hz as a function of coat-
ing thickness for a hybrid which are of the same coating
type but at different thicknesses.
In the case of sample E, a low value of Cd were ob-
tained of epoxy coating just after immersion in salt water,
the gradual increase in the value of Cd can be due to
solution penetration between the coating and the steel
The results demonstrated that, the coating impedance
increased with thickness. As shown in Figure 10, the
R. N. PATIL ET AL. 1017
0
50000
100000
150000
200000
250000
0 2040608
Impedance @ (0.1 Hz)
Coating Thickness (µm)
0
Figure 10. Plot of impedance values against coating thick-
ness.
Table 1. Water absorption ω as a function of immersion
time.
Water absorption, ω
Specimen
Coating
thickness
(µm) 4 Day 8 Days 10 Day
A 32 0.00465 0.57519 0.62417
B 40 0.00615 0.21662 1.18781
C 54 0.30368 0.59983 1.28901
D 66 0.15323 0.69160 1.29040
E 75 0.09285 0.36626 1.35465
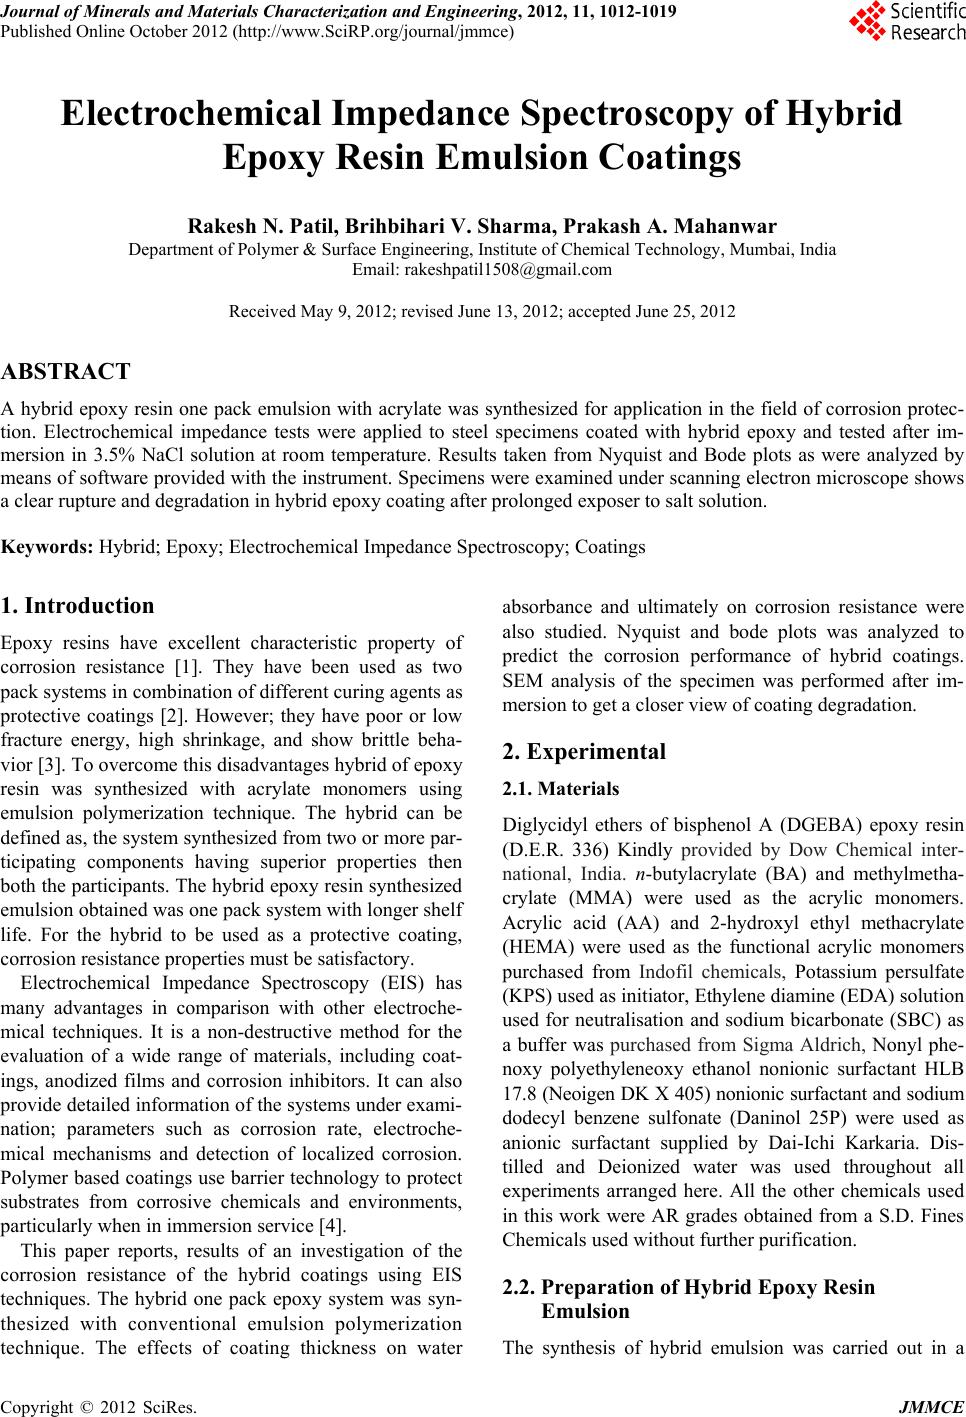
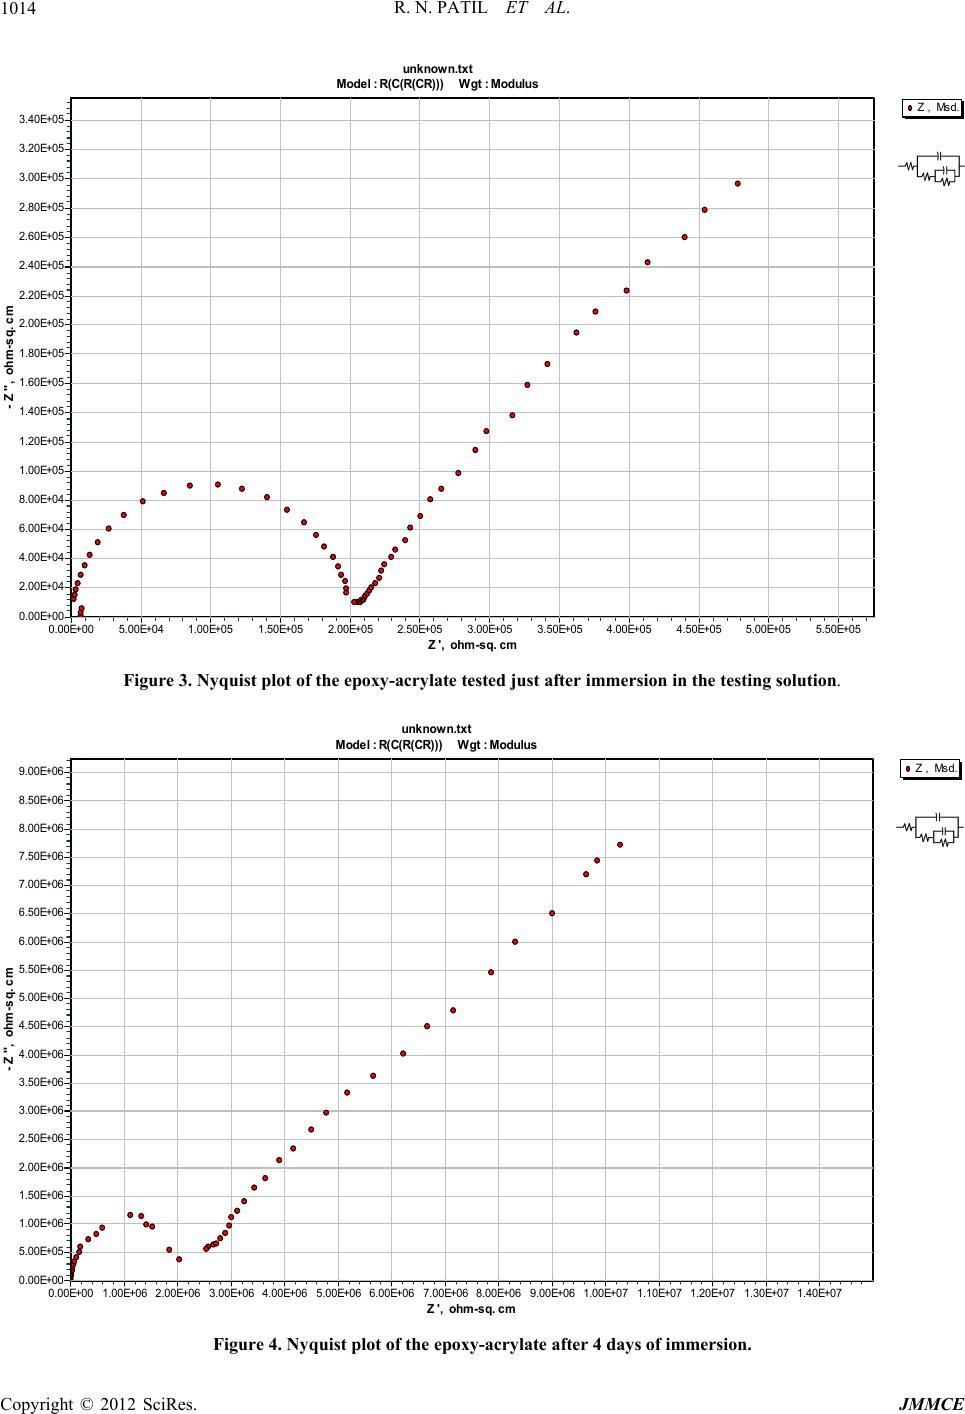
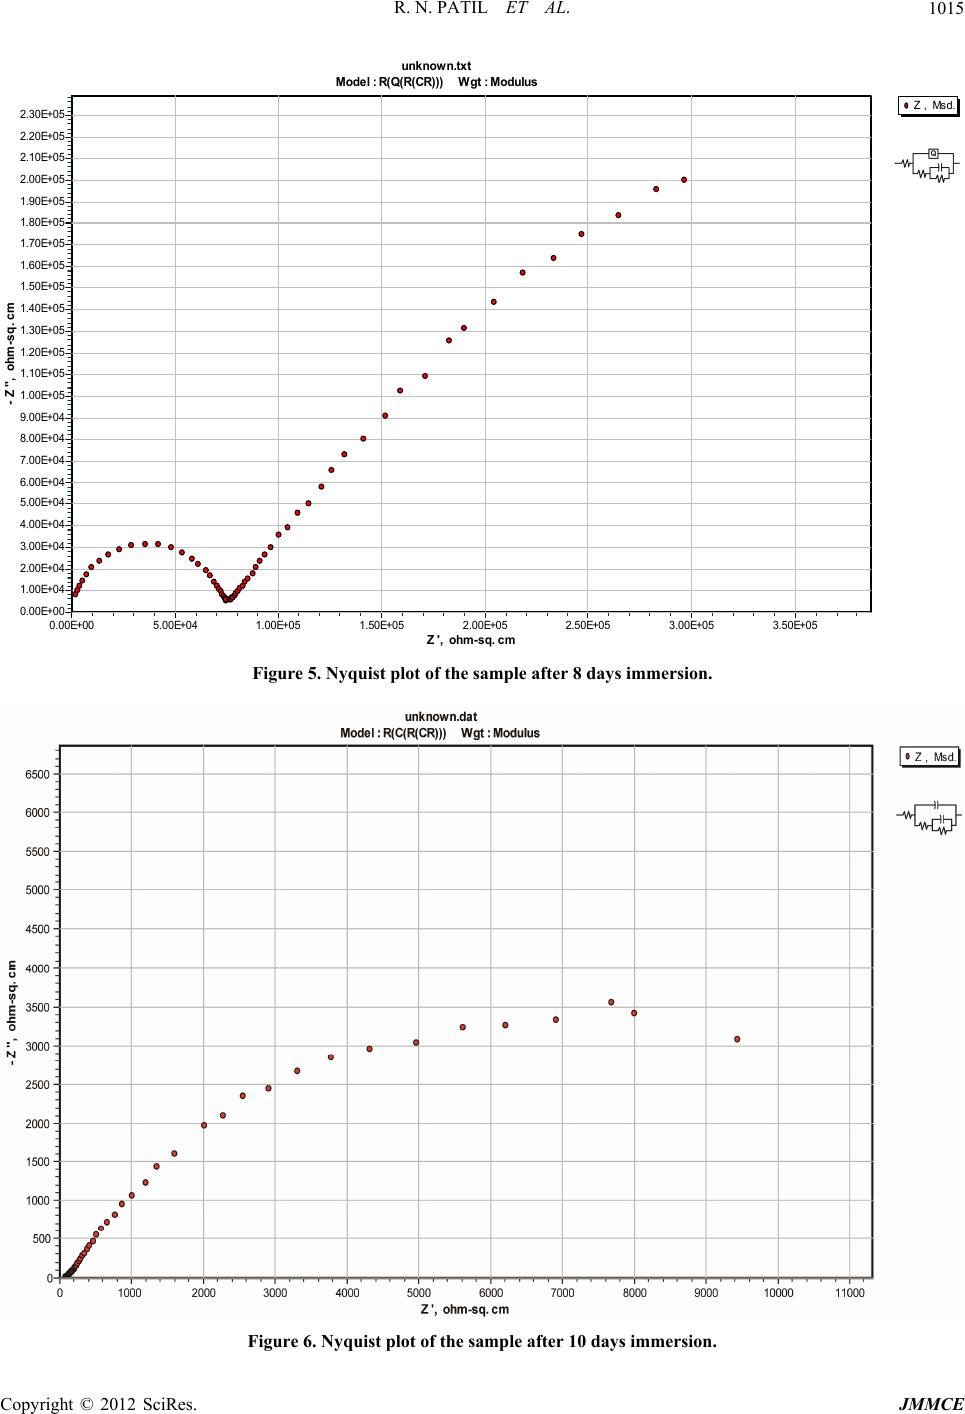
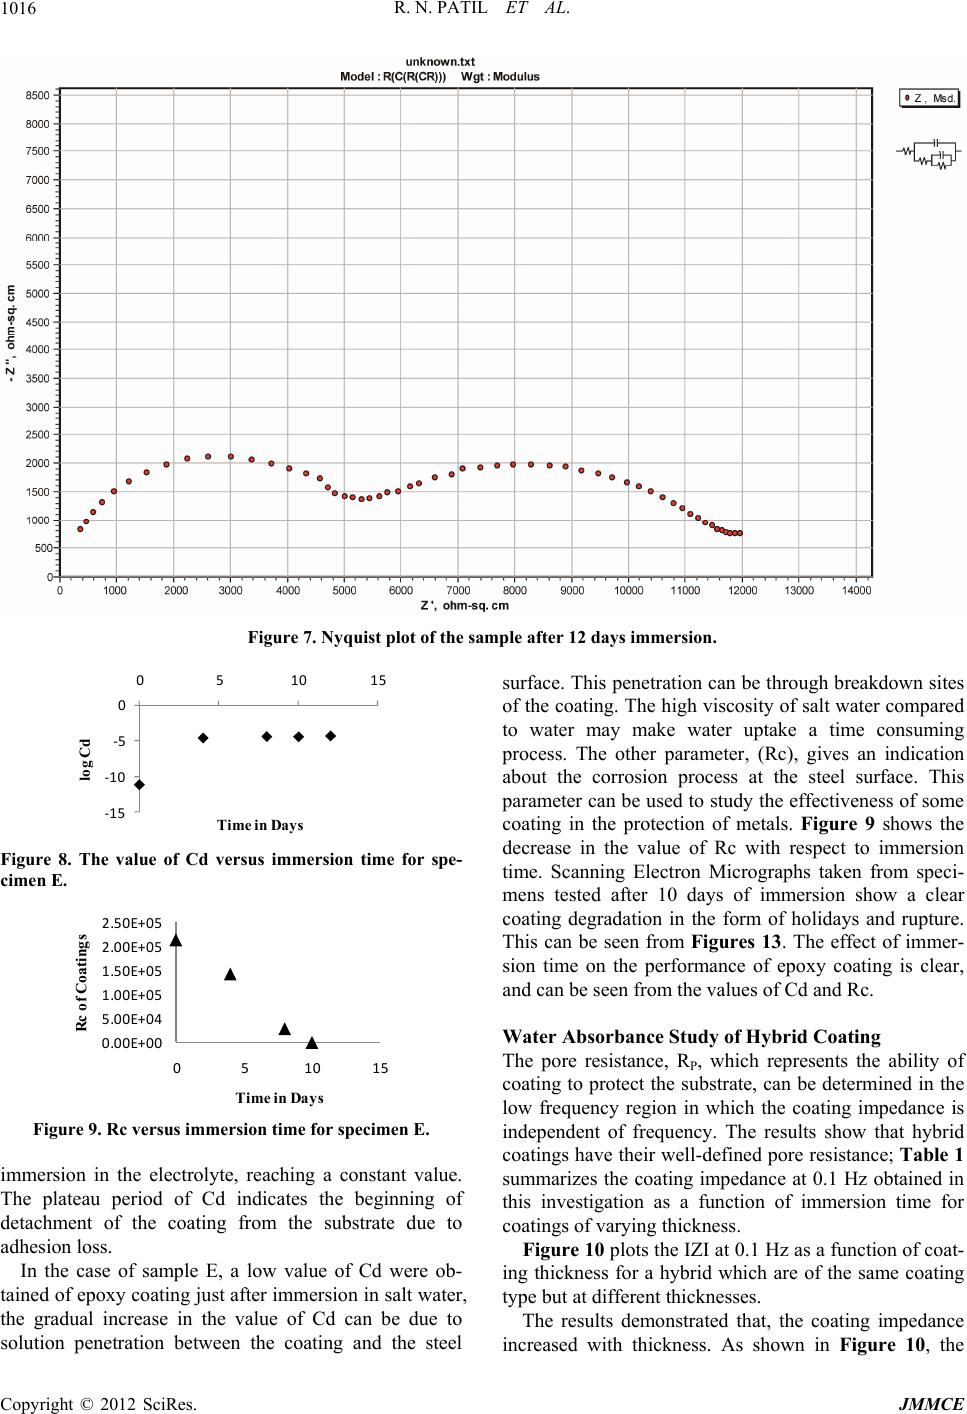
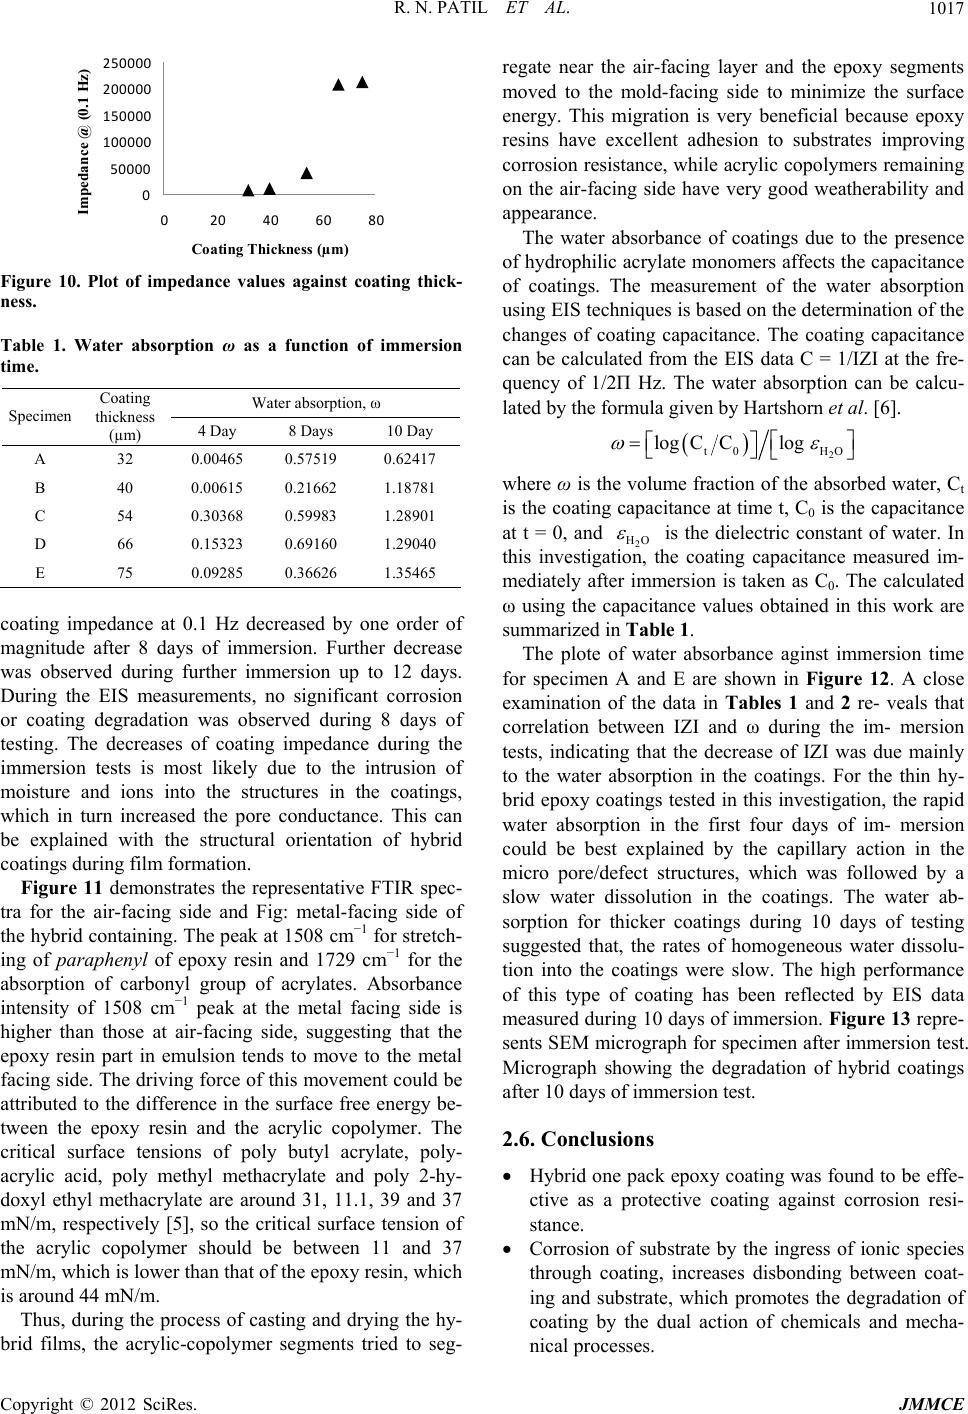
coating impedance at 0.1 Hz decreased by one order of
magnitude after 8 days of immersion. Further decrease
was observed during further immersion up to 12 days.
During the EIS measurements, no significant corrosion
or coating degradation was observed during 8 days of
testing. The decreases of coating impedance during the
immersion tests is most likely due to the intrusion of
moisture and ions into the structures in the coatings,
which in turn increased the pore conductance. This can
be explained with the structural orientation of hybrid
coatings during film formation.
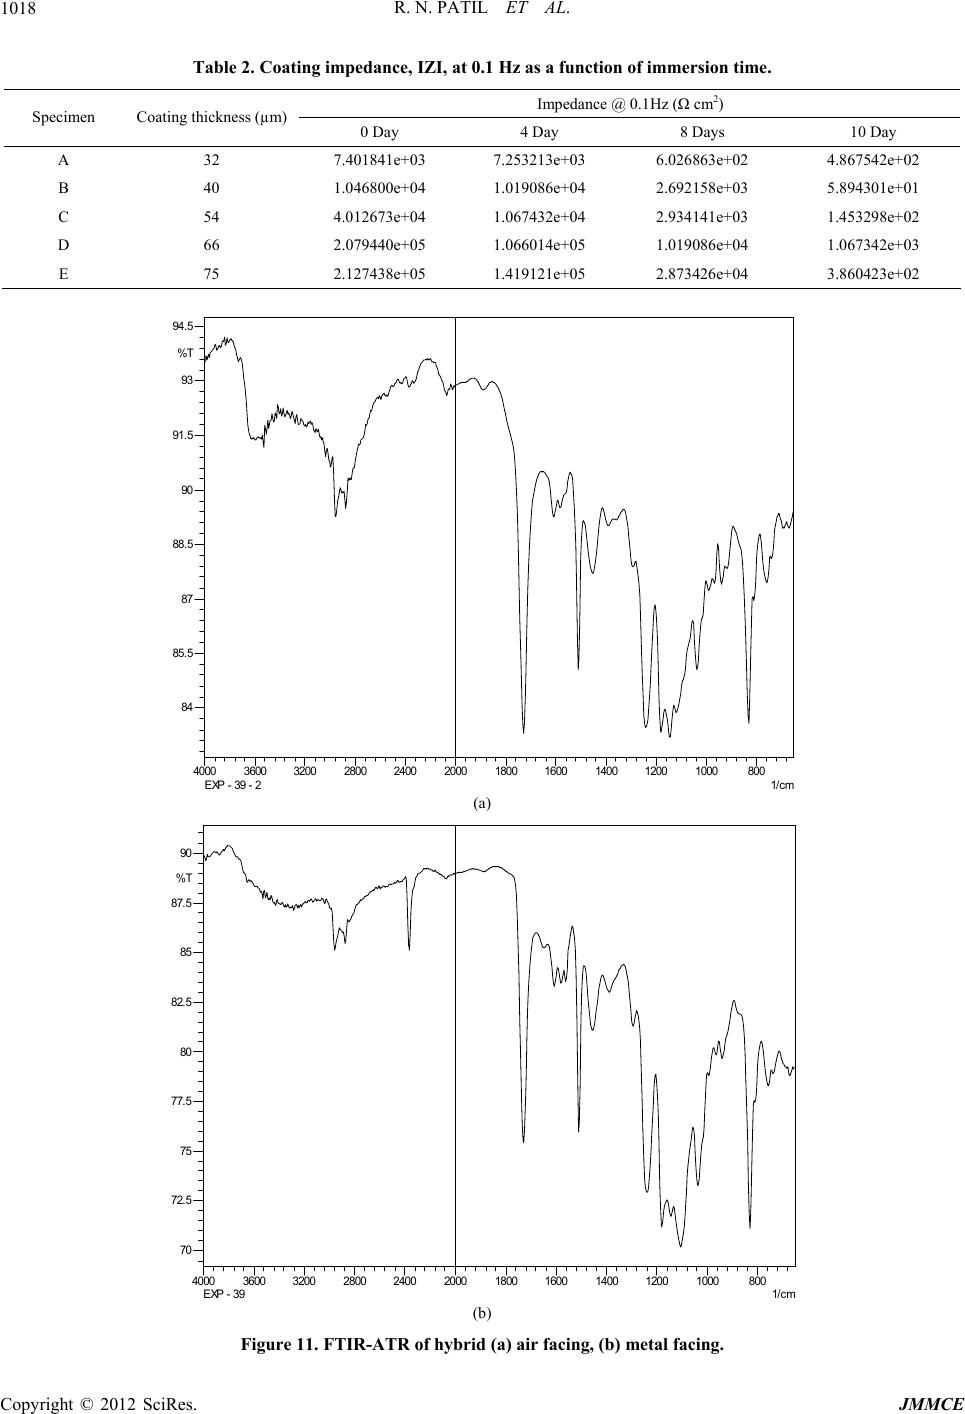
Figure 11 demonstrates the representative FTIR spec-
tra for the air-facing side and Fig: metal-facing side of
the hybrid containing. The peak at 1508 cm1 for stretch-
ing of paraphenyl of epoxy resin and 1729 cm1 for the
absorption of carbonyl group of acrylates. Absorbance
intensity of 1508 cm1 peak at the metal facing side is
higher than those at air-facing side, suggesting that the
epoxy resin part in emulsion tends to move to the metal
facing side. The driving force of this movement could be
attributed to the difference in the surface free energy be-
tween the epoxy resin and the acrylic copolymer. The
critical surface tensions of poly butyl acrylate, poly-
acrylic acid, poly methyl methacrylate and poly 2-hy-
doxyl ethyl methacrylate are around 31, 11.1, 39 and 37
mN/m, respectively [5], so the critical surface tension of
the acrylic copolymer should be between 11 and 37
mN/m, which is lower than that of the epoxy resin, which
is around 44 mN/m.
Thus, during the process of casting and drying the hy-
brid films, the acrylic-copolymer segments tried to seg-
regate near the air-facing layer and the epoxy segments
moved to the mold-facing side to minimize the surface
energy. This migration is very beneficial because epoxy
resins have excellent adhesion to substrates improving
corrosion resistance, while acrylic copolymers remaining
on the air-facing side have very good weatherability and
appearance.
The water absorbance of coatings due to the presence
of hydrophilic acrylate monomers affects the capacitance
of coatings. The measurement of the water absorption
using EIS techniques is based on the determination of the
changes of coating capacitance. The coating capacitance
can be calculated from the EIS data C = 1/IZI at the fre-
quency of 1/2Π Hz. The water absorption can be calcu-
lated by the formula given by Hartshorn et al. [6].
2
t0 HO
logCClog





where ω is the volume fraction of the absorbed water, Ct
is the coating capacitance at time t, C0 is the capacitance
at t = 0, and 2
HO
is the dielectric constant of water. In
this investigation, the coating capacitance measured im-
mediately after immersion is taken as C0. The calculated
ω using the capacitance values obtained in this work are
summarized in Table 1.
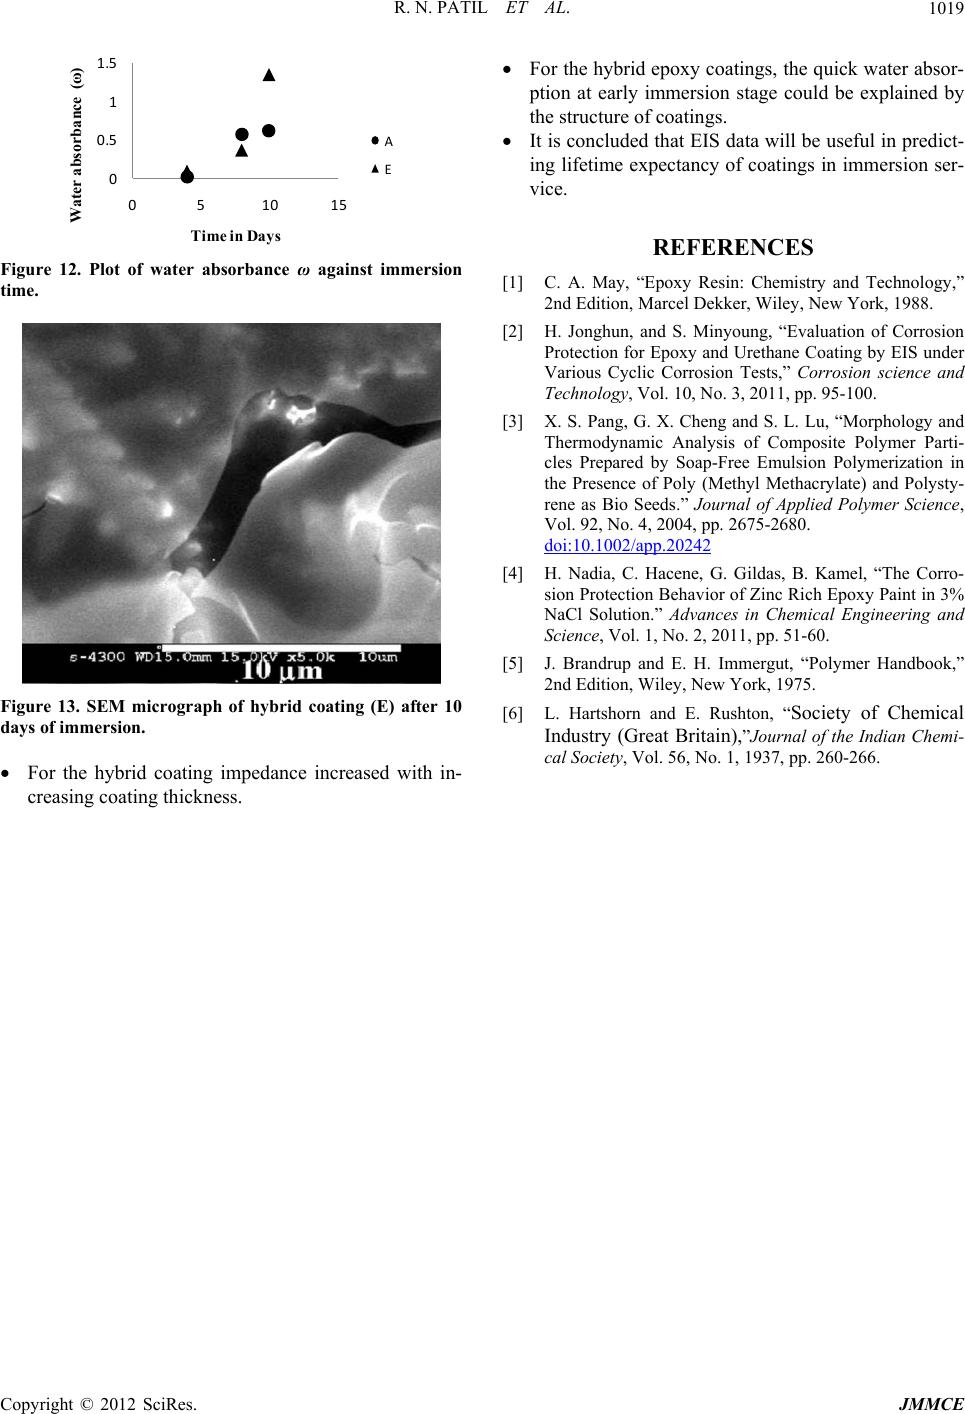
The plote of water absorbance aginst immersion time
for specimen A and E are shown in Figure 12. A close
examination of the data in Tables 1 and 2 re- veals that
correlation between IZI and ω during the im- mersion
tests, indicating that the decrease of IZI was due mainly
to the water absorption in the coatings. For the thin hy-
brid epoxy coatings tested in this investigation, the rapid
water absorption in the first four days of im- mersion
could be best explained by the capillary action in the
micro pore/defect structures, which was followed by a
slow water dissolution in the coatings. The water ab-
sorption for thicker coatings during 10 days of testing
suggested that, the rates of homogeneous water dissolu-
tion into the coatings were slow. The high performance
of this type of coating has been reflected by EIS data
measured during 10 days of immersion. Figure 13 repre-
sents SEM micrograph for specimen after immersion test.
Micrograph showing the degradation of hybrid coatings
after 10 days of immersion test.
2.6. Conclusions
Hybrid one pack epoxy coating was found to be effe-
ctive as a protective coating against corrosion resi-
stance.
Corrosion of substrate by the ingress of ionic species
through coating, increases disbonding between coat-
ing and substrate, which promotes the degradation of
coating by the dual action of chemicals and mecha-
nical processes.
Copyright © 2012 SciRes. JMMCE
R. N. PATIL ET AL.
Copyright © 2012 SciRes. JMMCE
1018
Table 2. Coating impedance, IZI, at 0.1 Hz as a function of immersion time.
Impedance @ 0.1Hz ( cm2)
Specimen Coating thickness (µm) 0 Day 4 Day 8 Days 10 Day
A 32 7.401841e+03 7.253213e+03 6.026863e+02 4.867542e+02
B 40 1.046800e+04 1.019086e+04 2.692158e+03 5.894301e+01
C 54 4.012673e+04 1.067432e+04 2.934141e+03 1.453298e+02
D 66 2.079440e+05 1.066014e+05 1.019086e+04 1.067342e+03
E 75 2.127438e+05 1.419121e+05 2.873426e+04 3.860423e+02
80010001200140016001800200024002800320036004000 1/cm
84
85. 5
87
88. 5
90
91. 5
93
94. 5
%T
EXP - 39 - 2
(a)
80010001200140016001800200024002800320036004000 1/cm
70
72.5
75
77.5
80
82.5
85
87.5
90
%T
EXP - 39
(b)
Figure 11. FTIR-ATR of hybrid (a) air facing, (b) metal facing.
R. N. PATIL ET AL. 1019
0
0.5
1
1.5
0510 15
Water absorbance (ω)
Time in Days
A
E
Figure 12. Plot of water absorbance ω against immersion
time.
Figure 13. SEM micrograph of hybrid coating (E) after 10
days of immersion.
For the hybrid coating impedance increased with in-
creasing coating thickness.
For the hybrid epoxy coatings, the quick water absor-
ption at early immersion stage could be explained by
the structure of coatings.
It is concluded that EIS data will be useful in predict-
ing lifetime expectancy of coatings in immersion ser-
vice.
REFERENCES
[1] C. A. May, “Epoxy Resin: Chemistry and Technology,”
2nd Edition, Marcel Dekker, Wiley, New York, 1988.
[2] H. Jonghun, and S. Minyoung, “Evaluation of Corrosion
Protection for Epoxy and Urethane Coating by EIS under
Various Cyclic Corrosion Tests,” Corrosion science and
Technology, Vol. 10, No. 3, 2011, pp. 95-100.
[3] X. S. Pang, G. X. Cheng and S. L. Lu, “Morphology and
Thermodynamic Analysis of Composite Polymer Parti-
cles Prepared by Soap-Free Emulsion Polymerization in
the Presence of Poly (Methyl Methacrylate) and Polysty-
rene as Bio Seeds.” Journal of Applied Polymer Science,
Vol. 92, No. 4, 2004, pp. 2675-2680.
doi:10.1002/app.20242
[4] H. Nadia, C. Hacene, G. Gildas, B. Kamel, “The Corro-
sion Protection Behavior of Zinc Rich Epoxy Paint in 3%
NaCl Solution.” Advances in Chemical Engineering and
Science, Vol. 1, No. 2, 2011, pp. 51-60.
[5] J. Brandrup and E. H. Immergut, “Polymer Handbook,”
2nd Edition, Wiley, New York, 1975.
[6] L. Hartshorn and E. Rushton, “Society of Chemical
Industry (Great Britain),Journal of the Indian Chemi-
cal Society, Vol. 56, No. 1, 1937, pp. 260-266.
Copyright © 2012 SciRes. JMMCE