Journal of Cancer Therapy
Vol.4 No.2(2013), Article ID:30318,16 pages DOI:10.4236/jct.2013.42083
Mutation Status of KRAS, BRAF, PIK3CA and Expression Level of AREG and EREG Identify Responders to Cetuximab in a Large Panel of Patient Derived Colorectal Carcinoma Xenografts of All Four UICC Stages
![]()
1Signature Diagnostics AG, Potsdam, Germany; 2Experimental Pharmacology & Oncology Berlin-Buch GmbH, Berlin, Germany; 3Städtisches Klinikum Brandenburg GmbH, Klinik für Allgemein-und Viszeralchirurgie, Institut für Pathologie, Brandenburg an der Havel, Germany; 4Katholisches Krankenhaus St. Johann Nepomuk, Klinik für Allgemeine Chirurgie, Erfurt, Germany; 5HELIOS Klinikum Erfurt, Institut für Pathologie, Erfurt, Germany; 6Klinikum Magdeburg, Klinik für Allgemein-und Viszeralchirurgie, Institut für Pathologie, Magdeburg, Germany; 7DRK Kliniken Berlin-Köpenik, Klinik für Chirurgie, Institut für Pathologie, Berlin, Germany; 8Max Delbrück Center für Molekulare Medizin (MDC), Experimentale Pharmakologie, Berlin, Germany.
Email: *andre.rosenthal@signature-diagnostics.de
Copyright © 2013 Paulina Pechańska et al. This is an open access article distributed under the Creative Commons Attribution License, which permits unrestricted use, distribution, and reproduction in any medium, provided the original work is properly cited.
Received January 23rd, 2013; revised February 25th, 2013; accepted March 5th, 2013
Keywords: Colorectal Cancer; Xenograft; Mutation; Biomarker; Cetuximab
ABSTRACT
To advance preclinical testing of novel targeted drugs in colorectal cancer (CRC) we established a panel of 133 mouse xenograft models from fresh tumor specimens of 239 patients with CRC of all four UICC stages. A subgroup of 67 xenograft models was treated with cetuximab, bevacizumab and oxaliplatin as single agents. Mutation status of KRAS (G12, G13, A146T), BRAF (V600E) and PIK3CA (E542K, E545K, H1047R) was assessed in all xenografts by allelespecific real-time PCR. KRAS codon 61 was assessed by conventional sequencing. AREG and EREG expression levels were analyzed by real-time PCR expression assays. In the treatment experiment we observed response rates of 27% (18/67) for cetuximab, 3% (2/67) for bevacizumab, and 6% (4/67) for oxaliplatin. Classification based on KRAS, BRAF and PIK3CA mutation status identified 15 of the responders (sensitivity 83%, confidence interval at p = 0.05 (CI): 59% - 96%), and 38 nonresponders (specificity 78%, CI: 63% - 88%). If any mutation except in KRAS codon 13 were considered, the classifier reached sensitivity of 94% and specificity of 69%. We improved specificity of the classifiers to 90% and 86% respectively by adding AREG and EREG RNA expression thresholds retrospectively. In patient-derived xenograft models, we found a predictive classifier for response to cetuximab that is more accurate than established biomarkers. We confirmed its potential performance in primary human tumors. For patients, the classifier’s sensitivity promises increased response rates and its specificity limits unnecessary toxicity. Given the scope of our xenograft models across all UICC stages, this applies not only to mCRC but also to the adjuvant setting of earlier stages. The xenograft collection allows to mimic randomized phase II trials and to test novel drugs effectively as single agents or in combinations. It also enables the development of highly accurate companion diagnostics as demonstrated by us for cetuximab.
1. Introduction
Based on the GLOBOCAN [1] estimates, 1.235.108 patients were diagnosed with colorectal cancer (10% of all cancer cases) in 2008 and there were 609.051 death incidences caused by CRC. Advances in pharmaceutical and surgical interventions led to improvement of the survival rates for colorectal cancer patients in the past few years. However, there is still a high medical need for effective diagnosis and treatment of CRC.
The standards of care and the five-year survival rates are very different for the individual clinical stages. For patients with UICC Stages I and II disease surgical resection of the primary tumor are the standard treatment. Stage II patients with certain pathological risk factors (T4 tumors, <12 inspected lymph nodes, lymphatic and venous vessel infiltration) [2] may receive additional chemotherapy. The 5-year survival rate for Stage I patients is 93% and decreases to 83% for Stage II patients. If the tumor affects local lymph node but has not spread to distant organs (Stage III patients) the 5-year survival rate is only approximately 60% despite the adjuvant therapy with FOLFOX, FOLFIRI or 5-FU/leucovorin regimes that follows the surgery. Once the tumor has spread to the liver or lung (Stage IV patients) the 5-year survival rate drops to 8% [3].
The high medical need in advanced stage of disease led to the development of various treatment options. A number of targeted monoclonal antibodies (mAbs) were developed over the last ten years and have been approved for the treatment of patients with metastatic CRC (mCRC). Cetuximab and panitumumab are mAbs directed against the EGF receptor, while bevacizumab targets the VEGFA ligand and inhibits neoangiogenesis. Cetuximab, panitumumab and bevacizumab have shown effectiveness as single-agents and/or in combination with chemotherapy in randomized phase III studies in advanced mCRC [4-8]. Cetuximab and panitumumab appear to have similar efficacy, achieving fairly modest objective response rates of approximately 10% - 20% when used in chemotherapy-refractory metastatic colorectal cancers [9,10]. The response rate of bevacizumab in heavily pretreated mCRC patients may be even smaller [11].
Low response rates and diminished effectiveness of the targeted drugs are a consequence of inefficient patient stratification prior to the treatment. In case of cetuximab it took many years to learn that neither the EGFR mutation status nor the EGFR expression are effective biomarkers for predicting response [12,13]. In the last four years intense translational clinical research led to the identification of predictive biomarkers in genes downstream of the EGF receptor including KRAS, BRAF, PIK3CA and others. Since 2009 cetuximab and panitumumab are restricted to patients with wild-type KRAS [14]. However, KRAS mutations explain only 45% - 55% of the resistant cases [15]. Moreover, recently it was shown that patients with mutations in codon 13 of KRAS actually benefited from the cetuximab or panitumumab treatment [16]. BRAF activating mutations including V600E were also linked with poor response to antiEGFR therapies. BRAF and KRAS mutations are mutually exclusive. BRAF mutations may account for an additional 10% of the resistant cases [17,18]. However, BRAF mutation testing is not yet required for patient selection by regulatory authorities for treatment decisions. In addition, the PIK3CA pathway has been reported to contribute to resistance to anti-EGFR treatment, but the role of PIK3CA mutations harbored by approximately 10% - 15% of patients remains controversial [19,20]. Oncogenic mutations in the NRAS gene, a homologue of KRAS, also result in resistance to anti-EGFR agents, but are far less frequent (2% - 4% of all cases) [21,22]. The RNA expression of amphiregulin (AREG) and epiregulin (EREG), ligands of the EGF receptor, may also be linked with response to cetuximab in KRAS wildtype patients [23]. These findings were recently confirmed in 144 mCRC patients with KRAS wildtype genotype. Out of 110 genes analyzed, a classifier containing AREG, EREG and two other genes, DUSP6 and SLC26A3 was proposed to yield the best predictive scores [24]. As well PTEN expression was linked with response to antiEGFR treatment [25].
Most of the clinical efficacy data for the three mAbs originate from clinical trials conducted in heavily pretreated, chemo-refractory mCRC patients. Surprisingly, cetuximab and bevacizumab did not show any advantage when added to the FOLFOX or XELOX backbone in chemotherapy naïve CRC patients with UICC stages II and III disease. The results of the N0147 trial with 2.664 stage III patients showed no disease-free survival (DSF) benefit when cetuximab was added to FOLFOX6 [26]. Analysis of KRAS showed also no DSF benefit in the KRAS wild type subgroup. Similarly, in the CO-8 study addition of bevacizumab to chemotherapy for adjuvant treatment of stages II and III patients failed to show any benefit [27]. These negative results were confirmed in the AVANT trial with 2.867 patients [28]. Thus, neither cetuximab nor bevacizumab are clearly effective in nonmetastatic CRC and KRAS mutation status is not a predictive biomarker for cetuximab in the adjuvant setting.
In order to systematically search for predictive biomarkers across all four stages of colorectal cancer with respect to approved targeted drugs and to novel experimental drugs we established a panel of 133 xenografts derived from human chemonaive colon-cancer specimens of all four UICC stages. We tested the response/resistance towards approved targeted mAbs including cetuximab and bevacizumab as well as towards the standard chemotherapy agent oxaliplatin in a panel of 67 xenograft models. Mutation status of KRAS, BRAF and PIK3CA and expression levels of AREG, EREG and other selected genes were analyzed with the aim to establish an accurate predictive biomarker panel of response to cetuximab.
2. Patients and Methods
2.1. Patients
All fresh human tumor tissue samples originated from a multi-center prospective study “Molecular Signatures in Colorectal Cancer” (MSKK). 239 fresh tumor tissue samples from patients of all four UICC stages were collected over two years by a collaborating network of four clinics, using a standardized procedure. In parallel, clinical data were collected and monitored for each patient. All patients gave written informed consent prior to surgery. The MSKK study was approved by the relevant ethics committees.
2.2. Engraftment of Xenograft Models and Treatment Experiments
Shortly after surgery two hundred and thirty-nine fresh tumor samples originating from the MSKK study were cut into pieces of 3 to 4 mm and transplanted within 30 min to 3 - 6 immunodeficient NOD/SCID mice (Taconic). Hundred and forty-nine out of 239 samples (62%) were successfully engrafted. Of these, 133 models fulfilled the QC criteria of the study. In this way a panel of 133 stably passagable, patient-derived colorectal cancer xenografts could be established as permanent tumor models.
A subset of 67 engrafted xenograft models was used in therapy experiments testing response towards cetuximab, bevacizumab and oxaliplatin as single-agents. At a size of approximately 1 cm3, tumors were removed and passaged to naive NMRI: nu/nu mice (Charles River). Treatment was initiated at palpable tumor volume (50 - 100 mm3). For each of the 67 human derived xenograft models, 5 mice were randomized to each drug and 5 for a vehicle control group. Doses and schedules were chosen according to previous experience in animal experiments and represent the maximum tolerated or most efficient doses (see Table 1). The injection volume was 0.2 ml/20 g body weight. Tumor size was measured in two dimensions twice a week with a caliper-like instrument. Individual tumor volumes (V) were calculated by the formula: V = (length + [width] 2)/2 and related to the values at the first day of treatment (relative tumor volume). Median treated to control (T/C) values of relative tumor volume were used for the evaluation of each treatment modality and categorized according to scores (− to ++++; see Table 2).
All animal experiments were done in accordance with the United Kingdom Coordinating Committee on Cancer Research regulations for the Welfare of Animals and of the German Animal Protection Law and approved by the local responsible authorities (Landesamt für Gesundheit und Soziales).
2.3. DNA and RNA Isolation
Between 10 and 100 of 4 μm—thick snap frozen tissue sections were used for DNA and RNA isolation. Ge-
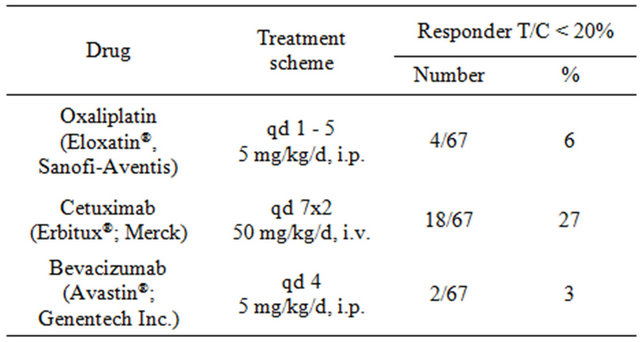
Table 1. Treatment scheme and response rates of the 67 pharmacologically characterized xenograft models. Treatment groups consist of 15 and control group of 5 animals each. T/C values represent the treated to control ratios of relative median tumor volumes.
nomic DNA and total RNA were simultaneously extracted with AllPrep DNA/RNA Mini Kit (Qiagen). Twelve samples were processed simultaneously using an automated protocol on the QIACube instrument (Qiagen). For FFPE material a minimum of two 20 μm sections of archived primary tumor tissues were used for DNA isolation (Invitek; Invisorb Spin Mini Tissue, modified) and RNA isolation (Qiagen; miRNeasy Mini Kit). DNA and RNA concentrations (ng/μl) were measured using UV spectrophotometer (Nanovue, GE Healthcare). The quality of DNA was assessed by 1.5% agarose gel electrophoresis and the quality of RNA on the Agilent 2100 bioanalyzer (RIN > 4).
2.4. Mutation Analysis by Real-Time PCR
Mutation analysis was performed by allele-specific realtime PCR (Custom TaqMan SNP Genotyping Assays, Applied Biosystems). TaqManMGB assays were designed for each of the following: 8 substitutions in the KRAS gene (G12S, G12C, G12R, G12D, G12V, G12A, G13D, and A146T); the most frequent mutation in the BRAF gene (V600E); and 3 hotspots in the PIK3CA gene (E542K, E545K, H1047R). As positive controls for the TaqManMGB assays we used 12 different cancer cell lines. Mutations in codon 61 of the KRAS gene were analyzed by direct sequencing in the samples that showed no mutation in codon 12 and 13 (for detailed information see Supplementary Experimental Procedures).
2.5. Expression Analysis of Selected Genes by Real-time PCR
Expression analysis of five selected genes was performed in 67 xenograft tissues as well as in the corresponding primary tumors. Reverse transcription was performed with TaqMan Reverse Transcription Reagents. RNA expression of AREG, EREG, PTEN, DUSP6 and SLC26A3
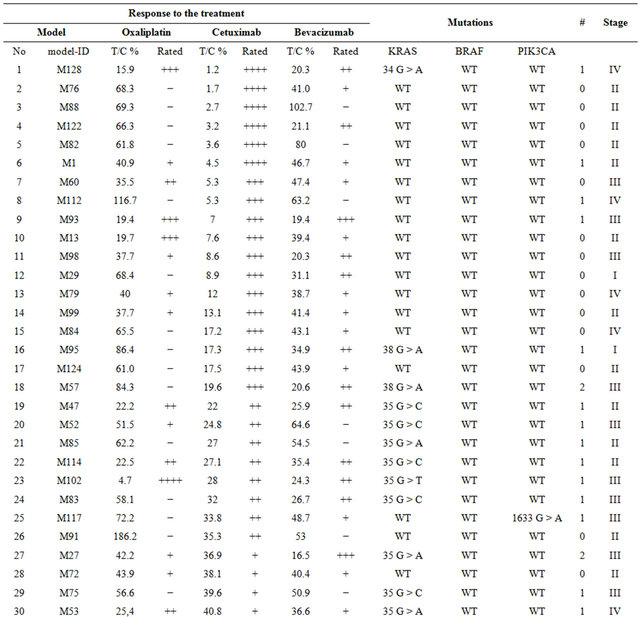
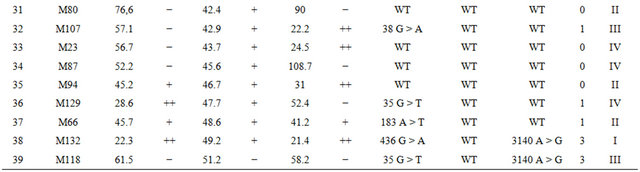
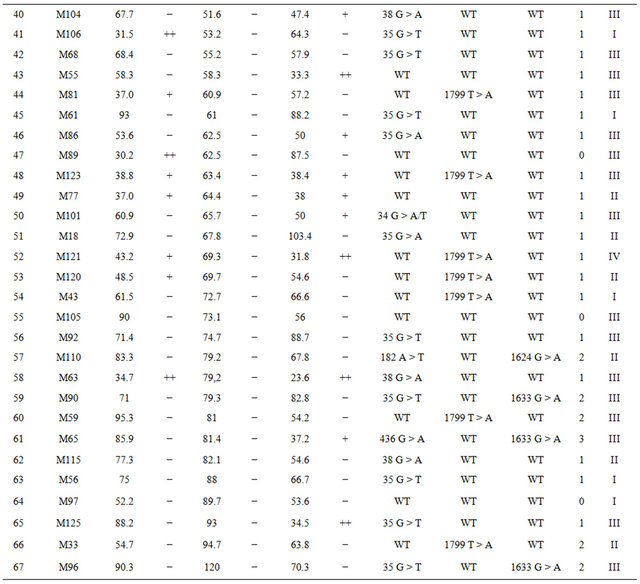
Table 2. Detailed information on the response to oxaliplatin, cetuximab, bevacizumab and mutation status in the 67 xenograft models. T/C values represent the treated-to-control ratios of relative median tumor volumes; *Rating: If T/C: >50: “−”, 36 - 50: “+”, 21 - 35: “++”, 6 - 20: “+++”, <5: “++++”.
Continued
was analyzed by TaqMan real-time PCR and normalized toward three housekeeping genes GAPDH, RPLP0 and UBC. Analysis was performed in triplicates according to the manufacturer’s instructions (Applied Biosystems). Pearson Correlation Coefficients (PCC) between response to cetuximab (1) and resistance (−1) and log-transformed expression measurements of AREG, EREG, PTEN, DUSP6 and SLC26A3 were calculated.
2.6. Genome-Wide Expression Profiling by Affymetrix U133 plus 2.0 Arrays
Expression analysis was performed for 254 samples, consisting of 127 pairs, each composed of an original sample of a primary colorectal tumor and its corresponding xenograft. Two hundred and fifty ng of total RNA was amplified and labeled using the MessageAmp Premier RNA Amplification Kit (Ambion). After in vitro transcription 15 μg aRNA was hybridized for 16 h at 45˚C to an Affymetrix U133 plus 2.0 GeneChip. The microarrays were washed and stained in the Affymetrix Genechip Fluidics Station 450. Scanning was performed with Affymetrix GeneChip Scanner 3000. Commercial human brain reference RNA (Ambion) served as a control.
2.7. Statistical Methods
Condensation of all 254 raw CEL files was performed with FARMS/INI [29] and left 18.018 informative probesets from the original 54.000 probesets. The Wilcoxon rank sum statistic between the group of xenografts and original samples for each probeset was applied to identify probesets that are specific to the difference of xenograft vs. native tumor. To compare a xenograft to its primary tissue source, each RNA microarray measuring more than 54.000 transcripts was placed in a high dimensional Euclidian space to establish a concept of distance. The primary tissue source of a xenograft was identified when the xenograft’s RNA measurement was closer in distance to the measurement of the primary sample from the same source than to all other samples in a sufficiently large comparison set.
3. Results
3.1. Engraftment, Characterization and Quality Control of Xenograft Models
Within the framework of a prospective multicenter MSKK study we transplanted 239 primary tumor specimens from CRC patients of all four stages into immunodeficient mice and established initially 149 passagable xenograft models. We observed an engraftment rate of 62%. Histopathological examination revealed a high morphological similarity between original patient carcinoma and the xenografts derived thereof. Further histological analysis and QC of the clinical data of the patients led to the exclusion of 16 xenograft models due to the engraftment of 1) metastases originated from other primaries, 2) adenoma, 3) tumor specimen from patients which received neoadjuvant treatment prior to surgery and 4) due to withdrawal of informed consent. Finally 133 high quality xenograft models passed all QC. The distribution of UICC stages II, III and IV in the 133 xenograft models is not statistically different (p = 0.14) to the stage distribution in a larger clinical cohort of 3.394 patients with colorectal cancer of stages II, III and IV that were recruited to the MSKK study. We observed a statistical difference in UICC stage I due to the fact that for the small T1 tumors there were often not enough tumor specimen available for engraftment without compromising the histopathological diagnosis.
Genome-wide gene expression analysis of 127 pairs of primary human tumors and their corresponding xenografts revealed that primary tumors and their matched xenografts were more similar to each other (Spearman correlation of 0.80) than pairs of primary tumors (Spearman correlation of 0.66) or pairs of xenograft tissues (Spearman correlation 0.69). Statistical analysis of genome-wide array expression data shows that the recognition rate of paired xenograft/primary tumor tissues increases from 67% to 75% with the number of probesets removed from the total number of 18.000 informative probesets (Figure 1) obtained by normalization with FARMS [29].
3.2. Overall Response to Cetuximab, Bevacizumab and Oxaliplatin
In therapy experiments 67 of the 133 available xenograft models were treated with cetuximab, bevacizumab and oxaliplatin as single-agents.
According to UICC staging, there were 8 xenograft models derived from UICC stage I patients, 22 xenograft models from UICC II patients, 28 models from UICC III patients, and 9 models from UICC IV patients.
Responder models were defined with treated-to-control (T/C) ratios (volume of the treated tumor in relation to the non-treated control) of <20%. Nonresponder (resistant) models were defined with T/C ratios greater than 20%.
Altogether 20 models (30%) responded to at least one of the three agents. Eighteen of 67 models (27%) showed a strong response toward cetuximab monotherapy, four models (6%) responded to oxaliplatin and only two models (3%) responded to bevacizumab (Table 1).
Among the 18 cetuximab responders there were 6 models with almost complete shrinkage of the tumor (T/C <5%). Among the 49 non-responders there were 8 models with T/C ratio between 20% - 35%; 12 models with T/C ratio of 35% - 50% and 29 models with T/C ratio >50% (for details see Table 2).
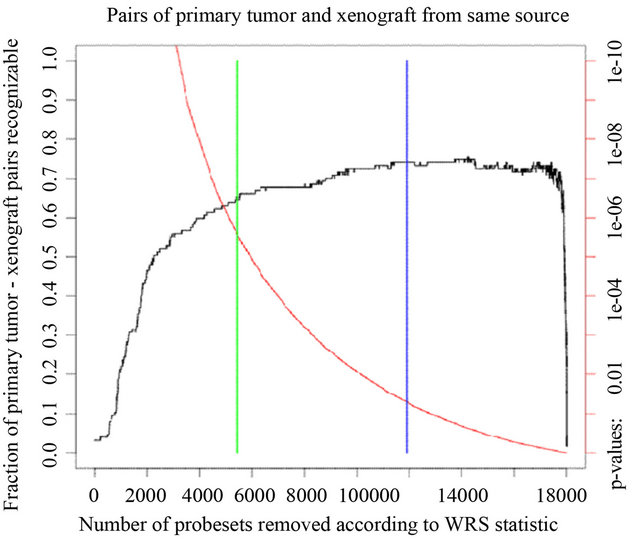
Figure 1. Recognition of primary tumor/xenograft pairs originating from the same patient. We ordered mRNAs by increasing p-value in a Wilcoxon rank sum test for difference between xenografts and primary tumors along the x axis. The red curve shows the p-value (right scale). The blue bar marks the p-value of 5%, the green bar marks the Bonferroni adj. p-value for multiple testing. The black curve (scale on the left) shows the fraction of same-source primary tumor/xenograft pairs that were identified after leaving out probesets with p-values below the threshold on the x-axis.
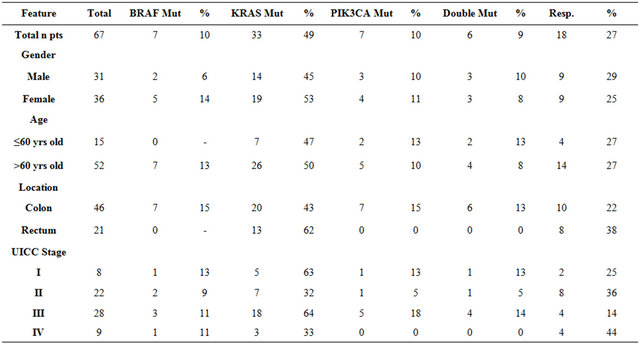
No difference was observed in cetuximab response in relation to gender (25% of male patients vs. 29% of female patients) or age (27% of < 60 yrs old vs. 27% > 60 yrs old). 46 out of 67 models were derived from colon cancer and 21 from rectal cancer patients. More rectal tumors responded toward cetuximab than colon tumors (38% vs. 22%). There were 2 cetuximab responders among 8 stage I xenograft models, 8 among 22 stage II models, 4 among 28 stage III models, and 4 among 9 stage IV models (Table 3).
3.3. Mutation Status and Cetuximab Response
Mutation status was assessed in tumor tissue of the 67 tumor xenografts and in the matched primary tumor tissues of the corresponding patients using allele-specific PCR (Tables 2 and 3). Altogether we observed at least one mutation in 41/67 (61%) xenograft models. Within this group of 41 models there were 35 single mutations: 27 in KRAS, 7 in BRAF and one in PIK3CA. In 6/67 (9%) models mutations in two genes were observed in KRAS and PIK3CA. KRAS and BRAF mutations were mutually exclusive. For KRAS, there were 23 mutations in codon 12, 6 mutations in codon 13, 2 mutations in codon 61, and 2 mutations in codon 146. Five mutations were detected in exon 9 and two in exon 20 of PIK3CA. We also analyzed the mutation status in the corresponding primary patient tumors and identified identical mutations for each matched pair of primary and xenograft tumors.
Of the 18 cetuximab responders, 15 are wildtype in KRAS. The remaining three responders harbor mutations in the KRAS gene (one mutation in codon 12 and two in codon 13). All 18 cetuximab responders are wildtype in BRAF and PIK3CA (Table 3). If only the wild type status of KRAS, BRAF and PIK3CA is considered for predicting cetuximab response, this corresponds to a sensitivity (S+) of 83% (15/18 responders identified) and a specificity (S−) of 78% (38/49 non-responders identified).
The 38 G > A mutation in codon 13 of KRAS was linked by De Roock et al. [16] with improved response to cetuximab compared to KRAS mutations in codon 12. We observed six 38 G > A mutations in codon 13 of KRAS in our data set. Two codon 13 mutants are responders and four were resistant to cetuximab. A response predictor based on the combination of wildtype KRAS, BRAF, PIK3CA and KRAS codon 13 mutations has therefore a sensitivity of 94% (17/18) and a specificity of 69% (34/53).
3.4. RNA Expression Analysis of AREG and EREG and Other Genes
Beside mutation analysis we performed as well an analysis on the gene expression level. We analyzed RNA expression of AREG, EREG, PTEN, DUSP6 and SLC26A3 using TaqMan real-time PCR and found a significant
Table 3. Mutation distribution and response to cetuximab in a group of 67 xenograft models in respect to the baseline patient characteristics.
correlation between high expression of AREG and EREG (low Ct values) and response to cetuximab (Figure 2). The Pearson Correlation Coefficient (PCC) for AREG and EREG is 0.58 and 0.52, respectively. PTEN expression was not correlated with cetuximab response (PCC = 0.06), while DUSP6 and SLC26A3 revealed a weak correlation (PCC = 0.31 and 0.34). For 67 cases a correlation of greater than 0.2 is significant.
Correlation of expression of both EGFR ligands improved by combining expression values with T/C ratios of tumor volumes (AREG: PCC = 0.63; EREG: PCC = 0.63). In the group of xenograft models with KRAS wildtype the association was even stronger (AREG: PCC = 0.72; EREG: PCC = 0.75).
If AREG and EREG expression is added to our predictor based on mutation status of KRAS, BRAF and PIK3CA and excluding KRAS codon 13 mutations for cetuximab response the specificity will increase from 69% to 86% while sensitivity is still 94%.
3.5. Receiver Operating Characteristic (ROC) Curves
ROC curves were constructed to depict the differences of the accuracy of various biomarkers. Four biomarkers combinations were taken under consideration as responsible for cetuximab resistance: 1) KRAS mutation codon 12 and codon 13; 2) Any mutation in KRAS, BRAF and PIK3CA; 3) Any mutation in KRAS, BRAF and PIK3CA without KRAS codon 13 mutations, and 4. Any mutation in KRAS, BRAF and PIK3CA without KRAS coding 13 mutations and mean AREG and EREG RNA expression (Figure 3). The areas under the curve (AUC) for the four different scenarios are 0.682, 0.804, 0.819 and 0.959.
4. Discussion
Current clinical development guidelines and ethical considerations restrict the testing of a novel cancer drug in colorectal cancer to heavily pretreated mCRC patients in
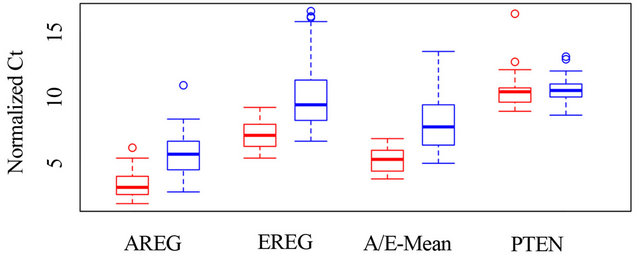
Figure 2. The graph shows box plots for the distribution of normalized Ct values, separately for responders and nonresponders, each for AREG, EREG, for the distribution of their means, and for PTEN. The boxes show the range from the first to the third quartile, the thick line shows the median and the interrupted lines show the 95% confidence interval. Values outside of this interval are shown as circles.
3rd line. These patients have been exposed to cetuximab with irinotecan (1st line) and bevacizumab in combination with FOLFOX (2nd line) or vice versa. A significant fraction of the mCRC patients were originally diagnosed with CRC of UICC stages II and III (Dukes B and C) and have already received six cycles of chemotherapy with FOLFOX4 or FOLFOX6 regimes before they developed liver or lung metastases. All mCRC patients considering 3rd line treatment options have often only weeks to live. It is extremely difficult to demonstrate efficacy of novel investigational drugs in such heavily pretreated mCRC patients as novel drugs would have to be randomized against the already approved antibodies cetuximab, panitumumab and bevacizumab plus their corresponding chemotherapy backbone. For new targeted therapies this requirement represents a huge barrier and may delay the process of bringing novel targeted drugs from the laboratory to the patients. Also, in heavily pretreated mCRC patients access to primary FFPE or frozen tissue for identification of biomarkers that can be used for predicting drug response is challenging and often impossible. As a result the discovery and validation of molecular markers from primary tumor tissue and the development of companion diagnostics in mCRC is extremely difficult. Only once a drug has moved from 3rd line to first line treatment or to the adjuvant setting, can the access to tumor tissue be logistically included in the design of the clinical studies. The clinical development of cetuximab, panitumumab and bevacizumab in metastatic colorectal cancer serves as good example to demonstrate this loophole.
In addition to the challenges in clinical development there are insufficient preclinical resources for the development of novel targeted cancer drugs. For many years
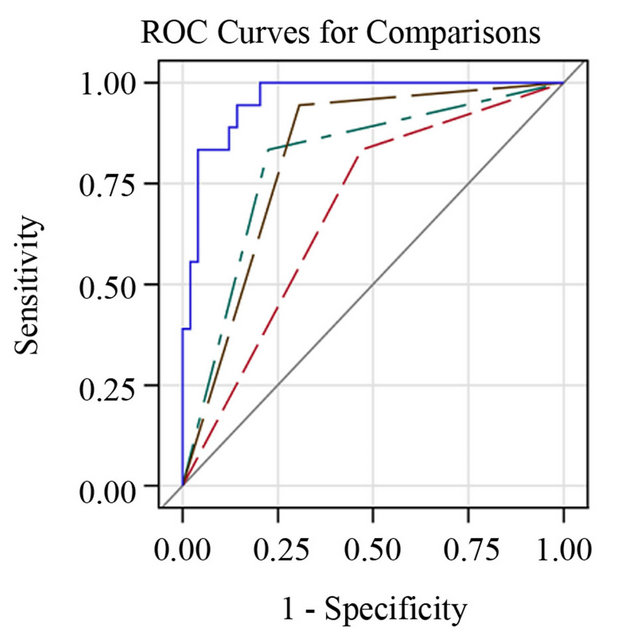
Figure 3. Receiver operating characteristic (ROC) curve for prediction of patient response to cetuximab by: Model 2: all analyzed mutations in KRAS, BRAF, and PIK3CA; Model 3: by mutations in KRAS (excluding codon 13 mutations), BRAF and PIK3CA; Model 4: by mutations in KRAS (excluding codon 13 mutations), BRAF and PIK3CA combined with RNA expression of AREG and EREG. A) In the set of 67 xenograft models; AUC = 0.92, B) in the Snap Frozen tissues of corresponding primary patient tumors; AUC = 0.90.
in in-vitro studies individual cancer cell lines or large panels of cancer cell lines (e.g. the NCI60 panel) have been used for testing investigational drugs and to explore potential biomarkers [30]. In addition, xenograft models derived from such cancer cell lines were extensively used to show preclinical efficacy of novel drugs and to verify potential biomarkers. Due to the failure of many investigational cancer drugs in randomized phase III studies the community is now much more aware that data from such preclinical studies are not sufficient and have to be handled with caution with respect to forecasts on clinical efficacy of investigational drugs. Obviously large panels of cancer lines like the NCI60 panel and collections of xenografts derived thereof are not sufficient substitutes for clinical tumor specimens as they do not adequately reflect the cellular heterogeneity of the tumor, especially the complexity of the tumor/stromal interaction [30].
4.1. Advantages of Large CRC Xenograft Panel
To address this unmet clinical need in testing investigational drugs and predictive biomarker development we established a large series of 133 well characterized xenograft models. The xenografts are derived of fresh primary tumor specimens of patients with colorectal cancer across all four UICC stages (Dukes A-D). The primary tumor tissues are part of a large multicenter prospective study (MSKK) with more than 5.500 recruited patients with confirmed CRC. To our knowledge this xenograft panel is the largest developed panel of primary tumor tissue in a single cancer indication.
The xenograft models and their primary tumors have been characterized by extensive mutation analysis and genome-wide array-based expression analysis. Mutation analysis in 133 xenograft models and matched primary tumor tissue showed that KRAS, BRAF and PIK3CA mutation status is completely retained in the xenograft models with respect to the primary tissues. We also compared the mutation frequency of KRAS (33%), BRAF (13%) and PIK3CA (13%) in the panel of the 133 xenograft models with the mutation frequencies in the COSMIC database (KRAS 33%, BRAF 13%, PIK3CA 16%) [31] and found no significant differences. Thus the engraftment process did not result in a biased selection of tumors with higher oncogenic KRAS, BRAF or PIK3CA mutations. The analysis of genome-wide RNA expression based on microarrays also indicates that tumors retained the characteristics of the original primary tumor samples on the global gene expression level. The difference in the expression pattern between original primary tumors and the derived xenografts can be localized to a fraction of the overall probesets, while the individual characteristics of the tumors shared by primary and corresponding xenograft are preserved as demonstrated by a mean Spearman correlation of 0.80 (95% CI 0.74 - 0.86). In comparison the mean Spearman correlation between pairs of primary tumor tissues was 0.66 (95% CI 0.64 - 0.68) and between pairs of xenograft tissues 0.69 (95% CI 0.67 - 0.70).
4.2. Response Rates of Approved Drugs in Xenograft Panel
To show proof-of-principle of this novel strategy three major cancer drugs approved in colorectal cancer were tested as single agents in the same 67 xenograft models. Five mice were used per each treatment and 5 mice for control group. Altogether 1.340 mice were used in the treatment experiment. We defined a T/C ratio of <0.20 for response and a T/C ratio of >0.20 for resistance in all treatment experiments. Based on these strict criteria cetuximab showed the highest response rate of 27% (18/67), followed by oxaliplatin with 6% (4/67) and bevacizumab with 3% (2/67).
The response rate of 27% for cetuximab monotherapy in our panel of xenograft models cannot be directly compared with historical data obtained in clinical trials. In the BOND study [4] which led to the original approval of the antibody a response rate (RR) of 10% was observed for cetuximab monotherapy while for the combination of cetuximab and irinotecan the RR was 23%. The difference between our therapy experiment in xenograft models and the BOND study is probably due to the fact that in our study chemotherapy naïve tumors of all four stages were treated with cetuximab monotherapy while in the original BOND study patients with advanced, irinotecan-refractory tumors were included.
Recently another panel of CRC patients-derived xenografts was created by Bertotti et al. [32]. Engrafted tissues derived however, not from primary tumors, but from CRC liver metastases. Forty-four of these metastatic models were treated with cetuximab resulting in tumor shrinkage in 5 cases (11%) disease stabilization in 14 cases, and disease progression in the remaining 28 cases. In comparison, a response rate of 27% was achieved in the primary tumors in our panel of models. In the study of Bertotti et al. cetuximab response was defined as regression of at least 50% in the tumor volume compared to the baseline tumor volume. Using this criterion the response rates were inferior in comparison to the results of our study in which more stringent criteria were applied. Moreover, there were no clinical data regarding potential previous treatment of the patients (e.g. adjuvant chemotherapy) from whom the liver metastases were resected. The differences in the design of the study, as well as the limited number of stage IV CRC tumors treated in our setting, make a comparison between the two studies difficult. To investigate whether the actual origin of the tumor tissue (primary/metastasis) makes a difference in terms of response to the treatment, an approach of comparing the response rate in both tissues originating from the same patients would be of high interest. Nevertheless, due to the lack of primary tumor tissue and matched liver and lung metastases such treatment experiment could not be performed to date. It is, however, possible that the difference in the efficacy of cetuximab between the two xenograft panels is not caused by the engrafted material, but rather by the dose and treatment schedule. In the study performed by Bertotti and colleagues, cetuximab was administered twice a week at a dose of 20 mg/kg, while in our setting daily doses of 50 mg/kg were given.
Oxaliplatin is the only platinum agent currently approved in colorectal cancer. It is a part of the FOLFOX4, FOLFOX6, CAPOX or XELOX regimes. When evaluated as single-agent with untreated CRC patients, oxaliplatin achieved response rates of 18% - 20% in a phase II study [33,34], while in previously treated patients objective response rates of 10% were reported in phase II studies [35]. However, the multicenter EFC 4584 trial, which led to the original approval of oxaliplatin, showed that the arm of the study that received oxaliplatin as a single agent resulted in an overall response rate (ORR) of only 1.3% [36]. In our panel of chemo-naive xenograft models we observed a response rate of 4/67 (6%) (95% CI: 2% - 15%), which is slightly higher than the data of the EFC 4584 trial, but in line with the effect of the drug in the FOLFOX or CAPOX combination.
Only 2 of the 67 (3%) xenograft models responded towards the anti-VEGFA antibody bevacizumab (95% CI: 1% - 13%). Bevacizumab is approved for use in combination with 5-FU-based chemotherapy as a 1st line or 2nd line treatment of metastatic colorectal cancer patients achieving a response rate of approximately 20%. Single-agent bevacizumab used in a treatment of advanced disease is inferior to combined therapy with chemotherapy and shows limited efficacy of 3.3% [37], which is comparable with our results of 3%. Interestingly, the two xenografts that responded to bevacizumab in our setting are derived of stage III patients, while recent results of a phase III clinical trial in patients with CRC of UICC stage II or III suggested no benefit for bevacizumab [38]. However, 9 further models had a T/C ratio between 0.20 and 0.25. If T/C ratio threshold was changed from 0.2 to 0.25, the response rate of bevacizumab would be 16%. Under the same criteria of T/C <0.25 the response rate of cetuximab would be 30%.
4.3. Cetuximab Response in Relation to Mutation Status of KRAS, BRAF, PIK3CA and RNA Expression of EGFR Ligands
Sporadic KRAS mutations were already reported within responders to anti-EGFR treatment [20,39]. In our panel of 67 xenograft models treated with cetuximab three out of the total of 18 cetuximab responding xenograft models (17%, CI: 4% - 41%) were found to carry mutations in the KRAS gene (Table 3). Two of the responders carried an alteration in codon 13 (G13D), which is known to be carried by approximately 19% of all the KRAS mutants [31]. Our result supports an observation that the position of the point mutation in the KRAS gene is associated with different sensitivity to anti-EGFR treatment. Functional differences between mutants in codon 12 and 13 of the KRAS gene were previously reported. Specimens carrying the mutation in codon 12 formed colonies of increased cell density, induced spontaneous anchorageindependent growth, and demonstrated reduced predisposition to enter apoptosis in comparison to the KRAS codon 13 mutants [40]. Our observation is in agreement with the recently published clinical observation that mutations in codon 13 may benefit from anti-EGFR treatment [16].
Most of current data support an observation that BRAF mutations are associated with resistance to cetuximab treatment, while the role of PIK3CA mutations as markers of resistance to cetuximab is still under discussion. There are studies reporting no correlation between PIK3CA mutation status and response under cetuximab treatment [41]. Results of a population based study conducted in 773 patients suggest that only PIK3CA exon 20 mutations are significantly associated with resistance to antiEGFR therapy [21].
We found only one xenograft model to carry a single PIK3CA mutation (E545K) in exon 9, that was classified as cetuximab nonresponder (T/C = 0.34). All the other six PIK3CA mutations were observed in combination with KRAS. The second mutation seems to enhance the oncogenic effect that results in the activation of the signaling pathway regardless of EGFR blocking. The mean of treated-to-control T/C ratios in the group of nonresponders carrying two mutations was 77% (95% CI: 57% - 89%) in comparison to 56% (95% CI: 48% - 64%) in the nonresponders with one mutation. The T/C ratios in the group of nonresponders carrying two mutations appear higher than those of nonresponders carrying one mutation. However, the difference in T/C rations is not statistical significant as the 95 CI intervals overlap.
We therefore think it is prudent to combine wildtype status for KRAS, BRAF and PIK3CA with KRAS mutation status in codon 13 in our classifier for predicting response to cetuximab. However, despite the predictive value of the KRAS, BRAF and PIK3CA mutations, we observed 11/49 (22% CI: 11% - 37%) nonresponders that did not carry a mutation in any of the three genes except the KRAS codon 13 mutation. Resistance in some of these can be explained by the presence of other activating mutations e.g. in NRAS that were not investigated in our study. These mutations are relatively rare (2% - 4%) [21] and cannot explain every resistant case. We plan to conduct NGS exome sequencing on these models to explore the underlying somatic changes in the cancer genomes of the resistant models in much higher resolution.
In order to increase the specificity of our predictor for nonresponse to cetuximab we also examined the RNA expression of several genes including AREG, EREG, PTEN, DUSP6 and SLC26A3 in addition to the mutation status of KRAS, BRAF and PIK3CA. A significant association of high expression of the two EGFR ligands AREG and EREG at mRNA level and sensitivity to cetuximab was confirmed in our study. The other analyzed genes PTEN, DUSP6 and SLC26A3 had no added value in our setting.
4.4. Clinical Benefit of the Predictive Marker Panel for Cetuximab Response
Today, KRAS mutation testing is performed routinely for codon 12 and 13. In our xenograft panel 38 models are wildtype in KRAS codon 12 and 13 while 29 models are mutated in the two codons. Of the 38 KRAS wildtype models 15 are responders and 23 are nonresponders. In the real clinical setting all 38 KRAS wildtype patients would receive cetuximab or panitumumab in combination with chemotherapy. Thus according to the routine KRAS codon 12 and 13 screening 15 patients would be correctly treated while 23 patients would be over-treated although these patients will not benefit from the anti EGFR treatment. This is reflected by the positive predictive value (PPV) of the standard approach of only 15/38 = 0.39 (Table 4, predictor 1), a negative predictive value (NPV) of 26/29 = 0.90 and an AUC of 0.682.
If KRAS testing involves codon 12, 13, 61 and 146 and if the mutation status of BRAF and PIK3CA is also included (Table 4, predictor 2) the PPV of this predictive panel increases to 15/26 = 0.58. While 15 patients would be treated correctly, only 11 of the 26 wildtype patients would be over-treated and would not benefit from the anti-EGFR treatment. The NPV of the second predictor is 38/41 = 0.93 and the AUC is 0.804.
If testing of KRAS codon 12, 13, 61 and 146, BRAF, and PIK3CA would be performed and if two of the KRAS codon 13 mutations would be counted as responder, the PPV of this predictive panel is only 17/32 = 0.53, as among 6 KRAS codon 13 mutants 2 responded and 4 were resistant to cetuximab. The NPV would however increase to 34/35 = 0.97. The AUC of this predictor is 0.819.
The most powerful predictor is the combination of
Table 4. Cross tabulation table shows the relation between response towards cetuximab and: Model 1: Mutation status in codon 12 and 13 of KRAS (standard patient selection procedure); Model 2: All mutation in KRAS, BRAF and PIK3CA; Model 3: All mutations in KRAS (excluding codon 13 mutations), BRAF and PIK3CA; Model 4: All mutations in KRAS (excluding codon 13 mutations), BRAF and PIK3CA, combined with RNA expression of AREG and EREG.
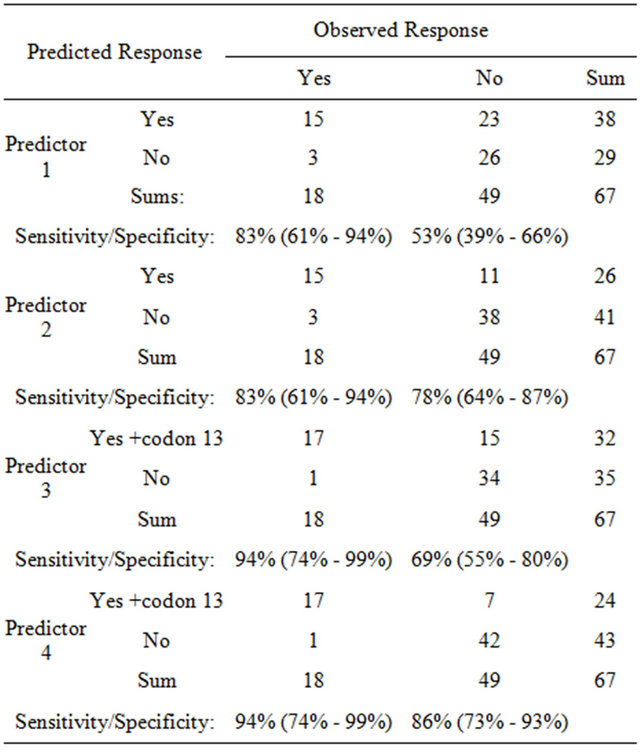
KRAS, BRAF, and PIK3CA mutation testing with the determination of RNA expression of AREG and EREG. Among the 24 patients with the wildtype KRAS, BRAF and PIK3CA and without KRAS codon 13 mutations are 17 responders and 7 nonresponder. Thus the PPV of this predictor is 17/24 = 0.71. Of the 43 patients with mutated genotype only 1 patient would be a true responder. Thus the NPV is 42/43 = 0.98. The AUC reaches 0.959.
Our best predictive panel of biomarkers obtained on the xenograft models that were derived from primary colorectal cancer specimens of all four stages is in agreement with a recently published study demonstrating predictive value of KRAS, BRAF mutation testing in combination with EREG RNA expression and skin rash in patients with mCRC treated with cetuximab and irinotecan in 2nd line [42].
5. Conclusions
In summary, a companion diagnostic combining KRAS, BRAF, PIK3CA mutation testing and RNA expression analysis of AREG and EREG shows a clear clinical benefit over standard KRAS codon 12 and 13 testing. This is demonstrated by a PPV of 0.71 and a NPV of 0.98 and an area under the curve (AUC) of 0.959.
High concordance of our results with the clinical data shows that our xenograft panel can be used to mimic randomized phase II studies and to systematically test novel targeted cancer drugs both in the metastatic CRC and in the adjuvant setting (UICC stages II and III). Therapy experiments can be done on subsets of the models preselected for a specific targeted cancer drug or combination of targeted drugs based on the available mutation genotype or expression profile. Also new biomarkers can be identified in parallel to testing of novel therapeutic agents based on the molecular data.
6. Acknowledgements
Part of the work was presented at the 102nd Annual Meeting of the American Association for Cancer Research, April 2-6, 2011, Orlando, Fla; and at the 2012 Annual Gastrointestinal Cancers Symposium of American Society of Clinical Oncology, January 19-21, 2012, San Francisco.
P. Pechańska, T. Mayr, B. Hinzmann, H.-P. Adams, K. Stecker are employees of Signature Diagnostics AG. K.- H. Kretschmar and K. Kretschmar work for Signature Diagnostics AG on a regular paid consultancy basis. H.-P. Adams is shareholder of Signature Diagnostics AG. A. Rosenthal is shareholder and CEO of Signature Diagnostics AG.
P. Pechańska is also Ph.D. student at the Humboldt University Berlin.
I. Klaman was employee of Signature Diagnostics AG and is now employee of Roche Molecular Diagnostics GmbH, Penzberg, Germany.
M. Becker is employee of EPO GmbH. J. Hoffmann is shareholder and CEO of EPO GmbH. I Fichtner is a consultant of EPO GmbH.
The work described in this manuscript was supported by grants from the Federal Ministry of Education and Research (BMBF) through Projektträger Jülich (PtJ) and the Federal Ministry of Economy (BMWi) through the ZIM program and by company grants of Signature Diagnostics AG and EPO GmbH.
REFERENCES
- A. Jemal, F. Bray, M. M. Center, J. Ferlay, E. Ward and D. Forman, “Global Cancer Statistics,” Cancer Journal for Clinicians, Vol. 61, No. 2, 2011, pp. 69-90. doi:10.3322/caac.20107
- B. Vicuna and A. B. Benson III, “Adjuvant Therapy for Stage II Colon Cancer: Prognostic and Predictive Markers,” Journal of the National Comprehensive Cancer Network, Vol. 5, No. 9, 2007, pp. 927-936.
- J. B. O’Connell, M. A. Maggard and C. Y. Ko, “Colon Cancer Survival Rates with the New American Joint Committee on Cancer Sixth Edition Staging,” Journal of the National Cancer Institute, Vol. 96, No. 19, 2004, pp. 1420- 1425.
- D. Cunningham, Y. Humblet, S. Siena, D. Khayat, H. Bleiberg, A. Santoro, D. Bets, M. Mueser, A. Harstrick, C. Verslype, I. Chau and E. Van Cutsem, “Cetuximab Monotherapy and Cetuximab plus Irinotecan in IrinotecanRefractory Metastatic Colorectal Cancer,” The New England Journal of Medicine, Vol. 351, No. 4, 2004, pp. 337-345. doi:10.1056/NEJMoa033025
- F. F. Kabbinavar, J. Schulz, M. McCleod, T. Patel, J. T. Hamm, J. R. Hecht, R. Mass, B. Perrou, B. Nelson and W. F. Novotny, “Addition of Bevacizumab to Bolus Fluorouracil and Leucovorin in First-Line Metastatic Colorectal Cancer: Results of a Randomized Phase II Trial,” Journal of Clinical Oncology, Vol. 23, No. 16, 2005, pp. 3697- 3705. doi:10.1200/JCO.2005.05.112
- L. B. Saltz, H. J. Lenz, H. L. Kindler, H. S. Hochster, S. Wadler, P. M. Hoff, N. E. Kemeny, E. M. Hollywood, M. Gonen, M. Quinones, M. Morse and H. X. Chen, “Randomized Phase II Trial of Cetuximab, Bevacizumab, and Irinotecan Compared with Cetuximab and Bevacizumab Alone in Irinotecan-Refractory Colorectal Cancer: The BOND-2 Study,” Journal of Clinical Oncology, Vol. 25, No. 29, 2007, pp. 4557-4561. doi:10.1200/JCO.2007.12.0949
- L. B. Saltz, S. Clarke, E. Diaz-Rubio, W. Scheithauer, A. Figer, R. Wong, S. Koski, M. Lichinitser, T. S. Yang, F. Rivera, F. Couture, F. Sirzen and J. Cassidy, “Bevacizumab in Combination with Oxaliplatin-Based Chemotherapy as First-Line Therapy in Metastatic Colorectal Cancer: A Randomized Phase III Study,” Journal of Clinical Oncology, Vol. 26, No. 12, 2008, pp. 2013-2019. doi:10.1200/JCO.2007.14.9930
- E. Van Cutsem, C. H. Kohne, E. Hitre, J. Zaluski, C. R. Chang Chien, A. Makhson, G. D’Haens, T. Pinter, R. Lim, G. Bodoky, J. K. Roh, G. Folprecht, P. Ruff, C. Stroh, S. Tejpar, M. Schlichting, J. Nippgen and P. Rougier, “Cetuximab and Chemotherapy as Initial Treatment for Metastatic Colorectal Cancer,” The New England Journal of Medicine, Vol. 360, No. 2009, pp. 1408-1417.
- E. Van Cutsem, M. Peeters, S. Siena, Y. Humblet, A. Hendlisz, B. Neyns, J. L. Canon, J. L. Van Laethem, J. Maurel, G. Richardson, M. Wolf and R. G. Amado, “OpenLabel Phase III Trial of Panitumumab plus Best Supportive Care Compared with Best Supportive Care alone in Patients with Chemotherapy-Refractory Metastatic Colorectal Cancer,” Journal of Clinical Oncology, Vol. 25, No. 13, 2007, pp. 1658-1664.
- L. B. Saltz, N. J. Meropol, P. J. Loehrer Sr., M. N. Needle, J. Kopit and R. J. Mayer, “Phase II Trial of Cetuximab in Patients with Refractory Colorectal Cancer That Expresses the Epidermal Growth Factor Receptor,” Journal of Clinical Oncology, Vol. 22, No. 7, 2004, pp. 1201-1208. doi:10.1200/JCO.2004.10.182
- M. H. Cohen, J. Gootenberg, P. Keegan and R. Pazdur, “FDA Drug Approval Summary: Bevacizumab plus FOLFOX4 as Second-Line Treatment of Colorectal Cancer,” The Oncologist, Vol. 12, No. 3, 2007, pp. 356-361. doi:10.1634/theoncologist.12-3-356
- K. Y. Chung, J. Shia, N. E. Kemeny, M. Shah, G. K. Schwartz, A. Tse, A. Hamilton, D. Pan, D. Schrag, L. Schwartz, D. S. Klimstra, D. Fridman, D. P. Kelsen and L. B. Saltz, “Cetuximab Shows Activity in Colorectal Cancer Patients with Tumors That Do Not Express the Epidermal Growth Factor Receptor by Immunohistochemistry,” Journal of Clinical Oncology, Vol. 23, No. 9, 2005, pp. 1803-1810. doi:10.1200/JCO.2005.08.037
- T. D. Barber, B. Vogelstein, K. W. Kinzler and V. E. Velculescu, “Somatic Mutations of EGFR in Colorectal Cancers and Glioblastomas,” The New England Journal of Medicine, Vol. 351, No. 27, 2004, p. 2883. doi:10.1056/NEJM200412303512724
- C. J. Allegra, J. M. Jessup, M. R. Somerfield, S. R. Hamilton, E. H. Hammond, D. F. Hayes, P. K. McAllister, R. F. Morton and R. L. Schilsky, “American Society of Clinical Oncology Provisional Clinical Opinion: Testing for KRAS Gene Mutations in Patients with Metastatic Colorectal Carcinoma to Predict Response to Anti-Epidermal Growth Factor Receptor Monoclonal Antibody Therapy,” Journal of Clinical Oncology, Vol. 27, No. 12, 2009, pp. 2091-2096. doi:10.1200/JCO.2009.21.9170
- A. Bardelli and S. Siena, “Molecular Mechanisms of Resistance to Cetuximab and Panitumumab in Colorectal Cancer,” Journal of Clinical Oncology, Vol. 28, No. 7, 2010, pp. 1254-1261. doi:10.1200/JCO.2009.24.6116
- W. De Roock, D. J. Jonker, F. Di Nicolantonio, A. Sartore-Bianchi, D. Tu, S. Siena, S. Lamba, S. Arena, M. Frattini, H. Piessevaux, E. Van Cutsem, C. J. O’Callaghan, S. Khambata-Ford, J. R. Zalcberg, J. Simes, C. S. Karapetis, A. Bardelli and S. Tejpar, “Association of KRAS p.G13D Mutation with Outcome in Patients with ChemotherapyRefractory Metastatic Colorectal Cancer Treated with Cetuximab,” JAMA, Vol. 304, No. 16, 2010, pp. 1812-1820. doi:10.1001/jama.2010.1535
- F. Di Nicolantonio, M. Martini, F. Molinari, A. SartoreBianchi, S. Arena, P. Saletti, S. De Dosso, L. Mazzucchelli, M. Frattini, S. Siena and A. Bardelli, “Wild-Type BRAF Is Required for Response to Panitumumab or Cetuximab in Metastatic Colorectal Cancer,” Journal of Clinical Oncology, Vol. 26, No. 35, 2008, pp. 5705-5712. doi:10.1200/JCO.2008.18.0786
- W. De Roock, V. De Vriendt, N. Normanno, F. Ciardiello and S. Tejpar, “KRAS, BRAF, PIK3CA, and PTEN Mutations: Implications for Targeted Therapies in Metastatic Colorectal Cancer,” The Lancet Oncology, Vol. 12, No. 6, 2011, pp. 594-603. doi:10.1016/S1470-2045(10)70209-6
- H. Prenen, J. De Schutter, B. Jacobs, W. De Roock, B. Biesmans, B. Claes, D. Lambrechts, E. Van Cutsem and S. Tejpar, “PIK3CA Mutations Are Not a Major Determinant of Resistance to the Epidermal Growth Factor Receptor Inhibitor Cetuximab in Metastatic Colorectal Cancer,” Clinical Cancer Research, Vol. 15, No. 9, 2009, pp. 3184-3188. doi:10.1158/1078-0432.CCR-08-2961
- A. Sartore-Bianchi, F. Di Nicolantonio, M. Nichelatti, F. Molinari, S. De Dosso, P. Saletti, M. Martini, T. Cipani, G. Marrapese, L. Mazzucchelli, S. Lamba, S. Veronese, M. Frattini, A. Bardelli and S. Siena, “Multi-Determinants Analysis of Molecular Alterations for Predicting Clinical Benefit to EGFR-Targeted Monoclonal Antibodies in Colorectal Cancer,” PLOS ONE, Vol. 4, No. 10, 2009, Article ID: e7287. doi:10.1371/journal.pone.0007287
- W. De Roock, B. Claes, D. Bernasconi, J. De Schutter, B. Biesmans, G. Fountzilas, K. T. Kalogeras, V. Kotoula, D. Papamichael, P. Laurent-Puig, F. Penault-Llorca, P. Rougier, B. Vincenzi, D. Santini, G. Tonini, F. Cappuzzo, M. Frattini, F. Molinari, P. Saletti, S. De Dosso, M. Martini, A. Bardelli, S. Siena, A. Sartore-Bianchi, J. Tabernero, T. Macarulla, F. Di Fiore, A. O. Gangloff, F. Ciardiello, P. Pfeiffer, C. Qvortrup, T. P. Hansen, E. Van Cutsem, H. Piessevaux, D. Lambrechts, M. Delorenzi and S. Tejpar, “Effects of KRAS, BRAF, NRAS, and PIK3CA Mutations on the Efficacy of Cetuximab plus Chemotherapy in Chemotherapy-Refractory Metastatic Colorectal Cancer: A Retrospective Consortium Analysis,” The Lancet Oncology, Vol. 11, No. 8, 2010, pp. 753-762. doi:10.1016/S1470-2045(10)70130-3
- T. S. Maughan, R. A. Adams, C. G. Smith, A. M. Meade, M. T. Seymour, R. H. Wilson, S. Idziaszczyk, R. Harris, D. Fisher, S. L. Kenny, E. Kay, J. K. Mitchell, A. Madi, B. Jasani, M. D. James, J. Bridgewater, M. J. Kennedy, B. Claes, D. Lambrechts, R. Kaplan and J. P. Cheadle, “Addition of Cetuximab to Oxaliplatin-Based First-Line Combination Chemotherapy for Treatment of Advanced Colorectal Cancer: Results of the Randomised Phase 3 MRC COIN Trial,” Lancet, Vol. 377, No. 9783, 2011, pp. 2103- 2114. doi:10.1016/S0140-6736(11)60613-2
- S. Khambata-Ford, C. R. Garrett, N. J. Meropol, M. Basik, C. T. Harbison, S. Wu, T. W. Wong, X. Huang, C. H. Takimoto, A. K. Godwin, B. R. Tan, S. S. Krishnamurthi, H. A. Burris III, E. A. Poplin, M. Hidalgo, J. Baselga, E. A. Clark and D. J. Mauro, “Expression of Epiregulin and Amphiregulin and K-Ras Mutation Status Predict Disease Control in Metastatic Colorectal Cancer Patients Treated with Cetuximab,” Journal of Clinical Oncology, Vol. 25, No. 22, 2007, pp. 3230-3237. doi:10.1200/JCO.2006.10.5437
- J. B. Baker, D. Dutta, D. Watson, T. Maddala, B. M. Munneke, S. Shak, E. K. Rowinsky, L. A. Xu, C. T. Harbison, E. A. Clark, D. J. Mauro and S. Khambata-Ford, “Tumour Gene Expression Predicts Response to Cetuximab in Patients with KRAS Wild-Type Metastatic Colorectal Cancer,” British Journal of Cancer, Vol. 104, No. 3, 2011, pp. 488-495. doi:10.1038/sj.bjc.6606054
- M. Jhawer, S. Goel, A. J. Wilson, C. Montagna, Y. H. Ling, D. S. Byun, S. Nasser, D. Arango, J. Shin, L. Klampfer, L. H. Augenlicht, R. Perez-Soler and J. M. Mariadason, “PIK3CA Mutation/PTEN Expression Status Predicts Response of Colon Cancer Cells to the Epidermal Growth Factor Receptor Inhibitor Cetuximab,” Cancer Research, Vol. 68, No. 6, 2008, pp. 1953-1961. doi:10.1158/0008-5472.CAN-07-5659
- R. M. Goldberg, D. J. Sargent, S. N. Thibodeau, M. R. Mahoney, A. F. Shields, E. Chan, S. Gill, M. S. Kahlenberg, S. Nair and S. R. Alberts, “Adjuvant MfolFOX6 plus or minus Cetuximab (Cmab) in Patients (pts) with KRAS Mutant (m) Resected Stage III Colon Cancer (CC): NCCTG Intergroup Phase III Trial N0147,” 2010 ASCO Annual Meeting, 2010.
- C. J. Allegra, G. Yothers, M. J. O’Connell, S. Sharif, N. J. Petrelli, L. H. Colangelo, J. N. Atkins, T. E. Seay, L. Fehrenbacher, R. M. Goldberg, S. O’Reilly, L. Chu, C. A. Azar, S. Lopa and N. Wolmark, “Phase III Trial Assessing Bevacizumab in Stages II and III Carcinoma of the Colon: Results of NSABP Protocol C-08,” Journal of Clinical Oncology, Vol. 29, No. 1, 2011, pp. 11-16. doi:10.1200/JCO.2010.30.0855
- A. de Gramont, “AVANT: Results from a Randomized, Three-Arm Multinational Phase III Study to Investigate Bevacizumab with Either XELOX or FOLFOX4 versus FOLFOX4 alone as Adjuvant Treatment for Colon Cancer,” 2011 Gastrointestinal Cancers Symposium, 2011.
- W. Talloen, D. A. Clevert, S. Hochreiter, D. Amaratunga, L. Bijnens, S. Kass and H. W. Gohlmann, “I/NI-calls for the Exclusion of Non-Informative Genes: A Highly Effective Filtering Tool for Microarray Data,” Bioinformatics, Vol. 23, No. 21, 2007, pp. 2897-2902. doi:10.1093/bioinformatics/btm478
- G. Caponigro and W. R. Sellers, “Advances in the Preclinical Testing of Cancer Therapeutic Hypotheses,” Nature Reviews Drug Discovery, Vol. 10, No. 3, 2011, pp. 179-187. doi:10.1038/nrd3385
- “The Catalogue of Somatic Mutations in Cancer (COSMIC),” http://cancer.sanger.ac.uk/cancergenome/projects/cosmic
- A. Bertotti, G. Migliardi, F. Galimi, F. Sassi, D. Torti, C. Isella, D. Corà, F. Di Nicolantonio, M. Buscarino, C. Petti, D. Ribero, N. Russolillo, A. Muratore, P. Massucco, A. Pisacane, L. Molinaro, E. Valtorta, A. Sartore-Bianchi, M. Risio, L. Capussotti, M. Gambacorta, S. Siena, E. Medico, A. Sapino, S. Marsoni, P. Comoglio, A. Bardelli and L. Trusolino, “A Molecularly Annotated Platform of PatientDerived Xenografts (‘Xenopatients’) Identifies HER2 as an Effective Therapeutic Target in Cetuximab-Resistant Colorectal Cancer,” Cancer Discovery, 2011, pp. 508-523.
- Y. Becouarn and P. Rougier, “Clinical Efficacy of Oxaliplatin Monotherapy: Phase II Trials in Advanced Colorectal Cancer,” Seminars in Oncology, Vol. 25, No. 2, 1998, pp. 23-31.
- E. Diaz-Rubio, J. Sastre, A. Zaniboni, R. Labianca, H. Cortes-Funes, F. de Braud, C. Boni, M. Benavides, G. Dallavalle and M. Homerin, “Oxaliplatin as Single Agent in Previously Untreated Colorectal Carcinoma Patients: A Phase II Multicentric Study,” Annals of Oncology, Vol. 9, No. 1, 1998, pp. 105-108. doi:10.1023/A:1008200825886
- D. Machover, E. Diaz-Rubio, A. de Gramont, A. Schilf, J. J. Gastiaburu, S. Brienza, M. Itzhaki, G. Metzger, D. N’Daw, J. Vignoud, A. Abad, E. Francois, E. Gamelin, M. Marty, J. Sastre, J. F. Seitz and M. Ychou, “Two Consecutive Phase II Studies of Oxaliplatin (L-OHP) for Treatment of Patients with Advanced Colorectal Carcinoma Who Were Resistant to Previous Treatment with Fluoropyrimidines,” Annals of Oncology, Vol. 7, No. 1, 1996, pp. 95-98. doi:10.1093/oxfordjournals.annonc.a010489
- M. L. Rothenberg, A. M. Oza, R. H. Bigelow, J. D. Berlin, J. L. Marshall, R. K. Ramanathan, L. L. Hart, S. Gupta, C. A. Garay, B. G. Burger, N. Le Bail and D. G. Haller, “Superiority of Oxaliplatin and Fluorouracil-Leucovorin Compared with Either Therapy Alone in Patients with Progressive Colorectal Cancer after Irinotecan and Fluorouracil-Leucovorin: Interim Results of a Phase III Trial,” Journal of Clinical Oncology, Vol. 21, No. 11, 2003, pp. 2059-2069. doi:10.1200/JCO.2003.11.126
- M. H. Cohen, J. Gootenberg, P. Keegan and R. Pazdur, “FDA Drug Approval Summary: Bevacizumab plus FOLFOX4 as Second-Line Treatment of Colorectal Cancer,” The Oncologist, Vol. 12, No. 3, 2007, pp. 356-361. doi:10.1634/theoncologist.12-3-356
- C. J. Allegra, G. Yothers, M. J. O’Connell, S. Sharif, N. J. Petrelli, L. H. Colangelo, J. N. Atkins, T. E. Seay, L. Fehrenbacher, R. M. Goldberg, S. O’Reilly, L. Chu, C. A. Azar, S. Lopa and N. Wolmark, “Phase III Trial Assessing Bevacizumab in Stages II and III Carcinoma of the Colon: Results of NSABP Protocol C-08,” Journal of Clinical Oncology, Vol. 29, No. 1, 2011, pp. 11-16. doi:10.1200/JCO.2010.30.0855
- M. Peeters, T. J. Price, A. Cervantes, A. F. Sobrero, M. Ducreux, Y. Hotko, T. Andre, E. Chan, F. Lordick, C. J. Punt, A. H. Strickland, G. Wilson, T. E. Ciuleanu, L. Roman, E. Van Cutsem, V. Tzekova, S. Collins, K. S. Oliner, A. Rong and J. Gansert, “Randomized Phase III Study of Panitumumab with Fluorouracil, Leucovorin, and Irinotecan (FOLFIRI) Compared with FOLFIRI Alone as Second-Line Treatment in Patients with Metastatic Colorectal Cancer,” Journal of Clinical Oncology, Vol. 28, No. 31, 2010, pp. 4706-4713. doi:10.1200/JCO.2009.27.6055
- S. Guerrero, I. Casanova, L. Farre, A. Mazo, G. Capella and R. Mangues, “K-Ras Codon 12 Mutation Induces Higher Level of Resistance to Apoptosis and Predisposition to Anchorage-Independent Growth than Codon 13 Mutation or Proto-Oncogene Overexpression,” Cancer Research, Vol. 60, No. 23, 2000, pp. 6750-6756.
- H. Prenen, J. De Schutter, B. Jacobs, W. De Roock, B. Biesmans, B. Claes, D. Lambrechts, E. Van Cutsem and S. Tejpar, “PIK3CA Mutations Are Not a Major Determinant of Resistance to the Epidermal Growth Factor Receptor Inhibitor Cetuximab in Metastatic Colorectal Cancer,” Clinical Cancer Research, Vol. 15, No. 9, 2009, pp. 3184-3188. doi:10.1158/1078-0432.CCR-08-2961
- Z. Saridaki, M. Tzardi, C. Papadaki, M. Sfakianaki, F. Pega, A. Kalikaki, E. Tsakalaki, M. Trypaki, I. Messaritakis, E. Stathopoulos, D. Mavroudis, V. Georgoulias and J. Souglakos, “Impact of KRAS, BRAF, PIK3CA Mutations, PTEN, AREG, EREG Expression and Skin Rash in ≥2nd Line Cetuximab-Based Therapy of Colorectal Cancer Patients,” PLoS One, Vol. 6, No. 1, 2011, Article ID: e15980. doi:10.1371/journal.pone.0015980
Supplementary Materials
Table S1. Supplementary information on the Custom Taqman SNP Genotyping Assays used in the mutation analysis (Applied Biosystems); FAM, VIC: fluorescent dyes; NFQ: Non-Fluorescent-Quencher (detailed information concerning the sequences of primers and probes available upon request).
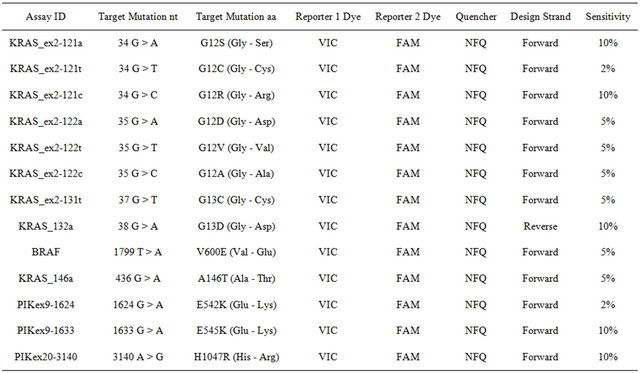
Table S2. Supplementary information on the cell lines used as positive controls in mutation analysis by TaqManMGB allelic-discrimination assay. To investigate sensitivity of the allelic discrimination TaqManMGB assays we performed a titrationmixture of DNA isolated from the cell lines and genomic DNA isolated from lymphocytes of peripheral blood system in proportions: 1:0, 1:2, 1:4, 1:10, 1:20, 1:50, 1:100, 1:200. Titrations served as positive controls in every single analysis.
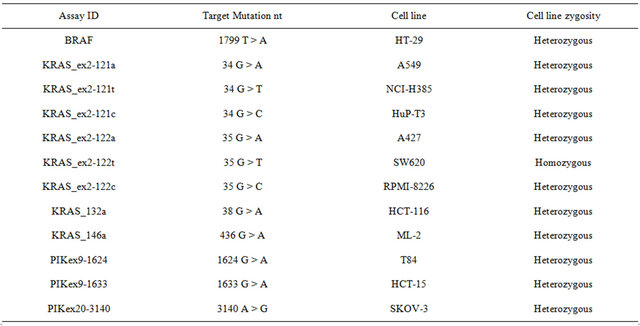
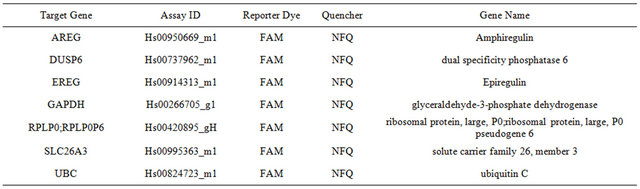
Table S3. Supplementary information on the Gene Expression Assays (Applied Biosystems); FAM—fluorescent dye, NFQ—Non-Fluorescent-Quencher; (detailed information concerning the sequences of primers and probes available upon request).
NOTES
*Corresponding author.