Open Journal of Fluid Dynamics
Vol.2 No.4A(2012), Article ID:26366,6 pages DOI:10.4236/ojfd.2012.24A042
Study of Interaction between Supersonic Flow and Rods or Jets Surrounded by Porous Cavity
1Graduate School of Engineering and Science, University of the Ryukyus, Okinawa, Japan
2Department of Mechanical System Engineering, University of the Ryukyus, Okinawa, Japan
3Makino Milling Machine Co., Ltd., Tokyo, Japan
Email: yaga@tec.u-ryukyu.ac.jp
Received September 28, 2012; revised November 10, 2012; accepted November 19, 2012
Keywords: Shock Wave; Compressible Flow; Porous Cavity; Bow Shock Wave
ABSTRACT
In this experiment, the effects of the combination of jets or rods and a porous cavity on the supersonic flow field are studied by means of visualization of schlieren method and the measurements of wall static pressures and the flow direction in the cavity with the thermal tuft probe. Three cases of jets or rods arrangements are tested in the experiments. As a result, a bow shock wave which is generated by the jets or rods is observed by mean of schlieren method. And it is confirmed that the expansion region appears downstream of the rods but is not in case of the jets pattern. Moreover the pressure ratios of starting shock wave passing through porous cavity for jets pattern differ from that of rods pattern. In the cavity, the flow direction at the measurement position in the cavity is always opposite to the main flow, as long as the starting shock wave is located upstream of the porous cavity for all cases. Difference in the backward flow ratio between the jets and rods patterns is observe after the starting shock wave passes through the porous cavity.
1. Introduction
Supersonic mixing enhancements have attracted a great deal of attention because of the potential for important applications to scram jet engines [1] and thermal sprays [2], for example. A number of studies have investigated the mixing process under the supersonic state using various techniques, such as the use of a swept ramp [3], and a use of a contoured wall injector [4]. However, a number of problems, such as mixing losses, mixing efficiency [5], remain. The authors previously proposed a new concept, as shown in Figure 1, whereby the losses of the flow field in the mixing process might be reduced [6,7]. In the first stage, the jet is injected in a direction normal to the main flow. The jet is considered as an obstacle to the main supersonic flow. Then a bow shock wave is generated and causes a pressure difference between the upstream and downstream sides of the shock wave. Pressure differences also exist on the porous wall and inside the cavity, which drive the flow in the cavity. At the same time, together with the main flow, the injected jet is sucked into the cavity through the porous holes. The flow velocity in the cavity is reduced enough to allow mixing of the injected jet and the main flow. The flow in the cavity is spouted again, achieving small fine injections through numerous small porous holes. In order to figure out the effect of the jets on the flow field experimentally in the cavity, the relatively high response device for measuring the flow direction, so called thermal tuft probe reported by C. P. Häggmark, et al. [8], is applied in the cavity instead of using conventional tuft. To reveal the flow field, it is necessary to investigate the flow direction in the cavity. The probe is a high response sensor and can detect one dimensional flow direction. Therefore, we herein focus mainly on the flow direction in the cavity. In addition to jets, experiments with rods instead of jets were performed. In the measurements, schlieren visualization and static pressure on the upper wall were conducted.
2. Experimental Apparatus and Procedure
2.1. Wind Tunnel Facility
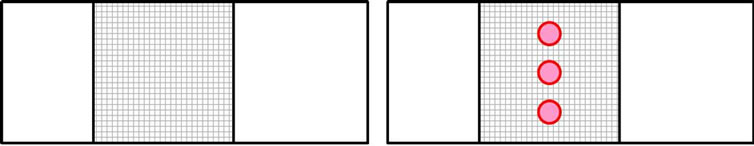
Figure 2 shows a schematic diagram of the experimental apparatus used in the present study. The blow-down wind tunnel was used for this experiment. The schlieren method was performed using a xenon spark light source to visualize the density field. Twenty pressure taps were positioned on the upper wall, along the center of the duct. The taps were scanned with a pressure scanning device. A schematic diagram of the nozzle and the test section are shown in Figure 3. The test section is attached to a diverging nozzle with a designated Mach number of 2.2. The test section has a diverging angle of 1˚ for each side in order to avoid large amplitude oscillations of a starting shock wave. The x direction, along the flow direction originating at the throat, is non-dimensionalized by the nozzle throat height h*. A cavity with a porous wall is installed within the range of x/h* = 7.0 to 11.4. The depth of the cavity is hc/h* = 1. The diameter d and the pitch of the holes of the porous wall are 1 mm and 2 mm, respectively. Eleven holes are distributed in the streamwise direction and fifteen holes are distributed in the spanwise direction. The porosity, which is defined as the ratio of the total area of the holes to the porous region, is approximately 0.617. Jets and rods are inserted from the porous region. Figures 4(a) and (b) show the arrangements of the jets and rods. The jets and rods are positioned at x/h* = 9.2 and the diameters of the jets and rods are 1 mm. The distance between the jets or the rods is 6 mm. In this experiment, the arrangements of the spanwise jets and rods as shown in Figure 4(b) are referred to as Jet030 and Rod030, respectively.
2.2. Thermal Tuft Probe
In this experiment, the relatively high response and small device for the measurements, so called thermal tuft probe is adopted. Images of the thermal tuft probe are shown in Figure 5. The heating wire and the two sensors for the heat detection are made of Moleculoy (φ1 mm) and tungsten (φ0.005 mm), respectively. The distance between the heating wire and each sensor is 0.5 mm. An electronic circuit of the thermal tuft probe is shown in Figure 6. The sensors are connected with Wheatstone bridge. The resistances of the sensors change with heat conveyed from the heating wire to the sensors by the flow, which generates bridge voltage change. This voltage change contains information about the flow direction. The heat detectors and the heating wire cannot be used to measure the absolute flow velocity due to a lack of their calibrations. In this experiment, the heat detectors can only detect a streamwise flow direction in the cavity. And it was proved that the thermal tuft probe used in the experiment does not disturb the flow [9].
2.3. Experimental and Measurement Conditions
The experiments were conducted for wind tunnel pressure ratios p0/pb of between 2.0 and 3.0, where the pressure ratio p0/pb is defined as the ratio of the stagnation
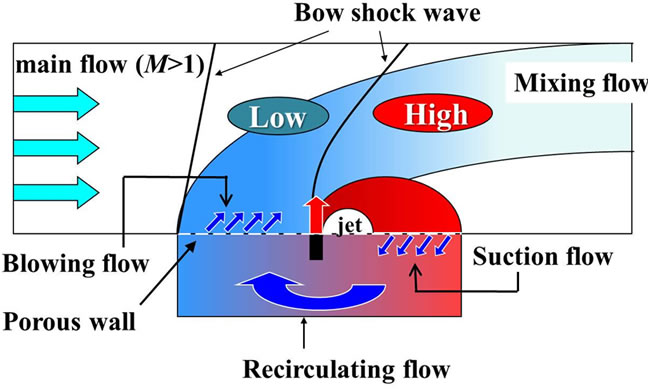
Figure 1. Schematic diagram of a previously proposed loss reduction concept.
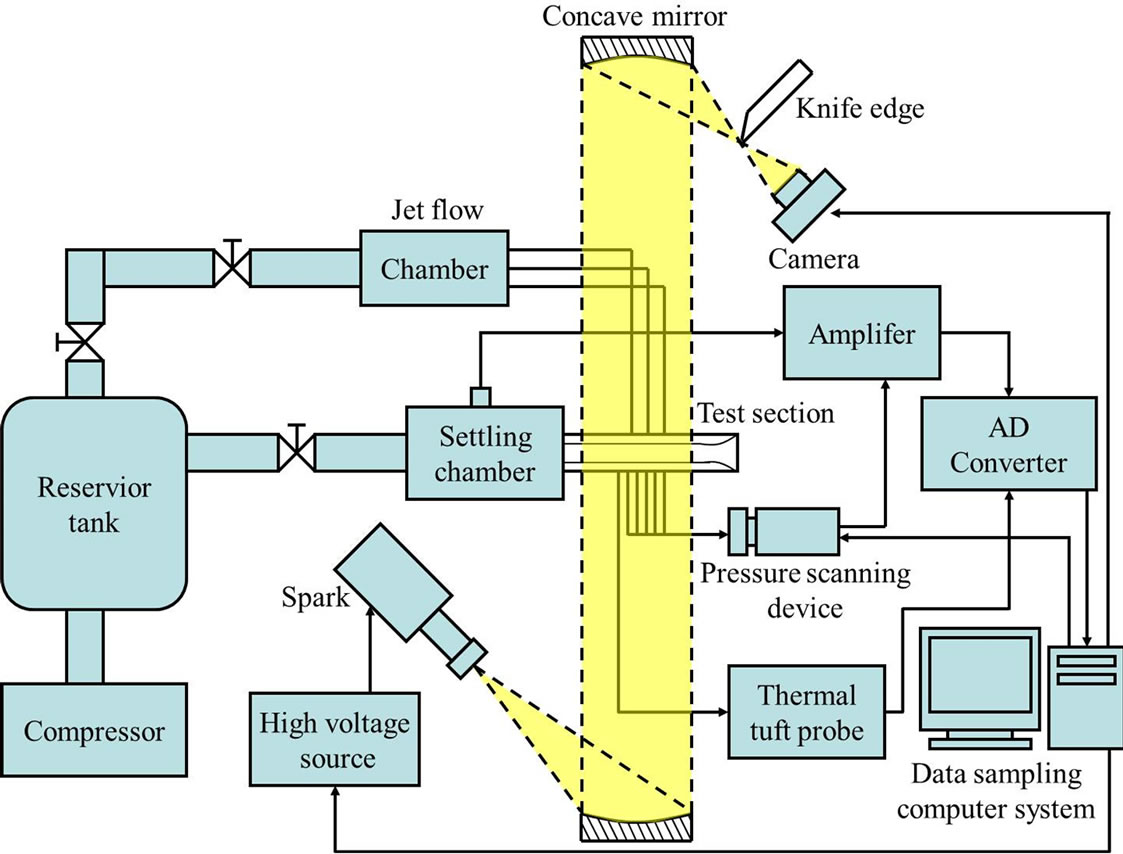
Figure 2. Experimental apparatus.
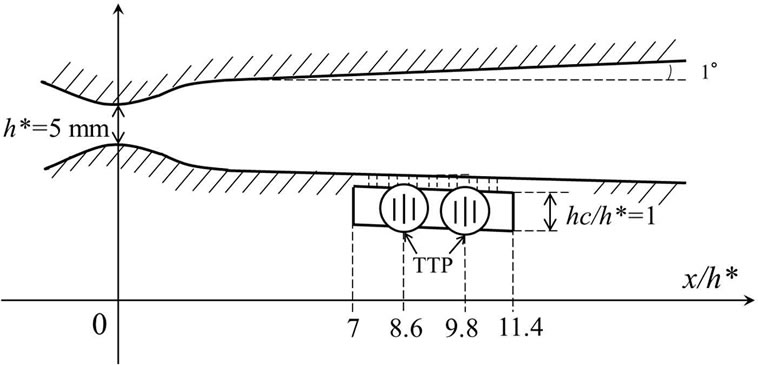
Figure 3. Schematic diagram of test section.
 (a) (b)
Figure 4. Arrangements of jets or rods. (a) 000; (b) 030.
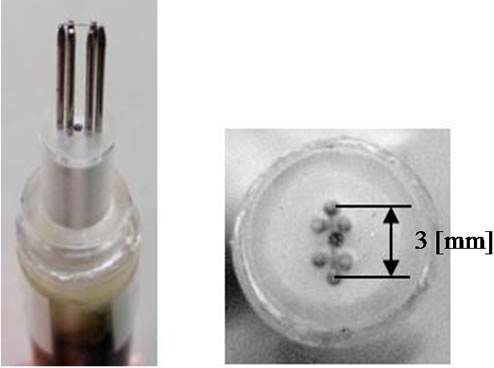
Figure 5. Thermal tuft probe.
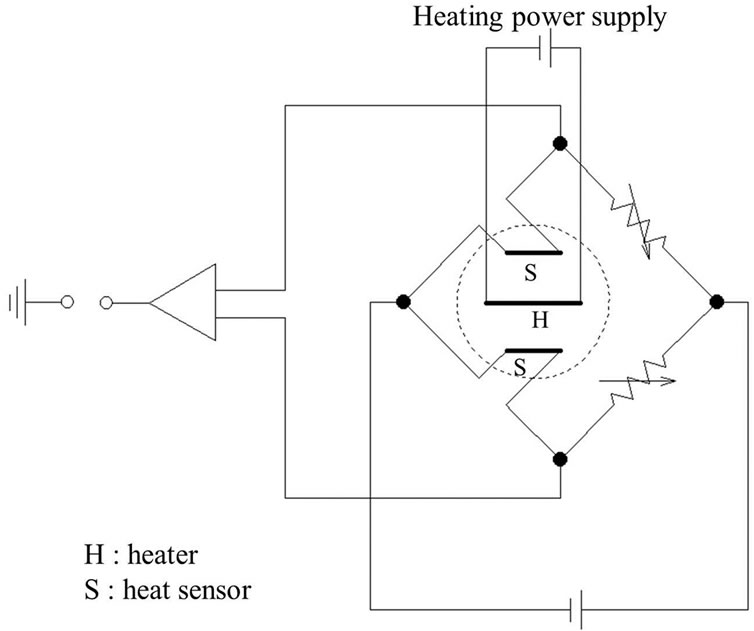
Figure 6. Electronic circuit of Wheatstone bridge for heat sensors.
pressure p0 in the settling chamber to the back pressure pb. The thermal tuft probe is installed at x/h* = 8.6 and 9.8 in the cavity as shown in Figure 3. Distance between the side wall and measurement point is 12 mm, which is middle point between jets or rods. The sampling number and interval of the output from the thermal tuft probe are 4096 and 100 μs at each pressure ratio, respectively. The average of the pressure is taken at each pressure ratio. At the same time, the density field is visualized by the schlieren method. The static pressure on the upper wall is measured under the constant pressure ratio at p0/pb = 3.0 for three patterns 000, Jet030 and Rod030. The jet-tofreestream momentum flux ratio for each jet was J ≈ 1.9 where the freestream Mach number and jet Mach number are 2.2 and 1.0, respectively in case of the pressure ratio p0/pb of 3.0. The height of the rods is hr/h* = 0.8.
3. Results and Discussion
Figures 7(a) through (c) show a schlieren images at p0/pb = 3.0 for pattern 000, Jet030 and Rod030, respectively. In Figure 7(a), a starting shock wave is observed at x/h* = 13 on the upper wall. Mach lines are seen on the porous wall region but there are no large disturbances of the flow on the porous wall. Therefore porous cavity has almost no effect on supersonic main flow. In Figure 7(b), a starting shock wave is seen at x/h* = 13 on the upper wall as seen for the pattern 000. And a bow shock wave is generated by the three jets. This bow shock wave is incident on the upper wall around x/h* = 12 and reflected from the upper wall. Moreover compression waves are observed at x/h* = 10 so the blowing flow from the cavity
 (a)
(a)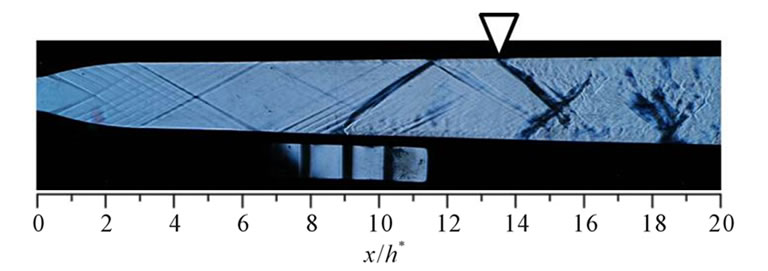 (b)
(b)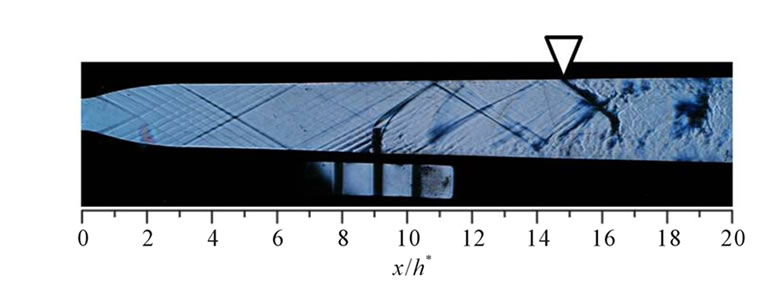 (c)
(c)
Figure 7. Schlieren images at p0/pb = 3.0. (a) Pattern 000 (only cavity); (b) Pattern Jet030; (c) Pattern Rod030.
into the duct is considered to occur. In addition to this compression wave, other compression waves are ascertained upstream of the jets on the porous wall. It also suggests that the blowing flow from cavity into main flow occurs. Therefore injecting the jets into the main supersonic from the porous wall promotes circulation between the main flow and the cavity flow. In Figure 7(c), a bow shock wave generated by rods and starting shock wave is observed. The bow shock wave impinges and is reflected at x/h* = 10 on the upper wall. The compression waves at x/h* = 10 and upstream of rods are observed as seen in Figure 7(b). But these compression waves are clearer than that of Jet030, so the blowing flow for pattern Rod030 is considered to be strong. And a curved dark region is seen at x/h* = 11 in the main flow duct. This curved dark region indicates that a three dimensional bow shock wave is impinging on the both side walls. In case of Jet030 in Figure 7(b), such curved dark region is not so clear because the rods generate stronger bow shock wave than the jets do. Taking these things into account, the three rods make stronger effect on the flow field than the three jets.
Figure 8 shows the static wall pressure distributions on the upper wall at p0/pb = 3.0. In case of 000, pressure increases at x/h* = 13. This increase is caused by the starting shock wave which stands at x/h* = 13 as shown in Figure 7(a). The pressure distribution for Jet030 has a peak at x/h* = 12. As discussed above, the bow shock wave is incident on the upper wall at this point so this peak is caused by the bow shock wave. In case of Rod030, a pressure peak is observed at x/h* = 11.4. This peak is considered to be created by the bow shock which impinging at this point as shown in Figure 7(c). Downstream of the peak, sudden pressure decrease occurs at x/h* = 12.6 - 14.4, which indicates that there is an expansion region around this area. This pressure decrease is only the case of Rod030. In case of Rod030, a dead water region appears behind the rods. In this area, main flow is considered to expand. But in case of Jet030, this expansion in a dead water region is not observed.
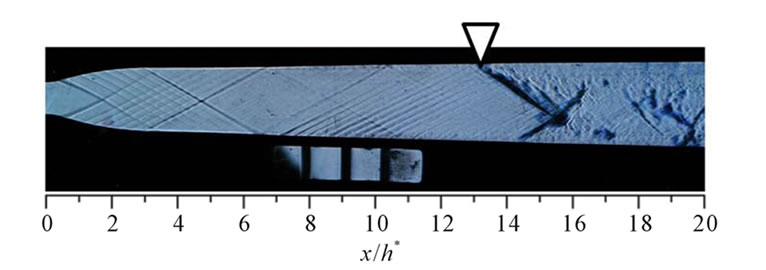
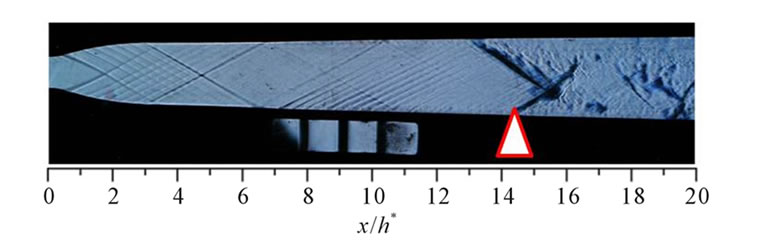
Figures 9(a) and (b) show typical schlieren image and the starting shock wave positions on the lower wall, respectively. The starting shock wave position are adopted as an incidence of the shock foot on the lower wall of the duct, which is useful for discussing the relation between the shock position and the flow in the cavity. In Figure 9(a), the triangle points to the starting shock wave position on the lower wall. In Figure 9(b), the shock positions for the pressure ratios of 2.2 and 2.3 for pattern 000 are not plotted because they are unclear due to the interaction between the shock wave and boundary layer disturbed by the porous cavity. However it is confirmed that the starting shock wave exists on the porous region at p0/pb = 2.2, 2.3. This graph indicates that the starting
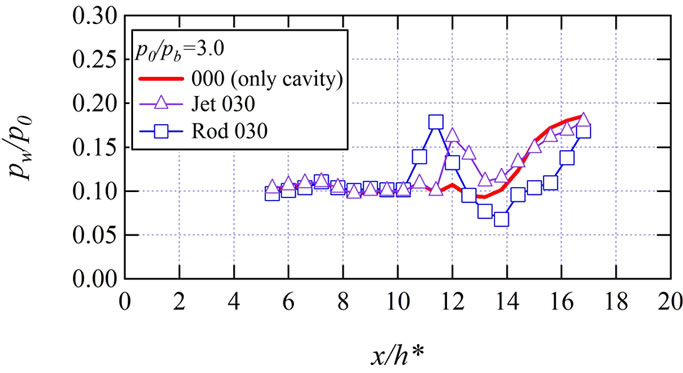
Figure 8. Static wall pressure distributions at p0/pb = 3.0.
 (a)
(a) (b)
(b)
Figure 9. Starting shock wave positions on the upper wall. (a) Typical schlieren image; (b) Shock wave positions.
shock wave moves downstream in the all cases as the pressure ratio increases. The pressure ratio at the starting shock wave passing through the porous region for 000 and Jet030 is 2.4, but it is 2.7 for Rod030. This indicates that the three rods has larger blockage effect than that of Jet030. There is difference in shock positions for the range of pressure ratios between 2.2 and 2.6. On the contrary after the shock passing through the porous region, this difference becomes small as pressure ratio increases. This results show that starting shock wave positions are influenced by the injected jets and rods only when the shock wave is located around the porous region. On the other hand, the jets and rods have no effect on the position of the shock wave that is located far downstream of the porous region.
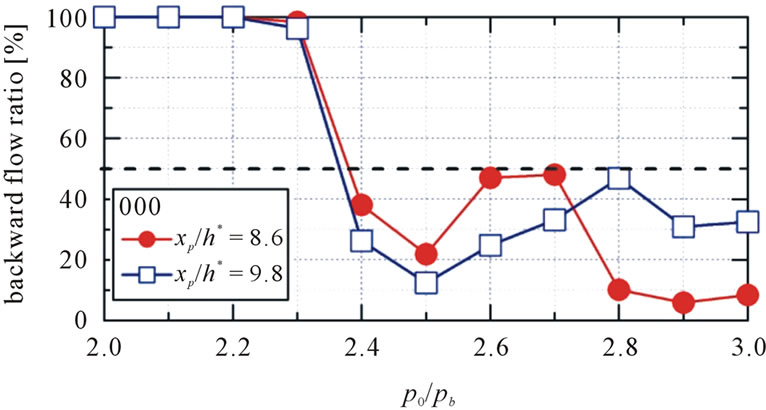
Figures 10(a)-(c) show the backward flow ratios at xp/h* = 8.6 and 9.8 in the cavity for 000, Jet030 and Rod030, respectively. The backward flow ratio is defined
 (a)
(a)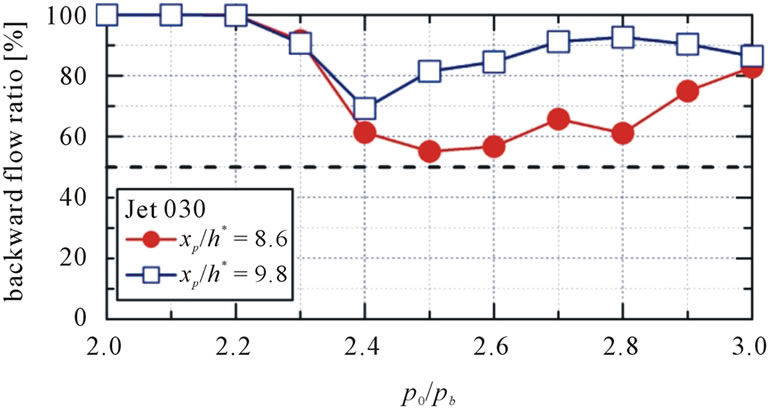 (b)
(b)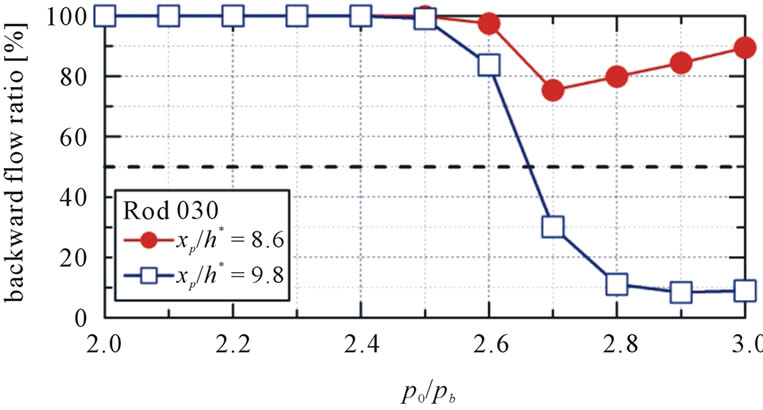 (c)
(c)
Figure 10. Backward flow ratios. (a) Pattern 000 (only cavity); (b) Pattern Jet030; (c) Pattern Rod030.
as a ratio of the duration time of backward flow to the total measurement time. In Figure 10(a), backward flow ratio at each measurement position is almost 100% for the range of pressure ratios of between 2.0 and 2.3. But it become below 50% from the pressure ratio of 2.4 at which the starting shock wave passes through the porous region, which is discussed in the previous section. Thus at the two measurement positions, the flow changes dramatically its direction from the main flow to the opposite one when the starting shock wave passes through the porous region.
In case of pattern Jet030 in Figure 10(b), the backward flow ratio at each measurement position keeps the level more than 50% for the all pressure ratios. However, the backward flow ratio at xp/h* = 8.6 decreases nearly to 50% for the pressure ratios of 2.4 and 2.6, which indicates that the flow at this range is the transition state from the same direction as main flow to opposite to the main flow. In case of Jet030, the pressure ratio at which the starting shock wave passing through the cavity is 2.4. In Figure 10(b), the backward flow ratios start large decreasing at this pressure ratio. So, after the starting shock wave passing through the cavity, the flow in the cavity is considered to become unstable.
In case of Rod030, the pressure ratio of the starting shock wave going through the porous region is 2.7 as discussed above. Focusing on this pressure ratio, the backward flow ratio at xp/h* = 9.8 suddenly decreases. However the backward flow ratio at xp/h* = 8.6 does not decrease under 50%. So the discrepancy in the backward flow ratio indicates that the flow at xp/h* = 8.6 is the opposite direction to main flow and the flow at xp/h* = 9.8 is the same direction as the main flow, which shows the flow in the cavity branches from the position of rods to upstream and downstream.
In all jets or rods patterns, the backward flow ratios are nearly 100% before the starting shock wave pass over the porous region. Hence the flow direction in the cavity is not influenced by jets and rods, arranged pattern 030, before the starting shock wave pass over the porous region.
4. Conclusions
The interaction between the high speed main flow including a starting shock wave and jets or rods surrounded by the porous cavity was investigated using the schlieren method, pressure measurement, and a high response flow direction measurement in the cavity with a thermal tuft probe. The results are summarized as follows:
1) Jets and rods generate bow shock wave. There is also expansion region after the bow shock wave only in the case of spanwise three rod arrangement.
2) The rods have large blockage effect, thus the pressure ratio at which the starting shock wave passes over the porous region is higher than the case of no jet or rod and Jet030.
3) The starting shock wave position is not influenced by jets and rods after the starting shock wave passes over the porous region.
4) The flow direction in the cavity is influenced by the jets and rods only when the starting shock wave is located downstream of the cavity. On the other hand, they have no effect on the flow direction in the cavity when the starting shock wave is located upstream of the cavity.
REFERENCES
- R. C. Rogers, D. P. Capriotti and R. W. Guy, “Experimental Supersonic Combustion Research at NASA Langley,” AIAA Paper, 1998, pp. 98-2506.
- T. C. Hanson and G. S. Settles, “Particle Temperature and Velocity Effects on the Porosity and Oxidation of an HVOF Corrosion-Control Coating,” Journal of Thermal Spray Technology, Vol. 12, No. 3, 2003, pp. 403-415. doi:10.1361/105996303770348276
- R. Honig, D. Theisen, R. Fink, R. Lachner, G. Kappler, D. Rist and P. Andrsen, “Experimental Investigation of a Scramjet Model Combustor with Injection through a Swept Ramp Using Laser-Induced Fluorescence with Tunable Excimer Lasers,” Symposium (International) on Combustion, Vol. 26, No. 2, 1996, pp. 2949-2956.
- I. A. Waitz, F. E. Marble and E. E. Zukoski, “Investigation of a Contoured Wall Injector for Hypervelocity Mixing Augmentation,” AIAA Journal, Vol. 31, No. 6, 1993, pp. 1014-1021. doi:10.2514/3.11723
- M. J. Barber, J. A. Schetz and L. A. Roe, “Normal, Sonic Helium Injection through a Wedge-Shaped Orifice into Supersonic Flow,” Journal of Propulsion and Power, Vol. 13, No. 2, 1997, pp. 257-263. doi:10.2514/2.5157
- M. Yaga, S. Tabata, P. Doerffer and K. Oyakawa, “Numerical Simulation of Supersonic Mixing Enhancement with Porous Cavity,” AIAA-Paper, 2003, pp. 2003-3461.
- M. Yaga, K. Yamamoto, P. Doerffer and K. Oyakawa, “Study of Interaction between Supersonic Flow and Rods Surrounded by Porous Cavity,” Journal of Thermal Science, Vol. 15, No. 4, 2006, pp. 324-330. doi:10.1007/s11630-006-0324-2
- C. P. Häggmark, A. A. Bakchinov and P. H. Alfredsson, “Measurements with a Flow Direction Boundary-Layer Probe in a Two-Dimensional Laminar Separation Bubble,” Experiments in Fluid, Vol. 28, No. 3, 2000, pp. 236- 242. doi:10.1007/s003480050383
- N. Kuniyoshi, M. Yaga, A. Koda, I. Teruya and M. Ishikawa, “Experimental Study of Interaction between Supersonic Duct Flow and Jets Surrounded by the Porous Cavity,” Experimental Thermal and Fluid Science, Vol. 40, 2012, pp. 185-194. doi:10.1016/j.expthermflusci.2012.03.011