Theoretical Economics Letters
Vol.08 No.05(2018), Article ID:83850,53 pages
10.4236/tel.2018.85075
A Matrix Approach to the Socioeconomic Activity of a Country
Susana Santos
UECE (Research Unit on Complexity and Economics) and DE (Department of Economics), ISEG―Lisbon School of Economics and Management, Universidade de Lisboa, Lisboa, Portugal
![]()
Copyright © 2018 by author and Scientific Research Publishing Inc.
This work is licensed under the Creative Commons Attribution International License (CC BY 4.0).
http://creativecommons.org/licenses/by/4.0/


Received: October 23, 2017; Accepted: April 16, 2018; Published: April 19, 2018
ABSTRACT
A Social Accounting Matrix (SAM) is presented as a tool to study the socioeconomic activity of a country. This activity involves the monetary or nominal flows that are measured by the National Accounts, as well as production (organized in factors, industries and goods and services) and institutions (organized in households, general government, non-financial and financial corporations, non-profit institutions serving households, and rest of the world). In order to contribute to the definition of a methodology that can improve the knowledge of the different aspects of this activity, the potentialities of a SAM for its reading and interpreting are explored, as well as for carrying out experiments regarding its functioning. Through a SAM-based approach, how to construct more or less complex networks of linkages of the above mentioned flows is shown, from which structural features can be evidenced and the associated multiplier effects studied. Following an application to Portugal, it is shown that a numerical version of a SAM, enables an empirical description of the origin, use, and distribution of income, whereas, an algebraic version of a SAM allows one to carry out, for example, a deeper study of the multiplier effects associated with the institutional distribution of income. The crucial role of the factors of production accounts is identified in this study, namely when they establish the link between the generation and the distribution and use of income. In this process, the important role the complementary details that the Input-Output Matrix (IOM) can add is also identified. Thus, being the generation of income, the result of the output of goods and services and the associated costs, on the one hand, an industry by industry IOM can add details regarding domestic and imported intermediate consumption by and between industries and, on the other hand, a product by product IOM can add details regarding the domestic and imported intermediate consumption of goods and services.
Keywords:
Social Accounting Matrix, Input-Output Matrix, National Accounts, Socioeconomic Structure, Income Distribution, Multiplier Effects

1. Introduction1
The activity of a country that involves monetary or nominal flows is complex and its knowledge depends on the use of tools, or working instruments. In this article, this activity, which involves production and institutions, will be designated as “socioeconomic activity”, these flows will be all the measured by the National Accounts, and a Social Accounting Matrix (SAM) will be the working instrument, or tool. The research on the potentialities of this tool will be oriented in such a way as to show that it enables the reading and interpretation, the multiple aspects of the reality under study, as well as carry out experiments with its functioning.
The option of working with the National Accounts has behind a research purpose of defining a methodology that could be adopted by as many users as possible, and which could contribute to improving the knowledge about different aspects of the so-called socioeconomic activity of a country. This resulted from the perception that the National Accounts, on one hand, are aligned to a system that has progressively been adjusted with the aim of being improved, which conveys some confidence, mainly regarding alternative sources of information. On the other hand, the National Accounts have been produced in a more or less complete and adapted way, by almost every country in the world. Thus, since its disclosure is regular, (at least partially) free, and credible, its adoption becomes accessible to a greater number of users and uses.
Therefore, the adoption of National Accounts as a base source of information of the SAM could contribute to producing better studies in different areas, as well as useful results for the process of policy evaluation and decision making.
This explains why the rules and the nomenclatures of the latest version of the SNA [1] will underlie the methodology proposed for a work at a macroeconomic level of analysis. As done previously, I will present this methodology in this article always from a progressively better systematized perspective. This methodology is my own version, and is a result of a research based on the studies of R. Stone, G. Pyatt, and J. Round2, which started with Santos [9] .
A SAM-based approach will be adopted, according to which empirical and theoretical descriptions of the activity of a country are possible with, respectively, numerical and algebraic versions of the SAM. Each cell of a SAM will be a number if it is in a numerical version, and will be an equation or system of equations, if it is in an algebraic version, or a SAM-based model. The SAM will, therefore, enable simultaneous research on the empirical and theoretical evidence of the activity of a country, which in this case is provided by the National Accounts.
As will be seen in Chapter 2, the SAM is a square matrix, in which the sum of the rows is equal to the corresponding sum of the columns. These rows and columns represent, respectively, the inflows and outflows of accounts in which production and institutions are worked together at a level of detail that depends on the corresponding disaggregation, extension, and complements [namely, the Input-Output Matrix (IOM)]. Thus, more or less complex networks of linkages of flows with different intensities can be constructed for specific periods and geographical areas, as will be seen in Chapter 3. Structural features of the underlying activity of that network of linkages can be evidenced, and the associated multiplier effects can be studied, as will be seen in Chapters 4 and 5, respectively. Chapters 2 and 3 will show that with the SAM, the value of production and the associated costs as well as the demand and supply of goods and services can be worked together with various types of income, namely, generated, disposable, and accumulated income. This work, which involves production and institutions and a matrix format when based in a numerical version of a SAM, enables an empirical description of the origin, use, and distribution of this income, as will be shown in Chapter 4. In Chapter 5, an algebraic version will be used to illustrate a possible deeper study of the institutional distribution of income, using some of the potentialities of the SAM.
A summary and some concluding remarks are presented in Chapter 6, which will systematize how a matrix form and a specific organisation of the National Accounts, materialized in a SAM, can evidence and provide conditions for research on the structural features of the socioeconomic activity of a country.
2. A SAM Base Form
In a SAM, the monetary or nominal flows between production and institutions, occurring in a particular geographical space, in a given time period are represented and can be studied.
The SAM is a square matrix, in which the sum of the rows is equal to the corresponding sum of the columns. The entries in rows represent resources, incomes, receipts or changes in liabilities, and net worth. In the columns the entries are outlays, expenditures or changes in assets.
The way how the accounts (rows and columns) are organized and the corresponding details included depends on the purposes of the study for which it will be used and on the available information.
2.1. Schematic Representation
Using a top-down methodology, I will first present a SAM base form, associated to a zero level of disaggregation, which is a summary of the flows measured by the National Accounts. Table 1 shows that form, with seven rows and columns (1 to 7), each of which represent the main SAM accounts―described by the corresponding initials, and the cells represent the above mentioned monetary or nominal flows (also mentioned as transactions) “T”. The location of “T” is described by two initials between brackets, the first of which represents the row account, whilst the second represents the column account. Table 2 identifies and describes these accounts and the corresponding totals, and Table 3 identifies and describes these flows and the corresponding codes in the latest version of the SNA [1] .

Table 1. A SAM base form (level of disaggregation 0).
Source: Own construction, based on Santos [10] and [11] .
Table 2. A SAM base form (level of disaggregation 0)―accounts and totals description.
Source: Own construction, based on Santos [10] and [11] .
Table 3. A SAM base form (level of disaggregation 0)―flows description.
Source: Own construction, based on Santos [10] and [11] . Note: A description on the levels of valuation of the flows associated to the production accounts can be found in the Appendix of Santos [12] .
Outline 1 schematically represents the above described flows, in which the smaller circle represents the (domestic) economy and the bigger one the world. With the direction of the arrows representing the direction of the flows that are being studied, within the smaller circle are all the flows within the domestic economy with the flows between this and the rest of the world being represented by the arrows that cut over its boundaries. This representation helps us to understand how important the study of the direct and induced effects of any change in any nominal flow is in the whole economy, for which the SAM-based modelling is an alternative. That importance is reinforced if we consider that, on one hand, the intensity of those flows is determined by their values, as shown in Table 4 for Portugal in 2013, and, on the other hand, the network of linkages can be extended or disaggregated, as will be seen in Chapter 3.
2.2. Application
In the SNA, the Integrated Economic Accounts (IEA) Table is a summary of all the detail observed by that System, including the full sequence of accounts for (domestic) institutional sectors, the rest of the world and the total economy. Based on this table, and taking into consideration the previous descriptions, it
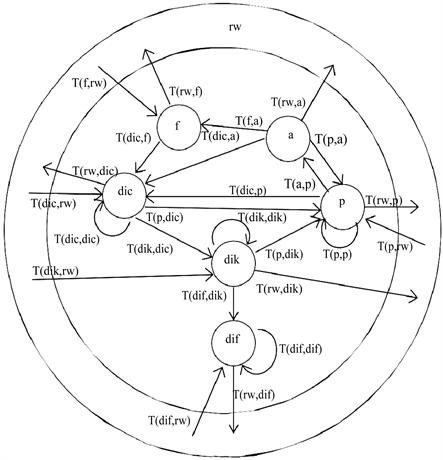
Outline 1. A SAM base form (level of disaggregation 0)―schematic representation of the nominal flows between the accounts, presented and described in Table 1 and Table 3. Source: Own construction, based on Santos [13] .
Table 4. A SAM of Portugal in 2013―level of disaggregation. (In millions of Euros).
Source: Appendice Table A.1. a)65,573 (imports) less 106 (net taxes on products sent to the institutions of the European Union).
was possible to construct an illustrative SAM base form that is presented in Table 4, which represents the level of disaggregation 0 of the activity of Portugal as observed in the National Accounts of 2013 (at current prices).
Considering the description given in Table 2 and Table 3 about Table 1, and based on the reading of the rows and columns of Table 4 we can take a first snapshot of the activity of Portugal in 2013, as described below.
At the level of production accounts, through the factors of production account - row and column f (number 1), show the aggregate or primary income generated in 2013, also designated as compensation of the factors of production, namely of labour and capital, which was in the sum of 156,472 million Euros. Reading in row, this amount was composed of 149,733 (95.7%) and 6739 (4.3%) million Euros, received from domestic activities5 and from the rest of the world6, respectively. Reading in column, this amount was composed of 145,686 (93.1%) and 10,786 (6.9%) million Euros, paid to domestic institutions7 and to the rest of the world, respectively.
In turn, continuing at the level of the production accounts, in the activities account row and column a (number 2) show, respectively, the production value and the total costs associated with the process of production, which totalled 307,861 million Euros. In row, that amount represented the output of goods and services. In column, it was composed of 149,733 (48.3%) million Euros of compensation of factors of production, 158,093 (51.4%) million Euros of intermediate consumption, 1682 (0.5%) million euros of net taxes on production received by the Portuguese Government and -1647 (−0.5%) million Euros of net taxes on production received by the institutions of the European Union8.
Finally, still at the level of the production accounts, through the products account―row and column p (number 3) show the main components of the aggregate demand and supply of the goods and services in the Portuguese economy in 2013, which amounted to 393,935 million Euros. Reading in row, the aggregate demand was composed of 158,093 (40.1%) million Euros of intermediate consumption, 143,644 (36.5%) million Euros of final consumption, 24,914 (6.3%) million Euros of gross capital formation, and 67,284 (17.1%) million Euros of exports. Reading in column, the aggregate supply was composed of 307,861 (78.2%) million Euros of the output of goods and services, 20,607 (5.2%) million Euros of net taxes on products received by the Portuguese Government, −106 million Euros of net taxes on received by the institutions of the European Union8, and 65,573 (16.6%) million Euros of imports, the last two added in the same cell (T(rw,p)). The trade and transport margins are also a component in account p, which amounts to zero at this level of disaggregation, as mentioned in Table 3.
At the level of the domestic institutions accounts, in the current account - row and column dic (number 4) the aggregate income of the Portuguese institutions in 2013 is shown, which amounted to 263,158 million Euros. In row we have the origin of that income, represented as follows: 145,686 (55.4%) million Euros, received as compensation of the factors of production by domestic institutions; 1682 (0.6%) and 20,607 (7.8%) million Euros of net taxes on production and net taxes on products, respectively―both received by the Portuguese government; 88,074 (33.5%) and 7110 (2.7%) million Euros of current transfers within domestic institutions and from the rest of the world, respectively. In column we have the destination or use of the same income, with the following composition: 143,644 (54.6%) million Euros, in final consumption; 88,074 (33.5%) and 5276 (2.0%) million Euros in current transfers within domestic institutions and to the rest of the world; 26,164 (9.9%) million Euros in gross savings.
In the capital account row and column dik (number 5), apart from showing the net lending (or borrowing) of the Portuguese institutions in 2013, information is also shown regarding acquisitions, less disposals of non-financial assets (or the various types of investment in non-financial assets) and capital transfers, which amounted to 31,148 million Euros. Reading in row, this amount represents investment funds, and was composed of: 26,164 (84%) million Euros of gross savings; 2131 (6.8%) and 2852 (9.2%) million Euros of capital transfers within domestic institutions and from the rest of the world. Reading in column, this amount represents aggregate investment and was composed of: 24,914 (80%) million Euros of gross capital formation; 2131 (6.8%) and 157 (0.5%) million Euros of capital transfers within domestic institutions and to the rest of the world, respectively, and 3946 (12.7%) million Euros of net lending.
The financial account row and column dif (number 6), represents the net flows associated with the acquisition of financial assets and the incurrence of liabilities, underlying which there is the above mentioned net lending. These flows amounted to −14,259 million Euros. Reading in row, this amount is composed of 3946 million Euros of net lending, −7804 million Euros of net financial transactions between domestic institutions, and −10,400 million Euros of net financial transactions from the rest of the world. Reading in column, besides the net financial transactions between domestic institutions (−7804 million Euros), this amount also includes −6455 million Euros of net financial transactions to the rest of the world.
The rest of the world account row and column rw (number 7) show all the transactions between resident and non-resident actors in the accounts described above (production and domestic institutions), or between the Portuguese economy and the rest of the world in 2013, which amounted to 73,584 million Euros. Thus, the row represents the flows from residents to non-residents, or the value of transactions to the rest of the world, with the following composition: 10,786 (14.7%) million Euros of compensation of factors of production, −1647 (−2.2%) million Euros of net taxes on production (received by European Union institutions)8 65,467 (89%) million Euros of imports (65,573 million Euros), to which is added net taxes on products (−106 million Euros, received by the institutions of the European Union8), 5276 (7.2%) million Euros of current transfers, 157 (0.2%) million Euros of capital transfers, and −6455 (−8.8%) million Euros of net financial transactions. In turn, the column shows the decomposition of the value of transactions from the rest of the world, or the flows from non-residents to residents, as follows: 6739 (9.2%) million Euros of compensation of factors of production, 67,284 (91.4%) million Euros of exports, 7110 (9.7%) million Euros of current transactions, 2852 (3.9%) million Euros of capital transfers, and −10,400 (−14.1%) million Euros of net financial transactions.
2.3. Macroeconomic Aggregates and Types of Income
As practically all the flows observed and measured by the National Accounts are included in the above presented SAM, it is possible to calculate and/or extract from it the main macroeconomic aggregates that are usually considered.
The following description is based on the four tables presented above.
Gross Domestic Product (GDP) can be calculated using the three known approaches: the production approach―in which intermediate consumption [T(p,a)] is subtracted from the output of goods and services [T(a,p)], adding the net taxes on products [T(dic,p) + (part of) T(rw,p)]; the expenditure approach in which final consumption [T(p,dic)], gross capital formation [T(p,dik)], and net exports [T(p,rw) - (part of) T(rw,p)] are added; and the income approach in which net taxes on production and imports [T(dic,p) + (part of) T(rw,p) + T(dic,a) + T(rw,a)] are added to the gross added value [T(f,a)]. The Portuguese GDP in 2013 was 170,269 million Euros.
GDP is the income generated in the domestic economy by residents and non-residents, added to the total net taxes on production and imports, to be valued at market prices.
Gross Domestic Product can be converted into Gross National Product or Income (GNI), by adding the compensation of factors of production (labour and capital) received from the rest of the world [T(f,rw)], and by deducting the compensation of factors of production (labour and capital) and net taxes on production and imports sent to the rest of the world [T(rw,f) - T(rw,a) - (part of) T(rw,p)], when these exist. Gross National Income can also be calculated directly from the SAM by adding the compensation of factors received by domestic institutions to the net taxes on production and on products received by domestic institutions [T(dic,f) + T(dic,a) + T(dic,p)]. The corresponding amount for Portugal in 2013 was 167,975 million Euros.
GNI is the income generated in the domestic economy and in the rest of the world by residents, added to the part received by the general government of net taxes on production and imports, to be valued at market prices.
Disposable Income (DI) can be calculated by adding the net current transfers received by domestic institutions [(received, or row sum) T(dic,dic) + T(dic,rw) - (paid, or column sum) T(dic,dic) + T(rw,dic)] to Gross National Income. In our application for Portugal, this was 169,808 million Euros.
The following macroeconomic aggregates are usually presented with the above: Gross Saving (S) and Net Lending (NL), or Net Borrowing (NB), which are items that are provided directly by the SAM, through T(dik,dic) and T(dif,dik), respectively, which, in the case of Portugal in 2013, were 26,164 and 5276 million Euros, respectively. As explained in Table 3, the latter amount represents NL, if it represented NB it would then be positioned in the T(dik,dif) cell. As confirmed by its position in the SAM structure, these figures integrate the funds of investment, either in non-financial and in financial assets, which I call “accumulated income”.
Without considering NL and NB, the above mentioned gross aggregates can be converted into net aggregates (and S), by deducting the consumption of fixed capital. This lies outside the SAM base form, but is part of the Integrated Economic Accounts (IEA) Table, in which the above presented macroeconomic aggregates are balancing items (codes B)―Appendices Table A.1 is illustrative of the case of Portugal in 2013.
3. SAM Accounts Disaggregation, Extension and Complements
From the presented base form, or level of disaggregation 0, depending on the aim of the study in which the SAM is being adopted and the available information, other SAMs can be constructed, with other levels of disaggregation in the production, institutions and rest of the world accounts, either within the scope of the SNA conventions, or not. Thus, each cell of the SAM base form (see Table 1 and Table 4, for the application to Portugal) will be converted into a sub-matrix, with the number of rows and columns corresponding to the level of disaggregation of the row and column accounts. The following description will continue adopting the latest version of the SNA nomenclatures and the type of the flows after the disaggregation will continue to be the same, although with the due specifications. The consistency of the whole system will therefore be preserved.
A first level of disaggregation (level of disaggregation 1) will be presented below. No other levels of disaggregation will be made in this article, and that will be adopted as the specification of what can be made from the base form presented in the previous chapter.
I am aware that I am only making an introductory approach to the study of the structures of production and income distribution and that higher levels of disaggregation are required for more complete studies. However, as I stated in the Introduction, the purpose of this study is methodological, and as such, a coherent and thorough treatment of this first level will facilitate the move to higher levels.
Before continuing, I would also like to mention the possibilities that Quarterly and Regional National Accounts provide in terms of disaggregation in time and in space9. In turn, the Satellite Accounts (and other extensions), as presented in Chapter 29 of SNA (2008) can provide supplementary information in specific areas (such as: labour, health, unpaid household activity, household production) in a way that is consistent with the central framework [1] , which can be useful to extend and/or complement the SAM.
3.1. Production Accounts and the IOMs
As shown by Table 2, in the base form, the SAM production account is divided into factors of production, activities (industries) and products. These accounts correspond, respectively to the following SNA accounts: primary distribution of income, production, and goods and services. The nominal flows associated to those accounts can be identified in Table 1 and are described in Table 3.
Within the SAM production accounts, one can see how the income resulting from the process of production and the ownership of assets is distributed within institutions and activities and how the available products (or goods and services) are used. These accounts also provide details about the process of production, regarding which the Input-Output Matrix (IOM) can add some more information on intermediate consumption of activities and products.
Considering the available information and the SNA nomenclatures, in this article the disaggregation of the factors of production account was made in “labour” and “others”. The former (labour) includes the compensation of employees. The later (others) includes the compensation of employers and own account (or self-employed) workers and also the compensation of capital, namely property income. Such information can be derived from the IEA Table if the products and activities accounts are not disaggregated and from the Use Table, if the same accounts are disaggregated.
At the level of the SNA, the International Standard Industrial Classification of All Economic Activities (ISIC) Revision 4 (released on August 2008) is used to classify activities, which are organised into 21 sections, with the possibility of going as far as the fourth level of disaggregation. Identical organization is adopted by ESA, the Statistical Classification of Economic Activities in the European Community (NACE) Revision 2 (released on January 2008). The Supply and Use Tables provide this information, usually at a third level of disaggregation.
Regarding products, the SNA uses the Central Product Classification (CPC) Version 2.1 (released on August 2015), which are organised into 10 sections, with the possibility of going as far as the fifth level of disaggregation within each of these. The ESA uses the Statistical Classification of Products by Activity (CPA) Version 2.1 (released on November 2012), which are organised in the same way as activities, as the name implies.
For the application to Portugal in 2013, in a first level of disaggregation, besides the two above mentioned sub-accounts, in the factors of production account (labour and others), ten activities (or industries) and ten products (or goods and services) were disaggregated into the activities and products accounts, respectively, which is described in Table 5. Such disaggregation were made from the Supply and Use Tables (see Appendices Table A.2 and Appendices Table A.3), as presented in the SAM of Table 7. In turn, in Table 8 and Table 9 we can see IOMs
Table 5. Products (or goods and services) and activities (or industries) description for the level of disaggregation 1.
Source: Own construction.
specifying the intermediate consumption of activities and products, respectively.
This is the first time that I include IOMs in my research with SAMs. For now on, these matrices will only be used to increase the detail of the production structural features. Especially for the case of the “industry by industry” IOM, this should be considered as a first step for further research in order to explore the following Graham Pyatt’s statement:
“… SAMs and extended IO tables are not equivalent and one key difference can be explained by analogy. The essence of IO is not that production activity is disaggregated into different industries, but that these industries are related, one to other, through transactions between them, i.e. through the buying and selling of raw materials, and that the structure of production is conditioned by these linkages. By the same token, the essence of a SAM, in this context, is not the disaggregation of institutions into different household types plus various categories of companies, government and the rest of the world, all of which is on offer through an extended IO approach. Rather, the essential detail is to be found in the matrix of transactions and transfers between different types of institutions. These details include the unrequited transfers which characterize the social security system and direct taxation, all types of private remittance and all property income flows. The pattern of these transfers conditions the distribution of income in exactly the same way as the pattern of inter industry transactions conditions the structure of production” [14] .
3.2. Domestic Institutions and Rest of the World Accounts
The proposed SAM base form, presented in Table 1, disaggregates the domestic institutions accounts into current, capital and financial accounts. As is systematized by Table 2, the capital and financial accounts have a direct correspondence between SAM and SNA, whereas the SAM current account corresponds to the following SNA accounts: secondary distribution of income, redistribution of income in kind and use of income. Once again, the flows associated with these accounts can be identified in Table 1, which are described in Table 3.
Depending on the adopted level of disaggregation, through the current account we can see how national income is transformed into disposable income through the receipt and payment of current transfers, and how the latter is distributed between final consumption and saving. On the other hand, through the capital account, we can see the flows linked to acquisitions less disposals of non-financial assets (or the various types of investment in non-financial assets), the capital transfers involving the redistribution of income, and the net lending or borrowing of domestic institutions. In the financial account we can see the net flows that involve financial assets and liabilities that take place between domestic institutions, and between these and the rest of the world.
Both in the SAM and in the SNA through the rest of the world account we can see all the linkages between the domestic economy and the rest of the world, i.e. all the nominal flows between resident and non-resident units.
Chapter 4 of the 2008 SNA specifies the institutional sectors, including the rest of the world, as well as their possible disaggregation, which in some cases can be taken as far as the third level, although normally it cannot be taken beyond the first level. In the case of the rest of the world, such disaggregation will certainly depend on the country, or group of countries, that adopt and adapt this system.
For the application to Portugal in 2013, in a first level of disaggregation, five institutional sectors were identified, as described in Table 6.
At the first level of disaggregation, the accounts of both institutions and the rest of the world are part of the IEA Table. Higher levels of disaggregation, whenever these are possible, are usually published in the separate accounts of institutions. Even at the first level of disaggregation, any research carried out of the institutional sectors with flows involving more than one row or column of the SAM, also requires the so-called “from whom to whom matrices”. These matrices make it possible to fill in the cells of the sub-matrices of transactions taking place both within domestic institutions, and also between domestic institutions and the rest of the world, which are recorded in the above described current, capital, and financial accounts10 .
Table 7 presents the level of disaggregation classified as the first, which was that rendered possible in the institutions’ current and capital accounts, derived from the IEA Table (see Appendices Table A.1) and the “from whom to whom matrices” for the application to Portugal in 2013.
Just as the matrix form of the production accounts may be easily worked on from the supply and use tables, it would also be possible to work on the matrix form of the institutional accounts if some kind of “from whom to whom tables” were made official. This would be a crucial factor for implementing the
Table 6. Domestic institutions description for the level of disaggregation 1.
Source: Own construction.
(a)Sources: Statistics Portugal (INE); Portuguese Central Bank (Banco de Portugal).
(b)Sources: Statistics Portugal (INE); Portuguese Central Bank (Banco de Portugal).
Table 7. A SAM of Portugal in 2013―level of disaggregation 1. (In millions of euros)
SAM-based approach, in which SAMs with production and institutions accounts, capturing the network of linkages associated to the measured flows of income, would form the basis for macroeconomic models which would be capable of reproducing the multiplier processes that are implicit in the socioeconomic activity of countries.
4. Evidences on the Structural Features of the Socioeconomic Activity of a Country
In Chapter 2, Section 2.2, we first approached the structures of production, income distribution, investment, and transactions with the rest of the world, when we read the rows and the columns of the seven accounts of the level of disaggregation 0 of the SAM of Portugal in 2013―Table 4. As we saw in Chapter 3, higher levels of disaggregation of the SAM and possible extensions and/or complementary information, such as IOM, will certainly improve our knowledge of those structures―Tables 7-9 illustrate this for the case of Portugal in 2013.
An exhaustive reading of the rows and columns of Table 7, such as was carried out for the level of disaggregation 0 (Table 4), would be extensive and time consuming and would be beyond the scope of this study. In this chapter we examine the values in the proposed SAM that can be used to describe the structural features of the socio-economic activity of a country, in transition between Chapters 2 and 3, in which a SAM and its possibilities of work were presented, and in Chapter 5, where multiplier effects on the distribution of generated income will be studied.
Returning to Chapter 2, and to our previous analysis of Table 4, in the case of the aggregate income, associated with the compensation of the factors of production, which total 156,472 million Euros, from Table 7, we now can see that 76,617 million Euros was compensation of employees―row and column 1, and 79,856 million Euros account for compensation of other factors of production, namely employers and the self-employed, land, and capital (including property income)―row and column 2. Row 1 shows that the total received as compensation of employees corresponded to a part of the gross added value11 generated in the domestic activities by residents and non-residents, in the sum of 76,280 million Euros, to which are added 337 million Euros generated abroad by residents. In turn, row 2 shows that the total received as compensation of other factors of production corresponded to the other part of the gross added value11 generated in the domestic activities by residents and non-residents, in the sum of 73,454 million Euros, to which 6402 million Euros generated abroad by residents are added. Next we examine the part generated from domestic activities, disaggregated in 10 sectors, which will improve the information available for the study of the functional distribution of generated income, as shown in Table 10.
Column 1 shows that the total paid as compensation of employees corresponded to a part of the gross national income generated in the domestic economy
Table 8. The intermediate consumption of an activity by activity (or industry by industry) IOM of Portugal in 2013―level of disaggregation 1. (In millions of euros)
Sources: Statistics Portugal (INE); World Input-Output Database (WIOD). Note: In this table the structure of an aggregated version of the National Input-Output Table (industry by industry) released by WIOD in November 2016, is adapted to the totals of the Input-Output Table (product by product) released by INE in December 2016.
Table 9. The intermediate consumption of a product by product IOM of Portugal in 2013 level of disaggregation 1. (In millions of euros)
Sources: Statistics Portugal (INE).
and abroad by residents that is received by households, in the sum of 76,246 million Euros, to which are added 371 million Euros generated in the domestic economy by non-residents and sent to the rest of the world.
In column 2, the total paid as compensation of other factors of production was decomposed in the part of the gross national income generated11 in the domestic economy and abroad by residents which was received by the various institutional sectors, in the sum of 69,440 million Euros, to which are added 10,415 million Euros generated in the domestic economy by non-residents and sent to the rest of the world. From the part received by domestic institutions, we can also identify the structure of the institutional distribution of generated income, as shown in Table 11.
Continuing at the level of production accounts, the activities account, of the level of disaggregation 0, is now disaggregated into ten activity sectors, or industries―rows and columns 3 to 12, with more detailed information regarding the production value (at basic prices), or output of goods and services (in rows) and the costs associated to the process of production (in columns), which total 307,861 million Euros for the Portuguese economy in 2013, as we had also seen in Chapter 2. Table 12, complemented by Table 13, show the structure of the former, Table 14, complemented by Table 15, show the structure of the latter.
In the structure of the SAM base form that is proposed in Chapter 2, at the level of disaggregation 0, the products account is the other of the three components of the production accounts, in addition to the factors of production and activities accounts. Similar to that which was carried out in the activities account, at the level of disaggregation 1, the products account is now disaggregated into ten products, or goods and services―rows and columns 13 to 22, allowing for more detailed information about the components of the aggregate demand (in row) and supply (in column) of the goods and services in the Portuguese economy in 2013, which was in the amount of 393,935 million Euros, as we saw in Chapter 2. Table 16, complemented by Table 17, show the structure of aggregate demand and Table 18 show the structure of aggregate supply. Within aggregate demand, the intermediate consumption can also be specified by
Table 10. Functional distribution of generated income12 in Portugal in 2013.
Source: Table 7.
Table 11. Institutional distribution of generated income13 in Portugal in 2013.
Source: Table 7.
Table 14 and Table 15. Within aggregate supply, the output of goods and services can also be specified by Table 12 and Table 13.
From the level of disaggregation 1 of the products account, and considering what was explained in Section 2.3 of Chapter 2 regarding the calculation of the Gross Domestic Product in the expenditure approach, it is also possible to decompose that macroeconomic aggregate by goods and services, as shown in Table 19.
Within domestic institutions accounts, in the current account, as was mentioned in Chapter 2, we can see the origin (in row) and destination or use (in column) of the aggregate income of institutions, which was in the sum of 263,158 million Euros, in the case of Portugal in 2013. As was also seen in Chapter 3, at the level of disaggregation 1, our application now has five institutional sectors, providing more details about the available information for our study. Table 20 and Table 21 show the structures of those two perspectives.
On the other hand, as already mentioned in Chapter 3, Section 3.2, through the current account we can see how national income is transformed into disposable income through the receipt and payment of current transfers, and how the latter is distributed between final consumption and saving. As was explained in Chapter 2, Section 2.3, disposable income is calculated outside the SAM, as well as, the structures of its distribution and use. For the case of Portugal in 2013, these amounts can be seen in Table 22.
Table 12. Output of industries (at basic prices) in Portugal in 2013 by goods and services.
Source: Table 7.
Table 13. Output of institutions (at basic prices) in Portugal in 2013.
Source: statistics portugal (INE).
The other two of the three domestic institutions accounts identified in Chapter 3, are the capital and the financial accounts, from which it is possible to obtain information on investment, respectively, in non-financial and financial assets and also the flows of funds associated with the corresponding acquisitions and disposals. Because it was not possible to disaggregate the financial account, we will not explore the part relating to financial assets, and neither will we directly explore the rest of the world account, as the details associated with it that are considered to be of interest for the purpose of this study were approached with the accounts that had been previously worked on.
Thus, returning to the capital account, as was seen in Chapter 2, the investment funds (in row) and aggregate investment (in column) of institutions, amounted to 31,148 million Euros, in Portugal in 2013. The corresponding structures can be seen in Table 23 and Table 24.
As was carried out by Santos [13] [17] [18] , for example, the main items of income and expenditure of the institutional sectors and of the rest of the world can be identified from the respective rows and columns of the SAM, when it is, at least, at a first level of disaggregation, as shown in Table 7 for our application to Portugal in 2013. In the case of the institutional sectors, in which we can talk about balance sheets of the institutions: the total balancing item is the corresponding net lending/borrowing; the current balancing item is the gross saving, and; the capital balancing item is the difference between the first and the second. In the case of the rest of the world we can talk about balance of payments and its components.
5. Multiplier Effects Associated with the Institutional Distribution of Income
Returning to the systematization previously adopted by Santos [16] , following
Table 14. Costs with the output of industries in Portugal in 2013.
Source: Table 7.
[19] and [20] , in keeping with the research of Pyatt and Roe [21] , and Pyatt and Round [5] , the approach adopted in this chapter will be based on the SAM and will be centered on the use of multipliers and their decomposition.
Thus, the following assumptions will be considered:
- The structural features for production and income distribution identified in Chapters 2 and 4 are the relevant ones.
- The production technology and resource endowment are provided.
- There is excess capacity in the economy.
Since income distribution includes redistribution, namely transfers within institutions, prices will not be separated from quantities. Therefore, the whole mathematical and analytical study will be made at the level of values. On the other hand, since the analysis will be static or comparative static, data will be shown at current prices.
5.1. Methodology
As shown in Table 25, the SAM accounts will be classified and organized as exogenous and endogenous, and, consequently, the flows or transactions in each cell of the SAM will be considered exogenous or endogenous, according to the corresponding row and column accounts.
From Table 25, it can be stated that
(1)
(2)
The amount that the endogenous accounts receive is equal to the amount that they spend (row totals equal column totals). In other words, in aggregate terms, total injections from the exogenous into the endogenous accounts (i.e. the column sum of “x”) are equal to total leakages from the endogenous into the exogenous accounts, i.e. considering i’ to be the unitary vector (row), the column sum of “1” is:
. (3)
In the structure of Table 25, if the entries in the N matrix are divided by the corresponding total expenditures, a corresponding matrix (squared) can be defined of the average expenditure propensities of the endogenous accounts within
Table 15. Decomposition of intermediate consumption costs with the output of industries in Portugal in 2013. (In %)
Source: Table 8.
Table 16. Aggregate demand of goods and services in Portugal in 2013.
Source: Table 7.
the endogenous accounts or of the use of resources within those accounts. Calling this matrix An, it can be stated that
An=N*y^n-1 (4)
N=An*y^n . (5)
Considering Equation (1), . (6)
Therefore, . (7)
We thus calculate the equation that provides the total receipts of the endogenous accounts (yn), by multiplying the injections “x” by the matrix of the accounting multipliers:
. (8)
On the other hand, if the entries in the L matrix are divided by the corresponding total expenditures, a corresponding matrix (not squared) can be defined of the average expenditure propensities of the endogenous accounts into the exogenous accounts, or of the use of resources from the endogenous accounts into the exogenous accounts. Calling this matrix Al, it can be stated that
A1=L*y^n-1 (9)
L=A1*y^n . (10)
Considering Equation (2), . (11)
Thus, . (12)
Table 17. Decomposition of intermediate consumption of goods and services in Portugal in 2013. (In %)
Source: Table 9.
Table 18. Aggregate supply of goods and services in Portugal in 2013.
Source: Table 7.
Table 19. Decomposition by goods and services of gross domestic product of Portugal in 2013.
Source: Table 7.
Therefore, with the accounting multipliers, the impact of changes in receipts is analysed at the moment they occur, assuming that the structure of expenditure in the economy does not change.
Accounting multipliers can be decomposed, if we consider the An matrix and two other ones with the same size: Bn―with the diagonal of An, whilst all the other elements are null; and Cn―with a null diagonal, but with all the other elements of An. In this way, it can be stated that
. (13)
Thus, from Equation (6):
Table 20. Origin of aggregate income of institutions in Portugal in 2013.
Source: Table 7.
14(14)
Therefore:
. (15)
The accounting multiplier matrix is thus decomposed into multiplicative components, each of which relates to a particular kind of connection in the
Table 21. Use of aggregate income of institutions in Portugal in 2013.
Source: Table 7.
Table 22. Distribution and use of disposable income among institutions in Portugal in 2013.
Source: Table 5.
system as a whole―Stone [22] 15.
- The intragroup or direct effects matrix, which represents the effects of the initial exogenous injection within the groups of accounts into which it had originally entered:
. (16)
- The intergroup or indirect effects matrix, which represents the effects of the exogenous injection into the groups of accounts, after its repercussions have
Table 23. Investment funds in Portugal in 2013.
Source: Table 7.
completed a tour through all the groups and returned to the one which they had originally entered. In other words, if we consider “t” to be the number of groups of accounts:
(17)
- The extragroup, or cross effects matrix, which represents the effects of the exogenous injection when it has completed a tour outside its original group without returning to it, or, in other words, when it has moved around the whole system and ended up in one of the other groups. Thus, for the “t” groups of accounts:
(18)
Table 24. Aggregate investment in Portugal in 2013.
Source: Table 7.
Table 25. The SAM in endogenous and exogenous accounts.
where: N = matrix of flows between endogenous accounts; n = vector of the (corresponding) row sums. X = matrix of flows between exogenous and endogenous accounts (injections from first into second); x = vector of the (corresponding) row sums. L = matrix of flows between endogenous and exogenous accounts (leakages from first into second); l = vector of the (corresponding) row sums. R = matrix of flows between exogenous accounts; r = vector of the (corresponding) row sums. yn = vector (column) of the receipts of the endogenous accounts ( : diagonal; :inverse); = vector (row) of the expenditures of the same accounts. yx = vector (column) of the receipts of the exogenous accounts; = vector (row) of the expendituresof the same accounts. Source: Pyatt and Round [5] .
The decomposition of the accounting multipliers matrix can also be undertaken in an additive fashion, as follows:
(19)
where I represents the initial injection, and the remaining components are the additional effects associated, respectively, with the three components described above (M1, M2 and M3).
Considering the methodology described above, in the application to our case study (Portugal in 2013), the classification of the SAM accounts into endogenous and exogenous was conditioned by the purpose of this part of our study, that is, the study of the multiplier effects of the socioeconomic activity of a country associated with the institutional distribution of income. Therefore, the factors of production and the current account of domestic institutions were set as endogenous, and all the other SAM accounts as exogenous. Thus, in the exogenous part there are: production, represented by the activities and products SAM accounts; investment, represented by the capital and financial SAM accounts of domestic institutions, and; rest of the world.
The following analysis is based on the calculated multipliers, from which quantitative approximations of the effects of unitary changes (positive or negative) on the income of endogenous accounts will be identified, that is to say, in the compensation of the factors of production, and in the aggregate income of domestic institutions. We will try to bear in mind that the socioeconomic activity of a country involves industries and institutions, as well as the network of linkages captured by the SAM that underlie these quantitative approximations. We will consider this network of linkages, as explained above and schematized in Chapter 2―Outline 1, and the corresponding structural features, systematized in Chapter 4, whose detail depends on the disaggregation, extension, and complements of the SAM accounts, as was explained in Chapter 3.
5.2. Analysis
As was seen in the methodology, all the changes that can be experimented are in the X matrix of Table 25, that is to say, in the matrix of transactions between exogenous and endogenous accounts (injections from first into second). In our case study, this means that the possible changes that can be experimented are in: compensation of factors of production or gross added value; net taxes on production and products received by the general government; compensation of factors of production, and current transfers received from the rest of the world16.
The following analysis will be carried out on the effects of positive or negative unitary changes in the income of endogenous accounts. To simplify in the reading of the quantitative approximations for the multiplier effects in our application, positive changes will be considered, whereby it is up to one to decide whether to read the effects of negative changes, with the possibility of applying the opposite mathematical sign.
Recalling that which was seen above, regarding the exogenous accounts, in the production accounts, the activities accounts record the output of goods and services and the costs associated with the process of production, and the products accounts record the demand and supply of goods and services. In domestic institutions accounts, the capital and the financial accounts record investment, respectively, in non-financial and financial assets and the flows of funds associated with the corresponding acquisitions and disposals. The rest of the world account records all the transactions between the resident and the non-resident actors, in all the other accounts.
Initial direct effects will be identified through the average expenditure propensities and global effects through the accounting multipliers and its components.
Originating from Outline 1, Outline 2 and Outline 3 will help to identify the changes in each of the two endogenous groups of accounts in the study of the associated multiplier effects.
1) Effects of changes in the income of factors of production account.
In Outline 2, at the 0 level of disaggregation, the factors of production account is represented by f, which is disaggregated respectively into labour (l), and others (o), at level 1 of disaggregation, representing employees and other factors of production (employers and the self-employed; capital).

Outline 2. A SAM base form (level of disaggregation 0)―schematic representation of the nominal flows between the accounts, presented and described in Table 1 and Table 3, adapted to study a). Source: Outline 1. Legend: 1) exogenous groups of accounts are written in italic letters; 2) thicker lines identify the group of accounts (circles) and the flows (arrows) that are first affected by the unitary change, or injection of income; 3) thicker solid arrows represent the possible origins of that change, and thicker dashed lines represent the destinations of the same. Note: the disaggregation from level 0 to level 1 underlies the transition from Outline 2 to Tables 26-28, and to the analysis of the results of the SAM-based approach to our case study.
Following the solid thicker arrows of Outline 2, changes in the aggregate income received as compensation of factors of production can be made from the activities accounts (a at the level of disaggregation 0 and a1-a10 at the level of disaggregation 1), and/or from the rest of the world account (rw at both levels of disaggregation). Therefore, these changes can have their origin, respectively, in the gross added value and/or in the compensation of factors of production received from the rest of the world. Establishing the link with the types of income identified in the Section 2.3 of Chapter 2, we are dealing with the income generated in the domestic economy by residents and non-residents [gross added value; T(f,a)], and in the rest of the world by residents [T(f,rw)].
Following the dashed thicker arrows of Outline 2, these changes will have initial direct effects both on the current account of domestic institutions (dic at the level of disaggregation 0, and h, nfc, fc, g and npi at the level of disaggregation 1)

Outline 3. A SAM base form (level of disaggregation 0)―schematic representation of the nominal flows between the accounts, presented and described in Table 1 and Table 3, adapted to study b). Source: Outline 1. Legend: 1) exogenous groups of accounts are written in italic letters; 2) thicker lines identify the group of accounts (circles) and the flows (arrows) that are firstly affected by the unitary change, or injection of income; 3) thicker solid arrows represent the possible origins of that change and thicker dashed lines represent the destinations of the same. Note: the disaggregation from level 0 to level 1 is underlying to the transition from Outline 3 to Tables 29-31 and to the analysis of the results of the SAM-based approach to our case study.
and on the rest of the world account (rw at both levels of disaggregation). These effects are quantified by the average expenditure propensities and are presented in Table 26.
Confirming the structural features of the institutional distribution of the generated income evidenced by Table 11, in Chapter 4 it can be seen that (initially) each additional unit of income generated by labour (employees) will directly add 0.995 to the income of households (domestic institutions―residents), the remaining 0.005 being sent to the rest of the world (the part generated in the economy by non-residents). In turn, (initially) each additional unit of income generated by other factors of production (employers, own account workers and capital) will directly add 0.87 to the income of domestic institutions (0.517 to households, 0.282 to non-financial corporations, 0.07 to others; the residents), the remaining 0.13 being sent to the rest of the world (the part generated in the economy by non-residents).
However, the network of linkages associated with the current account of
Table 26. Initial direct effects of unitary exogenous changes in the aggregate income received as compensation of the factors of production.
Source: Appendices Table A.4.2.
Table 27. Global effects of unitary exogenous changes in the aggregate income received as compensation of the factors of production.
Source: Appendices Table A.4.3.
domestic institutions (dic) will generate multiplier effects, which in the end will have repercussions beyond the initial unit. The structural features of that network are evidenced in Table 20 and Table 21, in Chapter 4, and a quantitative approximation of these effects is made in Table 27.
Table 28. Global effects decomposition of unitary exogenous changes in the aggregate income received as compensation of the factors of production.
Source: Appendices Table A.4.4-A.4.6.
Therefore, after the initial direct effect, in which domestic institutions receive a part of the initial change (0.995 in labour and 0.87 in other factors), it will be used in final consumption [T(p,dic)], current transfers within domestic institutions [T(dic,dic)] and to the rest of the world [T(rw,dic)], or saved [T(dik,dic)]. These flows, which are income in the accounts of destination, will then have their initial direct effects and their corresponding uses. In this way, expenditures and incomes will be multiplied through the network of linkages that we have been studying, until such time as when the sources of income of domestic institutions are affected. The quantitative approximation of the global effect of that process on the aggregate income of domestic institutions, which is shown in Table 27, tells us that the global effects on the aggregate income of domestic institutions of unitary changes in the compensation of labour and other factors of production are, respectively, 1.440 (1.140 for households, 0.253 for general government, and 0.046 for the others), and 1.290 (0.672 for households, 0.291 for non-financial corporations, 0.2014 for general government, and 0.122 for the others).
In the decomposition of these effects, in which there are no intragroup or direct effects, as the initial injection is in the factors of production account, and not in the current account of domestic institutions, from Table 28 we can see that, except for the general government, the greater part of the total global effects are due to extragroup, or cross effects, that is to say, to effects in which the unitary change in the compensation of factors of production moved around the whole system, without returning to the factors of production accounts. This is, certainly due to the redistributive process. In fact, the initial change is at the level of the generated income but the global change is at the level of aggregate income in which the current transfers (determinants of the disposable income) are included.
Table 29. Initial direct effects of unitary exogenous changes in the aggregate income received by domestic institutions.
Source: Appendices Table A.4.2. Note: The values of the final consumption by products can be seen in the source.
Table 30. Global effects of unitary exogenous changes in the aggregate income received by domestic institutions.
Source: Appendices Table A.4.3.
2) Effects of changes in the income of the current account of domestic institutions.
In Outline 3, at the level of disaggregation 0, the current account of domestic institutions is represented by dic, which is disaggregated into households (h), non-financial corporations (nfc), financial corporations (fc), general government (g), and non-profit institutions serving households (npi), at the level of disaggregation 1.
Following the solid thicker arrows of Outline 3, changes in the total aggregate income of domestic institutions can be made from the activities accounts (a at
Table 31. Global effects decomposition of unitary exogenous changes in the aggregate income received by domestic institutions.
Sources: Appendices Tables A.4.4-A.4.6.
the level of disaggregation 0 and a1-a10 at the level of disaggregation 1), from the products accounts (p, at the level of disaggregation 0 and p1-p10 at the level of disaggregation 1), and/or from the rest of the world account (rw at both levels of disaggregation). Therefore, these changes can have their origin, respectively, in the net taxes on production, in the net taxes on products, or both, received by the general government, and/or in current transfers received from the rest of the world.
Following the dashed thicker arrows of Outline 3, these changes will have initial direct effects on the own current account of domestic institutions (dic at the level of disaggregation 0, and h, nfc, fc, g and npi at the level of disaggregation 1), on the rest of the world account (rw at both levels of disaggregation), on the products accounts (p, at the level of disaggregation 0 and p1-p10 at the level of disaggregation 1), and on the capital account of domestic institutions (dik, at the level of disaggregation 0 and h, nfc, fc, g and npi at the level of disaggregation 1). These effect are quantified by the average expenditure propensities, and are presented in Table 29.
This results reveal the structural features of the use of aggregate income of institutions evidenced by Table 21, in Chapter 4. In an attempt to extract the main ideas from this results, without being exhaustive, we see that (initially) the great part of each additional unit of income is spent in final consumption (npi: 0.984; h: 0.671; g: 0.509), except for financial and nonfinancial corporations. Transfers within domestic institutions are also relevant (fc: 0.543; g: 0.509; nfc 0.28; h: 0.259), with emphasis on the general government (certainly regarding taxes on income and wealth). The initial direct effect on gross saving is low or negative, except for non-financial corporations (0.710) and financial corporations (0.389).
From here, the associated network of linkages and the corresponding structural features, evidenced by Table 20 and Table 21, in Chapter 4, will generate the already mentioned multiplier effects to and are presented in Table 30. We are now working with the accounts in which the initial unitary change entered is included in the quantitative approximation to its global effects.
Now we have calculated the repercussions on the aggregate income of domestic institutions of a multiplier process which, except for the case of the non-financial and financial corporations, went mainly through the products account, affecting the demand and supply of goods and services (see the structural features evidenced in Table 16 and Table 18, in Chapter 4) and through the capital account of domestic institutions, affecting investment funds and aggregate investment (see the structural features evidenced in Table 23 and Table 24, in Chapter 4). The global effect is greater in the aggregate income of financial corporations (1.845) and of general government (1.748).
In the decomposition of those effects, as presented in Table 31, now without the initial unitary change, the intragroup or direct effects that represent the effects of the initial change within the current account of domestic institutions, in which it originally entered, is the second most important component, certainly reflecting the importance of the domestic transfers within domestic institutions, with the consequent repercussions on the redistribution of income. As in 1), the extragroup or cross effects are the most important component, that is to say, the effects in which the unitary change in the domestic institutions current account moved around the whole system without returning to it.
Although less significant, the intergroup or indirect effects, that is to say, the effects that return to the domestic institutions current account should not be neglected, mainly because they also are associated to the redistribution of income.
Both in 1) and in 2), it is important not to forget that, although the structural features of the socioeconomic activity of a country―Portugal in 2013 in this case―are influencing the results of the studied effects, the change of these structural features is not assumed by the methodology adopted in our modelling exercise. On the other hand, many effects will surely be lost on the part of the network of linkages captured by the SAM that was set as exogenous. However, it was possible to evidence some aspects of the multiplier effects associated with the socioeconomic activity of a country, and its underlying structural features, namely the institutional distribution of income.
On the other hand, it was also possible to identify a direct interconnection between functional and institutional distribution income, the former being only associated with generated income, and the latter is associated both with generated and disposable income. As previously mentioned, generated income is the gross added value generated by industries (or activities), through the use of factors of production―represented in Outlines 1-3 by T(f,a), and T(f,rw). Therefore, the study of the (institutional) redistribution of income cannot neglect the interconnection between functional and institutional distribution of the generated income.
Further research should be carried out in organising endogenous and exogenous accounts in different ways, in order to evidence the multiplier effects of parts with other structural features.
6. Summary and Concluding Remarks
A study using a matrix format with the complexity of the network of linkages of the monetary flows underlying the activity of a country undeniably has potential and can be perceived as a novelty in several areas, whether in an academic context or not. Such a potential is increased when we are able to include in that study production and institutions simultaneously, at levels of detail, and with specificities controlled by us, even if this is conditioned by the information available.
As the SAM is a working instrument with the above-mentioned potential, my challenge is to contribute to the definition of a methodology that permits its adoption and manipulation by as many users as possible, thus contributing to improving the knowledge regarding different aspects of the so-called socioeconomic activity of a country. This is a motivation that has been providing more and more significance to my research on the SAM-based approach, which, when used in the proper way, can have an impact at different levels of that activity.
In line with my previous research, this paper aims to progress the topic one more step, as this time it complements the SAM with the Input-Output Matrix (IOM)17 to specify the linkages within industries related with the intermediate consumption costs with the corresponding outputs, and also to decompose the part of aggregate demand that relates to the intermediate consumption of goods and services. This innovation was introduced with the purpose of exploring the Graham Pyatt’s statement mentioned in Section 3.1 of Chapter 3.
Similar to my previous research, a top-down approach was adopted, and the National Accounts were used as the base source of information. Following the rules and the nomenclatures of the latest version of the SNA [1] , a SAM base form was schematically represented as a summary of all the flows measured by the National Accounts, from which the levels of detail can be chosen, through disaggregation, extension, and complements. This allows one to evidence those structural features that can be very useful to understand and study the socioeconomic activity of a country.
Therefore, as the National Accounts are produced in a more or less complete and adapted way for almost every country in the world, and as its disclosure is regular, (at least partially) free, and credible, the adoption of the proposed methodology becomes accessible to a great number of users and can have more uses.
The traditional macroeconomic aggregates (GDP, GNI, DI, etc.) and types of income were identified from the SAM, thus facilitating research covering the production and generation of income, as well as its corresponding distribution, redistribution and accumulation. All of this is accompanied by the underlying structural features, whose details and use depend on the numerical and algebraic versions adopted in the SAM (and/or IOM)-based approach to the aspects to be studied.
The structural features of the functional and institutional distribution of the generated income which is evidenced through the factors of production SAM accounts, allow us to identify how the compensation of factors of production (labour―employees, employers and self-employed workers; and capital) is distributed within industries and institutions, as well as what is categorised as domestic (generated in the country18, by residents and non-residents) and national (generated in the country and in the rest of the world by residents). From the point of view of income distribution, the experiments presented in this paper allowed one to conclude that the factors of production SAM accounts are crucial in a socioeconomic activity of a country perspective (i.e., when production and institutions are considered together for the study of the monetary flows that underlie the activity of a country), because they establish the link between production and everything else―in other words, between the generation, distribution, and use of income. Regarding production, the activities (or industries) SAM accounts provide the output of goods and services and the associated costs, whose details can be complemented with an industry by industry IOM of domestic and imported intermediate consumption by, and between industries. The structural features evidenced by this part are determinant for a study about the influence of production and generation of income on the distribution of income. I think that the first step in exploring the above mentioned Graham Pyatt’s statement has been made.
On the other hand, for a study on the monetary flows of the activity of a country, the specification of the market of goods and services, as given by the products SAM accounts, cannot be neglected, not only on account of its implicit connection to the generation of income, through the output and the intermediate consumption of goods and services, but also due to its role in the use of disposable income, through final consumption, and gross capital formation. Underlying all these aspects are also the imports and exports of goods and services, which are very important for the knowledge of the relations between the country and the rest of the world. In this case, a product by product IOM can complement the details regarding the domestic and imported intermediate consumption of goods and services.
Therefore, through the SAM production accounts (factors of production, activities and products) we can study the generation of income and the corresponding functional and institutional distribution, as well as the use of the disposable income of institutions in the market of goods and services. For this part, IOMs can complement the details regarding domestic and imported intermediate consumption of activities (industries) and of products (goods and services).
However, it is through the current account of domestic institutions that is possible to study the transition from the institutional distribution of the generated income to the (institutional distribution of the) disposable income, as well as the details of the origin and use of the so-called aggregate income of the institutions. The aggregate income, expressed as the row and column totals of that account, is the (national) generated income19 added to net taxes on products and imports (for the case of the general government) and current transfers received by domestic institutions from domestic institutions and from the rest of the world.
Finally, the institutional distribution of the so-called accumulated income (income associated to investment) can be studied through the remaining two SAM accounts. Thus, the inflows and the outflows associated with the investment in non-financial and financial assets of domestic institutions can be studied through the capital and financial accounts, respectively. This is the part that was less explored previously in the scope of this research, which is a deficiency of this paper, mainly due to the unavailability of the “from-whom-to-whom” matrices for the financial transactions of domestic institutions over the last decades for my case study―Portugal. However, considering the importance that investment can have on production capacity and, consequently, on the generation of income, it warrants its place in the study of the socioeconomic activity of a country and will be one of my future research priorities.
Therefore, depending on the disaggregation, extension and complements of the SAM accounts, more or less complex networks of linkages of flows with different intensities can be constructed for specific periods and geographical areas, evidencing the underlying structural features and enabling the study of the associated multiplier effects. This was experimented for Portugal in 2013, for a so-called level of disaggregation 1, representing: two factors of production―labour (employees) and others; ten products (goods and services); ten activities (industries); five domestic institutions―households, nonfinancial corporations, financial corporations, government and non-profit institutions serving households; and the rest of the world. With domestic institutions being organized in current, capital and financial accounts, a SAM with thirty four rows and columns allowed for a SAM-based approach to the multiplier effects associated to the institutional distribution of income.
In this approach, a numerical version was converted into an algebraic version that is consistent with an accounting multipliers methodology, which has been adapted to the study of the above mentioned effects. The then identified quantitative approximations of the effects of unitary changes on the compensation of the factors of production and on the aggregate income of domestic institutions revealed a close relation with the structural features evidenced by the numerical SAM version. A direct interconnection between functional and institutional distribution income was also evidenced. As the functional distribution of income is associated to the generated income and the institutional distribution of income associated with both generated and disposable income, the study of the institutional distribution of income implicitly involves the corresponding functional distribution. Thus, as the latter is a consequence of the production process and structure, its study must also be considered, whilst not neglecting the contribution that can be provided by the complementary IOMs. This is the main contribution of the research presented in this paper, along with the underlying methodological improvements.
Therefore, a SAM-based approach to the monetary or nominal flows between production and institutions that occurs in a particular geographical space was proposed, and the underlying methodology was exposed.
It was shown how the SAM numerical versions allow for the reading of the reality under study, and how details can be added to that reading through disaggregation, extension, and complements of the SAM accounts. It is also worth mentioning the importance of the possible comparisons in time and space, which is implicitly enabled through the adoption of the National Accounts and underlying SNA in the construction of the SAMs (and IOMs).
Interventions regarding the functioning of that same reality were experimented through using a SAM algebraic version, based on accounting multipliers.
In this article special attention was given, on the one hand, to the structural features of the socioeconomic activity of a country, which was evidenced using a SAM numerical version, and, on the other hand, to the multiplier effects that some of these structural features generate, which was evidenced using a SAM algebraic version. Regarding the application to Portugal in 2013 (our case study), I wish that it could have been possible to avoid some of the deficiencies of this paper and to have been able to work with more disaggregated “other factors of production” and “financial account of domestic institutions”, as well as with a SAM-based model (or SAM algebraic version) which would have allowed structural changes and with less restrictive assumptions. These are limitations to the way that the whole explanation was illustrated, and they are seen as being guidelines for future research, all of which would resume previous research20.
Other aspects, which so far have not gone beyond my research intentions, could also provide a great contribution for the knowledge of the socioeconomic activity of a country, namely: add stocks to flows and study wealth and income21; articulate, in some way, the modelling of the SAM with the modelling of some of the complements used for the study of specific details―in the case of this article, the IOM; explore the possibility of working with the personal distribution of income in a SAM framework―together with the institutional distribution of income, in order to study problems such as poverty and corruption; identify and evaluate flows that are representative of the socioeconomic activity of a country (in the sense that they affect, directly or indirectly, the generation of income), yet are not measured or calculated through imputations with the National Accounts―namely non-paid work or mixed income.
The above described empirical evidence enabled by a SAM-based approach and its methodological details showed that the potential of a SAM for the knowledge of the socioeconomic activity of a country is undeniable.
Acknowledgements
The financial support from national funds by FCT (Fundação para a Ciência e a Tecnologia) is gratefully acknowledged. This article is part of the Strategic Project UID/ECO/00436/2013.
Cite this paper
Santos, S. (2018) A Matrix Approach to the Socioeconomic Activity of a Country. Theoretical Economics Letters, 8, 1083-1135. https://doi.org/10.4236/tel.2018.85075
References
- 1. Inter-Secretariat Working Group on National Accounts (United Nations, European Commission, International Monetary Fund, Organisation for Economic Cooperation and Development and World Bank)—ISWGNA (2009) System of National Accounts 2008. Series F, No. 2, Rev. 5, United Nations, New York.
- 2. Pyatt, G. (1991) SAMs, the SNA and National Accounting Capabilities. Review of Income and Wealth, 37, 177-198. https://doi.org/10.1111/j.1475-4991.1991.tb00353.x
- 3. Pyatt, G. (1991) Fundamentals of Social Accounting. Economic Systems Research, 3, 315-341. https://doi.org/10.1080/09535319100000024
- 4. Pyatt, G. (1988) A SAM Approach to Modeling. Journal of Policy Modeling, 10, 327-352. https://doi.org/10.1016/0161-8938(88)90026-9
- 5. Pyatt, G. and Round, J. (1985) Accounting and Fixed Price Multipliers in a Social Accounting Matrix Framework. In: Pyatt, G. and Round, J., Coord., Social Accounting Matrices, A Basis for Planning, A World Bank Symposium, World Bank, 52-69.
- 6. Stone, R. (1986) Nobel Memorial Lecture 1984. The Accounts of Society. Journal of Applied Econometrics, 1, 5-28. https://doi.org/10.1002/jae.3950010103
- 7. Stone, R. (1981) Aspects of Economic and Social Modelling. Editions Droz, Genève. (Suisse)
- 8. Stone, R. (1973) A System of Social Matrices. Review of Income and Wealth, 19, 143-166. https://doi.org/10.1111/j.1475-4991.1973.tb00879.x
- 9. Santos, S. (1999) The Social Accounting Matrix as a Working Instrument to Define Economic Policy. Application to Portugal during the 1986-90 Period, with Emphasis on the Agroindustrial Sector. Phd Dissertation, ISEG-TULisboa, Lisbon. (Only Available in Portuguese; with Abstract in English)
- 10. Santos, S. (2015) Assessing the Distribution and Use of Income and Changes in Income with Social Accounting Matrices. In: Godinho, P. and Dias, J., Eds., Assessment Methodologies: Energy, Mobility and Other Real World Applications, Imprensa da Universidade de Coimbra, Coimbra (Portugal), 311-342. https://doi.org/10.14195/978-989-26-1039-9_14
- 11. Santos, S. (2015) The Social Accounting Matrix (SAM). In: Murray, J., McBain, D. and Wiedmann, T., Eds., The Sustainability Practitioner’s Guide to Social Analysis and Assessment, Common Ground Publishing LLC, Champaign-Illinois, 74-86.
- 12. Santos, S. (2012) Using the SNA and SAMs for a Better (Socio-)Economic Modelling. China-USA Business Review, 11, 385-407.
- 13. Santos, S. (2012) A SAM (Social Accounting Matrix) Approach to the Policy Decision Process. Working Paper No.28 /2012/ DE (Departamento de Economia) /UECE (Unidade de Estudos sobre a Complexidade em Economia), ISEG (Instituto Superior de Economia e Gestao)/UTL (Universidade Técnica de Lisboa).
- 14. Pyatt, G. (1999) Some Relationships between T-Accounts, Input-Output Tables and Social Accounting Matrices. Economic Systems Research, 11, 365-387. https://doi.org/10.1080/09535319900000027
- 15. Santos, S. (2011) The Underlying Database of an Instrument for Economic and Social Policy Analysis for the Azores. Application and Extension to 2005. Working Paper No. 14/2011/CEEAplA (Research Centre for Applied Economics in the Atlantic), University of Azores and Madeira.
- 16. Santos, S. (2010) A Quantitative Approach to the Effects of Social Policy Measures. An Application to Portugal, Using Social Accounting Matrices. MPRA (Munich Personal RePEc Archive) Paper No. 23676, EERI (Economics and Econometrics Research Institute) RP (Research Papers) 33.
- 17. Santos, S. (2013) Looking for Empirical Evidence about the Socio-Economic Activity of Countries with Social Accounting Matrices. International Journal of Humanities and Social Science, 3, 85-100.
- 18. Santos, S. (2011) Measuring (Socio-)Economic Systems Using the SNA. A SAM Approach. MPRA (Munich Personal RePEc Archive) Paper No. 32758.
- 19. Santos, S. (2007) Modelling Economic Circuit Flows in a Social Accounting Matrix Framework. An Application to Portugal. Applied Economics, 39, 1753-1771. https://doi.org/10.1080/00036840500447864
- 20. Santos, S. (2004) Portuguese Net Borrowing and the Government Budget Balance. A SAM Approach. Journal of Policy Modeling, 26, 703-717. https://doi.org/10.1016/j.jpolmod.2004.04.014
- 21. Pyatt, G. and Roe, A. (1977) Social Accounting for Development Planning with Special Reference to Sri Lanka. Cambridge University Press, Cambridge.
- 22. Stone, R. (1985) The Disaggregation of the Household Sector in the National Accounts. In: Pyatt, G. and Round, J., Coord., Social Accounting Matrices. A Basis for Planning, Washington, US, The World Bank, 145-185.
- 23. Santos, S. (2016) The Informal Aspects of the Activity of Countries Studied through Social Accounting and Socio-Demographic Matrices. Journal of Economic and Social Thought, 3, 49-78. https://doi.org/10.1453/jest.v3i1.620
- 24. Santos, S. (2014) The Social Accounting Matrix and the Socio-Demographic Matrix-Based Approaches for Studying the Socioeconomics of Ageing. Theoretical and Practical Research in Economic Fields, 5, 63-72. https://doi.org/10.14505/tpref.v4.2(8).06
- 25. Santos, S. (2009) From the System of National Accounts (SNA) to a Social Accounting Matrix (SAM)-Based Model. An Application to Portugal. Edicoes Almedina, Coimbra-Portugal.
- 26. Stone, R. (1986) Demographic Input-Output: An Extension of Social Accounting. In: Sohn, I., Coord., Readings in Input-Output Analysis: Theory and Applications, Oxford University Press, Oxford, USA, 151-172.
- 27. Stone, R. (1975) Towards a System of Social and Demographic Statistics. Studies in Methods, Series F, No. 18, United Nations, New York.
Appendices
http://pascal.iseg.utl.pt/~ssantos/(TEL)APPENDICES.pdf
NOTES
1This article is a version of the Munich Personal RePEc Archive Paper No. 79742.
2Among the works of those authors I would like to highlight the following: Pyatt [2] [3] [4] ; Pyatt and Round [5] ; Stone [6] [7] [8] .
3Also referred to as gross added value in T(f,a).
4The adjustment made for the change in pension entitlements (D8), included in T(dic,dic), is not a current transfer but, due to its insignificance (0.3% of the total current transfers within domestic institutions in 2013), I did not change the designation of this part of the SAM.
5Received by residents and non-residents working in the Portuguese economic territory. This amount is the gross added value and does not include taxes and subsidies on production and imports.
6Received by residents working in the rest of the world.
7Paid to residents in the Portuguese economic territory. This amount is the gross national income and does not include taxes and subsidies on production and imports.
8Due to the conventions underlying the SAM structure, this negative (net) amount represents a receipt and not an expenditure, that is, the amount received by activities as subsidies on production was greater than the amount expended in taxes on production.
9An example for a Portuguese region―Azores, can be seen in Santos [15] .
10For the application to Portugal in 2013 here presented, Statistics Portugal (INE), who works and discloses the non-financial National Accounts, provided (particularly) the “from whom to whom matrices” for the flows covered by the current an capital accounts to which those matrices were needed. However, that was not possible for the flows covered by the financial account, worked and disclosed by the Portuguese Central Bank (Banco de Portugal). That is why the financial SAM account is not disaggregated, like the current and capital accounts are. The above mentioned “from whom to whom matrices” are not shown in this article because they are considered confidential by Statistics Portugal (INE).
11Without net taxes on production and imports.
12The difference between the total gross domestic income presented in this table and the gross domestic product presented in Section 2.3 of Chapter 2 is the total net taxes on production and imports.
13The difference between the total gross national income presented in this table and the gross national product presented in Section 2.3 of Chapter 2 is the net taxes on production and imports received by the general government.
14 .
15For a detailed breakdown and explanation of these components, see, for example, Stone [ [22] , pp. 156-162]; Pyatt and Round [ [5] , pp. 192-197]; Santos [ [9] , pp. 67-69].
16It is easier to identify these flows at the level of disaggregation 0, through Table 1 and Table 3, as well as Outlines 1 to 3, which are, respectively: T(f,a); T(dic,a); T(dic,p); T(f,rw); T(dic,rw).
17Similarly, some experiments to complement the SAM with the Socio Demographic Matrix were carried out previously, as can be seen in Santos [23] and [24] .
18Or “economic territory”, commonly defined as “the area under the effective economic control of a single government” [1, paragraph 26.25―paragraph 26.26, gives some more details about the definition].
19Generated by residents in the economic territory and in rest of the world.
20For example: Santos [23] works with the “other factors of production” account disaggregated in: informal labour (employers and own account (or self-employed) workers) and capital; Santos [9] works with the “financial account of domestic institutions” disaggregated in the five domestic institutions considered here for the current and the capital accounts; and Santos [25] and [15] works with a SAM-based model that designate initially of linear, and after of master.
21Pyatt [3] addressed this in a way somewhat similar to that provided in a Socio Demographic Matrix for flows and stocks of persons, as proposed by Stone [26] and [27] and applied by Santos [23] and [24] , as mentioned above.