Open Journal of Composite Materials, 2012, 2, 125-132
http://dx.doi.org/10.4236/ojcm.2012.24015 Published Online October 2012 (http://www.SciRP.org/journal/ojcm)
125
Bounding Surface Approach to the Modeling of
Anisotropic Fatigue Damage in Woven Fabric Composites
Chao Wen1, Siamak Yazdani2, Yail J. Kim2, Magdy Abdelrahman2
1Black & Veatch Corporation, Overland Park, USA; 2North Dakota State University, Fargo, USA.
Email: wenc@bv.com, frank.yazdani@ndsu.edu, Jimmy.Kim@ndsu.edu, M.Abdelrahman@ndsu.edu
Received June 19th, 2012; revised July 14th, 2012; accepted July 23rd, 2012
ABSTRACT
A general approach for the modeling of fatigue induced damage in woven fabric composites and under multi-axial
stress state is outlined in this paper. Guided by isotropic hardening/softening theories of plasticity and damage mechan-
ics, a generalized bounding surface approach is presented. It is argued that the limit surface is only a special case in
such a formulation when the fatigue cycle is set to one and that under fatigue environment the limit surface contracts to
a failure (residual strength) state based on the number of cycle, stress path, and stress magnitude. Within the formula-
tion, specific kinetic relations for microcrack growth are postulated for woven fabric composites and a new direction
function is specified to capture strength anisotropy of the material. Anisotropic stiffness degradations and inelastic
strain propagation due to damage processes are also obtained utilizing damage mechanics formulation. The paper con-
cludes with comparing theoretical predictions against experimental records showing a good agreement.
Keywords: Woven Composites; Fatigue; Damage; Anisotropic; Response Tensor
1. Introduction
A rather large number of scientific papers have been
published on the modeling, simulation, and/or experi-
mental investigation of composite materials under fatigue
loading. The majority of the published works have ad-
dressed various topics associated with the uniaxial stress
path loading. By comparison, the amount of work on the
multiaxial modeling has been small. For one, the ex-
perimental testing under multiaxial stress state is difficult
to conduct requiring special instrumentation and appara-
tus. This has lead to a small amount of experimental data
to be available to develop and validate constitutive and
failure models. However, the increasing use of woven
fabric composites in structures subjected to complex
loadings has required engineers to enhance the modeling
and the predictive tools for a more reliable design. Com-
pounding the difficulties is the complexity of micro-
structures of the woven composites itself and the pres-
ence of various defects and interfaces within the material.
There are three types of interfaces in woven compos-
ites [1-4]: resin rich area to longitudinal fiber group,
resin rich area to transverse fiber group, and the interface
between longitudinal fiber group and transverse fiber
group. When loaded in the longitudinal direction, while
the second kind of interface has little effects on the direc-
tions of crack propagation, the other two kinds of inter-
faces tend to stop the development of cracks perpendicu-
lar to the direction of the load. Due to the strength and
stiffness of the longitudinal fiber group, cracks propa-
gating in the perpendicular direction stop at the longitu-
dinal fiber group. The resultant stress concentration
would then redirect cracks to the weak interface areas
around the longitudinal fiber group and initiate breaking
of interfaces between adjacent layers. After a number of
the weak interfaces are broken down and resultant sepa-
rate interface areas join together, delamination emerges.
Under these complex phenomena, several different dam-
age modes are present: micro-cracking, cracking, debond-
ing, delamination, and fiber fracture [1-6]. Many resear-
chers report that the fatigue process can be divided into
three stages [7,8]. In the first stage, the main damage
modes are matrix micro-cracking and cracking; the sec-
ond stage is controlled by a combination of matrix crack-
ing, interfacial cracking and delamination; while the fiber
failure dominates the last stage.
Different approaches have been taken to address the
presence of multitude of cracks as the main damage
mode in fatigue process of composite materials. Brout-
man and Sahu [9] studied the progressive failure of the
material by monitoring the crack density at the through
thickness. Owen [10,11] reported damage initiation at
fiber-matrix interface due to debonding while, Mandell et
al. [12,13] investigated fatigue damage propagation and
Copyright © 2012 SciRes. OJCM
Bounding Surface Approach to the Modeling of Anisotropic Fatigue Damage in Woven Fabric Composites
126
failure modes of woven glass composites. Smith and
Pasco [1,6] investigated the behavior of glass reinforced
composites under multiaxial state of stress in both mono-
tonic and fatigue loading environment.
It is generally an accepted notion that modeling every
crack or defect’s evolution and growth is a formidable
task, if not an impossible one. Therefore, many research-
ers have chosen to monitor changes in the material stiff-
ness [14,15] as an indirect but effective method to meas-
ure the internal changes and energy dissipation within the
material due to damage.
Following this approach, Yoshioka and Seferis [16]
presented a model to predict the fatigue process by ob-
serving modulus deterioration. Chou and Ko [17] pro-
posed a model through the prediction of elastic stiffness
based on lamination theory. Degrieck and Paepegem [18]
have summarized the major fatigue models and life time
prediction methodologies for reinforced polymer com-
posites under fatigue loading. Recently, Wen and Yaz-
dani [19] proposed a model to predict the fatigue process
through the change of the fourth-order material compli-
ance tensor based on a class of damage mechanics theo-
ries.
In this paper we propose a unified approach to the
modeling of woven composites under quasi-static and
fatigue loading utilizing the bounding surface approach.
In fact it will be shown that the Limit (Strength) Sur-
face “LS” is a special case when the fatigue cycle is set
to one. This method has an intuitive advantage in that
many in the mechanics community are familiar with the
non-linear modeling of materials (plasticity and/or dam-
age mechanics) and the extension to fatigue modeling
would be regarded as natural. At the same time as will be
shown many complex fatigue load paths can be modeled
and addressed conveniently within the frame work pro-
posed.
The concept of bounding surfaces can be explained as
presented below. Consider a material element shown in
Figure 1 where numbers “1” and “2” indicate orthogonal
loading directions. Let the biaxial strength envelop (i.e.,
the Limit Surface representation in 2-D) of the material
be represented by “LS” corresponding to the quasi-static
loadings of the material point (Figure 2). The “LS” sur-
face represents the limit (ultimate) strength of the mate-
rial under a variety of loading paths in non-fatigue envi-
ronment.
As understood in the fatigue loading, as the number of
loading cycles increases, the ultimate strength of the ma-
terial decreases due to the presence and activation of in-
herent and new flaws and damage in the material. In two
dimensional representation scheme as we have adopted
here, it is then plausible to consider that the Limit Sur-
face, “LS”, would collapse inward as represented by
1 1
2
2
Figure 1. Material element with loading directions 1 and 2.
LS
RS
FS
σ
LD
σ
1
σ
2
n=1
n2> n1
O
n=N
RS
n1>1
Figure 2. Schematic representation of boundary surfaces in
two-dimensions.
“RS” family of curves identified as Residual Strength
surfaces, utilizing the terminology used in fatigue litera-
ture. As the number of cycles increases the LS surface
collapses further in as shown for n2 > n1. At some point
the failure state is reached where material fails due to the
applied stress level at cycle “N”. In fatigue literature,
“N” is also referred to as life of the material. The task at
hand is to develop a realistic and reasonable limit surface
based on principles of mechanics, and to propose evolu-
tionary equation that would provide the position of in-
termediate residual strength surfaces loading to the fail-
ure surface, FS, when n = N.
The model presented in the following sections is re-
garded as an extension to the work and Wen and Yazdani
[19] where by utilizing a bounding surface theory and
damage mechanics formulation a unified approach is
presented for the fatigue modeling of woven fabric com-
posites. A new direction function is also introduced to
capture the strength anisotropy of the woven composite
materials.
2. Formulation
In this paper it is assumed that the fatigue loading is of
low frequency so that thermal effects could be ignored.
Copyright © 2012 SciRes. OJCM
Bounding Surface Approach to the Modeling of Anisotropic Fatigue Damage in Woven Fabric Composites 127
With the further assumption of small deformation, the
form of Gibbs Free Energy (GFE) is deduced from
[20,21] and shown as follows.

1
2
i
GA:: :C

i
ε
k
k
k
(1)
where C represents the compliance tensor, εi designates
the inelastic strain tensor, σ is the applied stress tensor,
Ai(k) is a scalar function, and k is the cumulative fatigue
damage parameter. The symbol “:” denotes the tensor
contraction operation. For small deformations as as-
sumed, one can decompose the current compliance tensor
into an initial undamaged component plus added flexibil-
ity caused by damage during fatigue loadings as [20-24]:
 
k
0c
CCC (2)
where, is the initial undamaged fourth-order com-
pliance tensor and denotes the added flexibility
tensor due to damage. Also, the changes in the fourth-
order compliance tensor and the inelastic strain tensor are
regarded as fluxes in the thermodynamic state sense and
are expressed below with respect to a set of response
tensors R and M as:
0
C

k
c
C
andk
ci
CRεM (3)
The response tensors determine the directions of the
fatigue damage and the inelastic deformation processes.
Following the standard thermodynamics arguments and
assuming that the unloading is an elastic process, the
onset of damage is determined by defining a potential
function that is derived by combining Equa-
tions (1)-(3) so that [20,21]
ψ,kσ
 
2
11
,,
22
kt
:: :RM
 
σσ 0
k
(4)
where t is interpreted as the damage function
given below as
,k
 
22
,2 ,
i
A
tk gk
k


(5)
for some scalar-valued function
2,
g
k
. We note that
as long the function “t” could be obtained experimentally,
the identification of the components shown on the right
hand side of the Equation (5) is not necessary.
To progress further, specific forms of the response
tensors R and M must be provided. Guided by the ex-
perimental data from literature [1], the following re-
sponse tensors are postulated for R and M:
-
:I
R


i
i
(6)
M
(7)
where the symbol “” signifies the tensor product op-
eration, I represents the fourth-order identity tensor, i
represents the second-order identity tensor, and α and β
are material parameters.
The response tensor R is composed of two parts as
follows.
:
I
R
(8)

II
RIii (9)
The first part, RI, indicates that damage occurs in the
loading directions. This is in concurrence with observed
experimental data [1]. However with RI alone, the limit
surface that is predicted by the model cannot match the
experimental data as shown in Figure 3. Also, with RI
alone any change in the Poisson’s ratio could not be pre-
dicted by the proposed theory. Thus, the second part, RII,
is included. With an experimentally determined value of
parameter α, the limit surface prediction is shown as the
solid curve in Figure 3. The role of RII is thus two fold.
One, the form enables the model to predict enhancement
in strength under proportional loading, and two enables
the model to address changes in the apparent poison’s
ratio.
The damage function, t
,k
, is further represented as
the product of two functions
L
and
qk such
that

,tkLqk

(10)
where
L
and
qk are interpreted as the strength
and the shape functions of the damage function, t, with a
condition that
qk
max 1
, that is the maximum value of
the function
qk is set to be one. Considering a class
of woven composites (0 - 90), we identify a strength ten-
sor, S, as,
12tt
FF
 
11 22
S
qq qq (11)
where 1t
F
and 2t
F
are scalar parameters, and 1 and
2 are Eigen vectors of fiber directions, respectively. It
will be shown below that
q
q
1t
F
and 2t
F
are related to the
material strengths 1t
f
and 2t
f
in direction “1” and “2”,
respectively. With these backgrounds in place, a particu-
lar form for the strength function

L
of Equation (10)
is proposed as
 
LTr
:
S
(12)
By substituting Equations (6), (7), (10), and (12) into
Equation (4), the damage function is re-written as
 

2
2
11
,12:
22
10
2
kT
qk
Tr

 






:S

r
(13)
Copyright © 2012 SciRes. OJCM
Bounding Surface Approach to the Modeling of Anisotropic Fatigue Damage in Woven Fabric Composites
128
Figure 3. Effect of the two parts of response tensor R. Ex-
perimental data are of the biaxial ultimate strengths of
specimen [1].
To obtain the forms of scalar parameters 1t
F
and 2t
F
,
two uniaxial loading paths in fiber direction “1” and “2”
at the limit state are considered, respectively. Since at the
limit state the function

1qk
, in direction “1” Equa-
tion (13) is simplified to be as
22
11
12
tt
Ff
 (14)
where 1t is the tensile strength in direction “1” . Simi-
larly, in direction “2”, designating 2t as the tensile
strength in direction “2”, Equation (13) is simplified to
be as:
f
f
22
22
12
tt
Ff
 (15)
It is observed that if 1t and 2t are the same, the
model will predict strength isotropy; while with 1t and
2t being unequal, the model will predict strength ani-
sotropy as one expects in most composites.
f f
f
f
An example is provided here to illustrate the capability
of the model to predict strength isotropy and anisotropy.
The predicted limit surfaces of two materials are shown
in Figure 4. The dashed curve represents a material with
strength anisotropic with strength 1 MPa in di-
rection “1” and 2 MPa in direction “2.” The
solid curve represent a material with a strength isotropy
with strength MPa in both directions.
80
t
f
50
t
f
12
80
tt
ff
3. Fatigue
As the number of loading cycles starts to increase, the
strength of the material is affected and reduced. The limit
surface representing the foci of all strength points associ-
ated with is therefore affected and should be
modeled to soften to failure surface. To achieve this, the
strength function
1n

L
is modified to predict lower
Figure 4. Schematic illustration of model predicted limit
surface for strength isotropic and anisotropic materials.
limit strength of the material with increasing number of
cycles. Therefore, a new strength function,
,Ln
is
proposed as
  
,LnFn
Tr
:S
(16)
where
F
n acts as a the softening function.
Incorporating the damage softening function back into
the general formulation yields
 


2
2
11
,12:
22
10
2()
kT
Fnqk
Tr

 




:S

r
(17)
To interpret the softening function

F
n we consider
a uniaxial fatigue loading path in the fiber direction “1”
with max 1q
as:


2
2
11
2
1
11
,12
22
10
2t
k
FF n
 
 


(18)
With the previously obtained result that
22
11
12
tt
Ff
, we obtains the expression for
F
n
as

1
1t
Fn
(19)
The relation (19) represents the ratio of the residual
strength over the ultimate quasi-static strength. This is
also referred to the classical S-N curve in fatigue litera-
ture terminologies. To determine a proper form for
Copyright © 2012 SciRes. OJCM
Bounding Surface Approach to the Modeling of Anisotropic Fatigue Damage in Woven Fabric Composites 129

F
n, we therefore refer to the experimental S-N curve
for uniaxial tension in the literature. The two most fun-
damental classical S-N curves are the power function and
logarithm function. By comparison with experimental
work [1], the power function is used as follows. Let

A
F
nn
(20)
where n is the number of cyclic loading, and A is a mate-
rial parameter.
For the experimental work [1] that is used here, the
model predictions are shown in Figures 5-7 for various
stress ratios.
To obtain the constant material parameter “A”, we
utilize Equations (14) and (20) to get

1
1
ln ln
t
A
n
f


 (21)
Finally, the rate of the damage parameter, k, must be
obtained and specified consistent with the constitutive
relations used and the strength degradation forms pro-
posed due to fatigue cycles. For the simple constitutive
relation of the form shown as

:Ck i

, the rate
of damage parameter, dkdn , for the uniaxial path can
be shown to be as


1
0
d1
d1
A
kAn
nE


(22)
where 0 is the initial Young’s modulus in the absence
of any damage.
E
4. Numerical Simulation
In this section, the predictions of the proposed model are
compared with the experimental data [1]. Smith & Pas-
coe [1] used a biaxial hydraulic servo-controlled rig de-
veloped at the Cambridge University Engineering De-
partment. Nine biaxial and three uniaxial stress states
were tested. All tests were load control. Fatigue test fre-
quencies were generally kept in the range 0.1 Hz - 0.6 Hz
to prevent excessive cyclic induced heating. The speci-
mens were cruciform for biaxial tests and parallel-sided
for uniaxial tests. All specimens were from one batch of
laminate which was laid up from reinforcement of glass
fiber woven roving (0 - 90) and isophthalic polyester
resin. Each laminate contains 13 laminas. Warp and weft
fibers of different lamina are aligned in the same direc-
tions, respectively.
Three material parameters, A, α, and β are used in the
model. To determine the parameters, the following tests
can be used. With one uniaxial fatigue test and knowing
the uniaxial strength of the material, the residual strength,
1
, and cyclic number, n, can be obtained. The constant A
can then be determined by Equation (21). The parameter β
is a kinematic parameter and is identified by measuring
Figure 5. Comparison between softening function and ex-
perimental data [1] with stress ratio 1:0.
Figure 6. Comparison between softening function and ex-
perimental data [1] with stress ratio 1:0.5.
Figure 7. Comparison between softening function and ex-
perimental data [1] with stress ratio 1:1.
Copyright © 2012 SciRes. OJCM
Bounding Surface Approach to the Modeling of Anisotropic Fatigue Damage in Woven Fabric Composites
130
the inelastic deformation after unloading. With one biax-
ial quasi-static test and parameter β, α can be determined
by Equation (13).
Figure 8 shows the prediction results of biaxial limit
surface and residual strength surface against the experi-
mental work [1], for the monotonic loading when 1n
and the fatigue loading when cycles. The theo-
retical results for predictions are good considering the
simplicity of the forms that were used. The following
material parameters were used: α = 0.46, β = 0.1, A =
–0.1.
105n
Figure 9 shows the comparison of the model predic-
tion of the increment of compliance with the experimen-
tal data [1]. The experimental data are of an equal biaxial
fatigue test. The values of parameters α, β, and A are
the same as those of Figure 8. Lastly, the predicted
stress-strain relations are shown on Figures 10-12 where
the strength and ductility reductions are demonstrated
due to effect of fatigue loading. Figure 10 shows the
predicted stress-strain relations of uniaxial monotonic
and fatigue loadings; Figure 11 shows those of mono-
tonic and fatigue loadings with stress ratio 1:0.5; Figure
12 shows those of monotonic and fatigue loadings with
stress ratio 1:1. The experimental data are from the work
[1].
5. Conclusion
An anisotropic damage model is established to predict
the fatigue behavior of woven composite materials under
low frequency fatigue loading for multi-axial stress states.
A class of damage mechanics is utilized recognizing that
cracking is the main type of irreversible process and
damage in the material that also dominates most of the
Figure 8. Comparison between experimental data [1] and
theory predictions of limit surface and residual strength
surface of 105 loading cycles.
Figure 9. Comparison of increment of compliance of equal
biaxial fatigue between experimental data [1] and model
prediction.
Figure 10. Predictions of the stress strain relationship of
uniaxial monotonic failure loading and uniaxial fatigue
loadings. The experimental data are from the work of
Smith & Pascoe [1].
Figure 11. Predictions of the stress strain relationship of
monotonic failure loading and fatigue loadings with stress
ratio 1:0.5. The experimental data are from the work of
Smith & Pascoe [1].
Copyright © 2012 SciRes. OJCM
Bounding Surface Approach to the Modeling of Anisotropic Fatigue Damage in Woven Fabric Composites 131
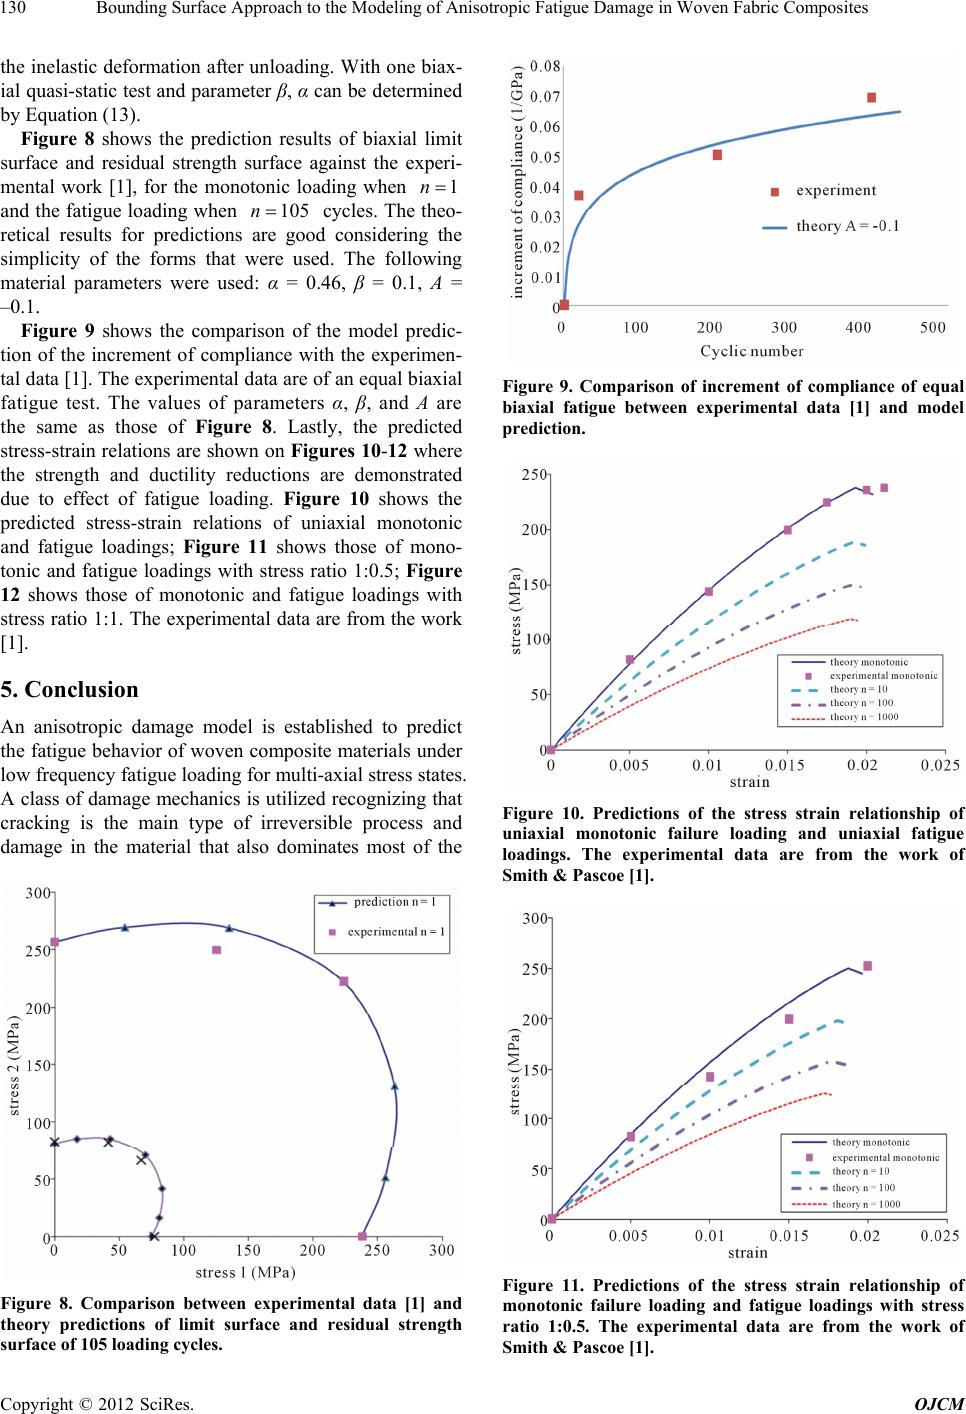
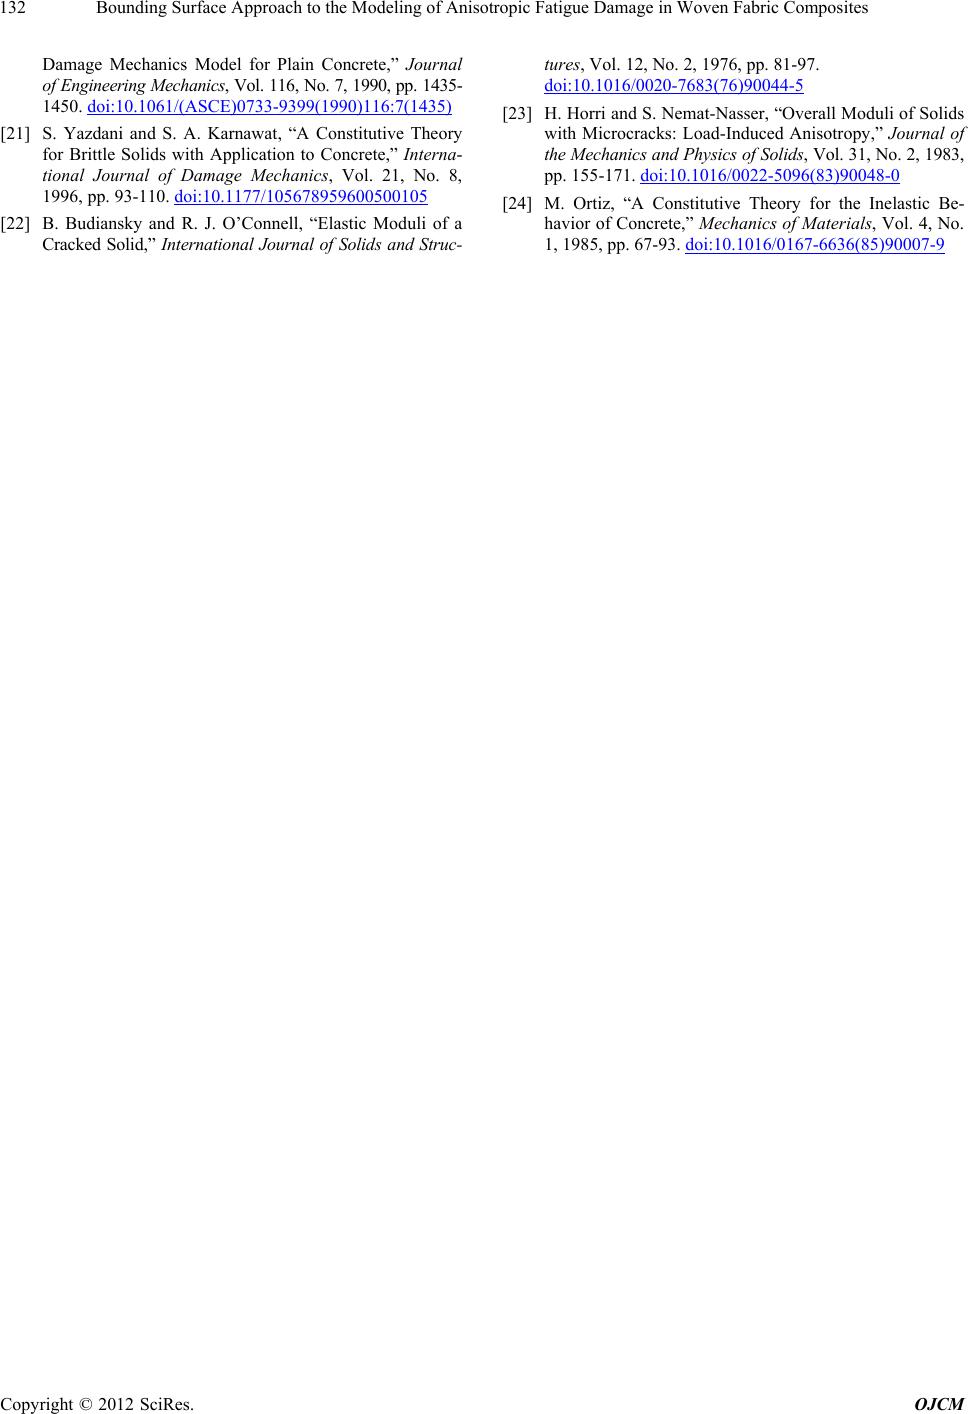
Figure 12. Predictions of the stress strain relationship of
monotonic failure loading and fatigue loadings with stress
ratio 1:1. The experimental data are from the work of
Smith & Pascoe [1].
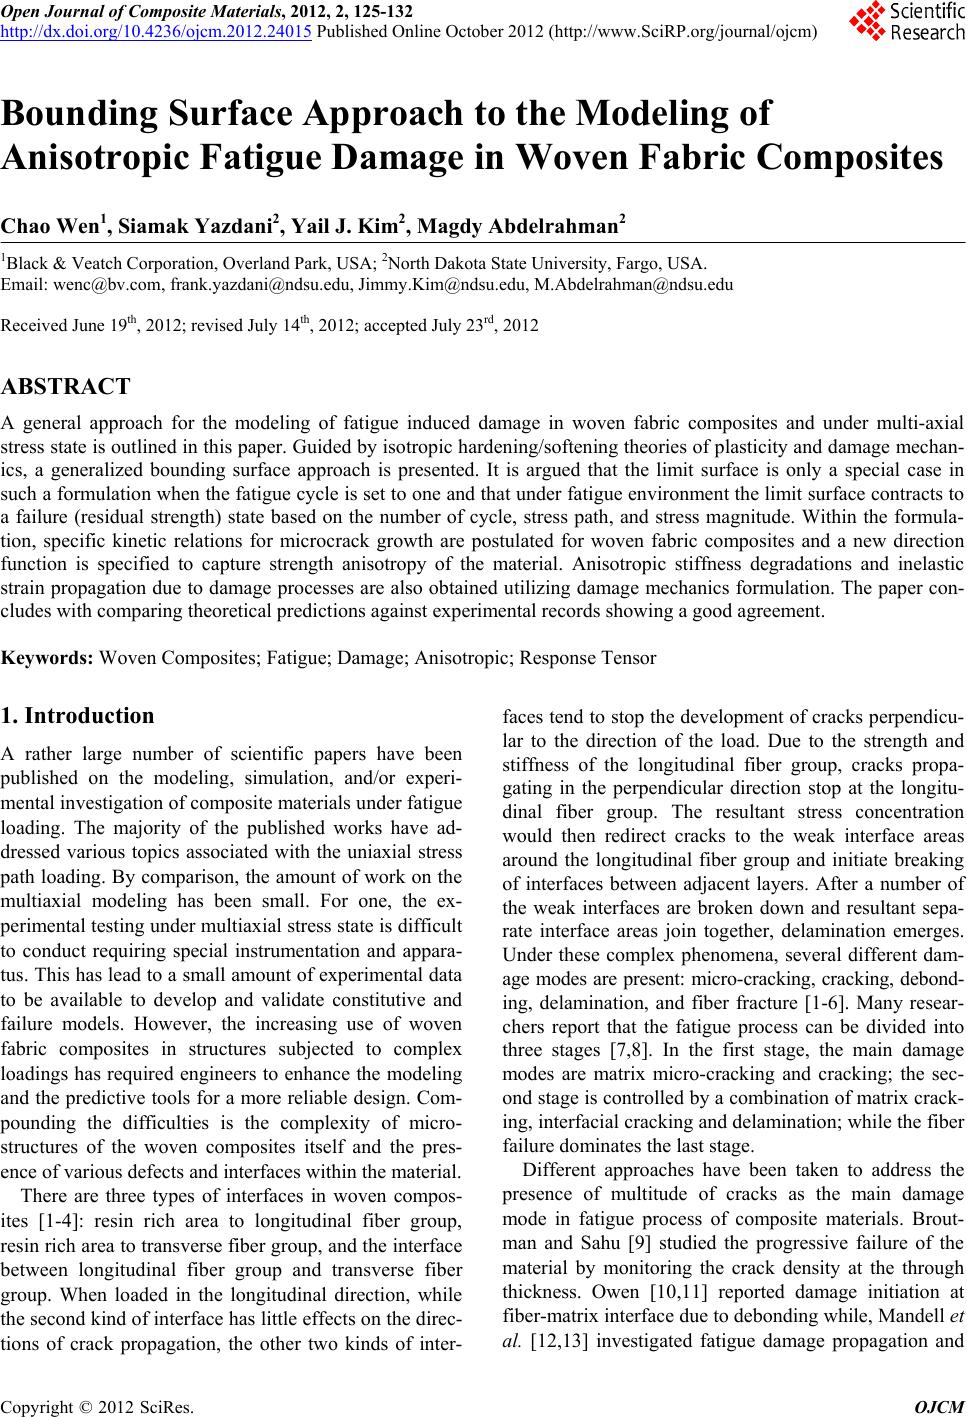
fatigue life. In this work a bounding surface theory is
presented to predict the fatigue behavior of the woven
material under biaxial loadings. The limit strength state
expressed as a potential damage function is let to soften
(shrink) based on an appropriate rate of a damage vari-
able. The changes of the material properties and the ine-
lastic deformation are also addressed by means of re-
sponse tensors. The forms of response tensors allow the
formulation to predict induced anisotropy due to cracking.
Strength anisotropy is also studied and addressed. By
comparison with experimental data, the model shows
good capability to describe the essential properties of
woven composite materials under biaxial fatigue loading.
REFERENCES
[1] E. W. Smith and K. J. Pascoe, “Biaxial Fatigue of a
Glass-Fiber Reinforced Composite. I. Fatigue and Frac-
ture Behavior,” Mechanical Engineering Publications,
Biaxial and Multiaxial Fatigue, 1989, pp. 367-396.
[2] A. J. Russell, “Assessing the Long Term Durability of
Glass Fibre Composites,” The 7th International Confer-
ence on Marine Application of Composite Materials,
1998, pp. R1-R13.
[3] Z. Khan, et al., “Fatigue Damage Characterization in
Plain Weave Carbon-Carbon Fabric Reinforced Plastic
Composites,” Journal of Reinforced Plastics and Com-
posite, Vol. 17, No. 15, 1998, pp. 1320-1337.
[4] W. W. Stinchcomb and K. L. Reifsnider, “Fatigue Dam-
age Mechanisms in Composite Materials: A Review,” Fa-
tigue Mechanisms, 1979, pp. 762-787.
[5] H. A. Whitworth, “A Stiffness Degradation Model for
Composite Laminates under Fatigue Loading,” Compos-
ite Structures, Vol. 40, No. 2, 1998, pp. 95-101.
doi:10.1016/S0263-8223(97)00142-6
[6] E. W. Smith and K. J. Pascoe, “Biaxial Fatigue of a Glass-
Fiber Reinforced Composite, II. Failure Criteria for Fa-
tigue and Fracture,” Mechanical Engineering Publications,
Biaxial and Multiaxial Fatigue, 1989, pp. 397-421.
[7] U. Hansen, “Damage Development in Woven Fabric
Composites during Tension-Tension Fatigue,” Journal of
Composite Materials, Vol. 33, No. 7, 1999, pp. 614-639.
doi:10.1177/002199839903300702
[8] V. Natarajan, H. V. S. Gangarao and V. Shekar, “Fatigue
Response of Fabric-Reinforced Polymeric Composites,”
Journal of Composite Materials, Vol. 39, No. 17, 2005,
pp. 1541-1559. doi:10.1177/0021998305051084
[9] L. J. Boutman and S. Sahu, “Mechanical Properties of
Particulate Composites,” Polymer Engineering and Sci-
ence, Vol. 12, 1972, pp. 91-100.
doi:10.1002/pen.760120204
[10] M. J. Owen, “Fatigue Processes in Fibre Reinforced Plas-
tics,” Philosophical Transactions, Series A, Vol. 294, No.
1411, 1980, pp. 535-543. doi:10.1098/rsta.1980.0062
[11] M. J. Owen, “Fatigue Testing of Fiber Reinforced Plas-
tics,” Composites, Vol. 1, No. 6, 1970, pp. 346-355.
doi:10.1016/0010-4361(70)90233-8
[12] J. Mandell, D. Cairns, D. Samborsky, R. Morehead and D.
Haugen, “Prediction of Delamination in Wind Turbine
Blade Structural Details,” The 41st AIAA Aerospace Sci-
ences Meeting and Exhibit, Reno, 2003, pp. 202-213.
[13] J. F. Mandell, D. H. Grande, T. H. Tsiang and F. J.
McGarry, “Modified Mirco-Debonding Test for Direct in
Situ Fiber/Matrix Bond Strength Determination in Fiber
Composites,” Composite Materials: Testing and Design,
the 7th Conference, Philadelphia, 2-4 April 1984, pp. 87-
108.
[14] A. L. Highsmith and K. L. Reifsnider, “Stiffness-Reduc-
tion Mechanisms in Composite Laminates,” Damage in
Composite Materials: Basic Mechanisms, Accumulation,
Tolerance, and Characterization, American Society for
Testing and Materials, Philadelphia, 1982, pp. 103-117.
[15] J. Degrieck and W. Van Paepegem, “Fatigue Damage
Modeling of Fiber-Reinforced Composite Materials: Re-
view,” Applied Mechanics Review (USA), Vol. 54, No. 4,
2001, pp. 279-300. doi:10.1115/1.1381395
[16] K. Yoshioka and J. C. Seferis, “Modeling of Tensile Fa-
tigue Damage in Resin Transfer Molded Woven Carbon
Fabric Composites,” Composites: Part A, Vol. 33, No. 11,
2002, pp. 1593-1601.
[17] T. W. Chou and F. K. Ko, “Textile Structural Composites,”
Elsevier Science Publishers, Amsterdam, 1989.
[18] J. Degrieck and W. V. Paepegem, “Coupled Residual Stiff-
ness and Strength Model for Fatigue of Fiber-Reinforced
Composite Materials,” Composite Science and Technology,
Vol. 62, No. 5, 2002, pp. 687-696.
doi:10.1016/S0266-3538(01)00226-3
[19] C. Wen and S. Yazdani, “Anisotropic Damage Model for
Woven Fabric Composites during Tension-Tension Fa-
tigue,” Composite Structures, Vol. 82, No. 1, 2008, pp. 127-
131. doi:10.1016/j.compstruct.2007.01.003
[20] S. Yazdani and H. L. Schreyer, “Combined Plasticity and
Copyright © 2012 SciRes. OJCM
Bounding Surface Approach to the Modeling of Anisotropic Fatigue Damage in Woven Fabric Composites
Copyright © 2012 SciRes. OJCM
132
Damage Mechanics Model for Plain Concrete,” Journal
of Engineering Mechanics, Vol. 116, No. 7, 1990, pp. 1435-
1450. doi:10.1061/(ASCE)0733-9399(1990)116:7(1435)
[21] S. Yazdani and S. A. Karnawat, “A Constitutive Theory
for Brittle Solids with Application to Concrete,” Interna-
tional Journal of Damage Mechanics, Vol. 21, No. 8,
1996, pp. 93-110. doi:10.1177/105678959600500105
[22] B. Budiansky and R. J. O’Connell, “Elastic Moduli of a
Cracked Solid,” International Journal of Solids and Struc-
tures, Vol. 12, No. 2, 1976, pp. 81-97.
doi:10.1016/0020-7683(76)90044-5
[23] H. Horri and S. Nemat-Nasser, “Overall Moduli of Solids
with Microcracks: Load-Induced Anisotropy,” Journal of
the Mechanics and Physics of Solids, Vol. 31, No. 2, 1983,
pp. 155-171. doi:10.1016/0022-5096(83)90048-0
[24] M. Ortiz, “A Constitutive Theory for the Inelastic Be-
havior of Concrete,” Mechanics of Materials, Vol. 4, No.
1, 1985, pp. 67-93. doi:10.1016/0167-6636(85)90007-9