 Journal of Modern Physics, 2012, 3, 1572-1585 http://dx.doi.org/10.4236/jmp.2012.310194 Published Online October 2012 (http://www.SciRP.org/journal/jmp) Radiological Concentration Distribution of 131I, 132I, 133I, 134I, and 135I Due to a Hypothetical Accident of TRIGA Mark-II Research Reactor M. A. Malek1, K. J. A. Chisty2, M. M. Rahman3 1Department of Electrical and Electronic Engineering, Green University of Bangladesh, Dhaka, Bangladesh 2Department of Electrical and Electronic Engineering, European University of Bangladesh, Dhaka, Bangladesh 3Energy Institute, Atomic Energy Research Establishment, Dhaka, Bangladesh Email: malekphy@gmail.com, kja_chisty@yahoo.com, mizanrbd@gmail.com Received August 12, 2012; revised September 12, 2012; accepted September 20, 2012 ABSTRACT The present work gives a methodology for assessing radiological concentration of 131I, 132I, 133I, 134I, and 135I due to a hypothetical accident of TRIGA Mark-II research Reactor at AERE, Savar, Bangladesh. The concentrations were esti- mated through different pathways like ingestion of vegetation, milk, and meat from air and ground deposition. The maximum air concentrations for all 16 directions were found at 110 m distance from the core of the reactor and it was found to be highest in the southern (S) direction. The maximum ground concentration occurred immediately just after the accident in different directions. In all pathways, the most concentration was found to be in S-direction. The concen- trations in vegetation of 131I, 133I, 135I were significant, while no concentrations of 132I and 134I were observed. The con- centration in vegetation for 131I was found to be highest than all other isotopes of iodine. The concentrations of 133I were found to be higher and concentrations of 134I were observed to be lower in both milk and meat compared to other radio isotopes of iodine. In the case of a radiological accident, the results of the present study will be a valuable guide for adopting radiological safety measures for radiation protection against the ingestion of vegetables, milk and meat from around the research reactor at AERE, Savar, Bangladesh. Keywords: Concentration; Effective Stack Height; Pathway; S-Direction; TRIGA Mark-II 1. Introduction Atmospheric diffusion and radiation concentration cal- culations for accidental releases of radioactive gases and volatiles are an important contribution to licensing re- quirements for the selection of site for a nuclear reactor. The reactor-operating license is obtained from local regu- latory authorities in accordance with internationally adopted criteria [1]. Nuclear reactors, specially research reactors, do not release any significant quantity of radioactive material to the atmosphere under normal operating conditions. How- ever, a significant fraction of the radionuclide inventory in the core may be released to the atmosphere under ac- cident conditions with severe core damage. In the case of a hypothetical accident of research reactor, radionuclides that are predictable to be released through the stack, can cause direct radiation exposure of the public in the downwind direction and can also be deposited on the ground and vegetation resulting in exposure through dif- ferent pathways such as external irradiation, inhalation, ingestion etc. [2,3], when cows eat vegetation, milk and meat become contaminated. Immediately after an acci- dent, isotopes of iodine such as 131I, 132I, 133I, 134I, and 135I presents the most serious radiological hazards [4]. The main doses concerns are those to thyroid due to external irradiation, inhalation and ingestion of radioiodines. To evaluate doses, measurement of activity concentra- tion of radionuclides in different pathways is necessary. An attempt has therefore been made in this work to find out the concentration in vegetation, milk and meat due to deposition of 131I, 132I, 133I, 134I, and 135I considering hy- pothetical accident of TRIGA MARK-II research reactor at AERE, Savar. Radionuclides can be deposited on soil either by direct deposition from the atmosphere or from the use of surface water for irrigation. When there is a canopy of vegetation, radionuclides can reach the soil through leaf fall, leaching, wash-off, herbivore excretion and trampling [5]. Different assumptions and methodologies have been taken into account for assessing concentration suggesting the necessity of site-specific data. Recently IAEA pub- lished generic methodologies for use in assessing the ra- diological consequence due to the releases of radioactive C opyright © 2012 SciRes. JMP  M. A. MALEK ET AL. 1573 materials in the environment, [5,6]. A computational code has been developed based on these methodologies and a hypothetical accident scenario to predict the con- centration of 13 1 I, 132I, 133I, 13 4 I, and 135I in vegetation, milk and meat. An IAEA document on research reactors used 100%, 40% and 1% release fractions for noble gas- es, halogens and particulates, respectively [6]. In this work, we have calculated only the release of radioactive iodine which is volatile, and 40% release fraction was considered. The input parameters like wind speed and frequency at different direction, average temperature needed in the calculation have been collected from Bang- ladesh Meteorological Department for the AERE site. Other essential parameters needed in the calculation have been taken from elsewhere [5]. 2. Source Term and Accident Scenario 2.1. Source Term Calculation The radiological source term describes the amount of the nuclides which are released to the containment. A num- ber of mathematical expressions can be applied to calcu- late the amount of fission products in the research reactor core as a function of irradiation time. An approximate formula giving activity i t of an isotope i at time t after the start of irradiation (t = 0) whose fission yield is γ and its decay constant is λi irradiated for a time period T in P (megawatts of thermal power) can be written [6] as: ei itT T (1) 0.821 e i At P Radiological doses outside the reactor facility can be caused only by radionuclides with a high degree of mo- bility. The isotopic data considered here is limited due to volatile group which is likely to be released in significant quantities in the event of fuel melting with halogens, volatiles (e.g. iodine); the most important contributors. A considerable amount of radionuclides can be released from the stack of the reactor building. 2.2. Release Rate Calculation Source analysis addresses the problem of deriving the source terms that determine the rate at which residual radioactivity is released into the environment. This is termed as release rate. The release rate of the radionu- clides from stack is determined by the concentrations of the radionuclides present, the ingrowth and decay rates of the radionuclides, fraction released from fuel to building, the geometry of the containment, the leak rate parameter and overall the source term. The total activity of isotope i released over time τ, Q (τ), is obtained from the following Equation [6] as: where FP is the fraction released from fuel to building, FB is the fraction remaining airborne and available to be released from the building to the atmosphere, λi is the source term, λl is the leak rate parameter, sec−1, and λr is the radioactive decay constant, sec−1. 2.3. Assumptions Made in the Calculation In case of radiological assessment, source term is a very vital parameter. The radiation received by the population around the TRIGA reactor facility is directly dependent on this parameter. Some realistic assumptions have been made for doing the calculation of the present work. These are given below: The reactor was operated at full power, i.e. 3 MW (t); Time after the start of irradiation: 10 days; Continuous operation at full power: 10 days; Radionuclide release time into the atmosphere from stack: 2 hours after the accident; Radionuclides considered for radiological concentra- tion assessment into the environment around the re- actor building: 131I (T1/2 = 8.04 days), 132I (T1/2 = 2.30 hrs), 133I (T1/2 = 20.8 hrs), 134I (T1/2 = 0.876 hrs) and 135I (T1/2 = 6.61 hrs); Fraction release [7]: Iodine: 40% of the equilibrium radioactive iodine (131I, 132I, 133I, 134I, 135I) inventory developed from maximum fuel power operation of the core are immediately available for leakage to the reactor building in the direct proportion to percent of fuel failure [7]; Leak rate parameter, 1 = 1.157 10−7 sec−1. i.e., 1%/ day [5]. Considering the above assumptions, the activity of io- dine (131I, 132I, 133I, 134I and 135I) was calculated consider- ing the above assumptions and using Equation (1). The fission yields of the corresponding radionuclides were obtained as the fission fragment of the total product by neglecting the filter and shielding efficiency. A constant reactor power of 3 MW(t) is an acceptable approximation for the irradiation. The fission product inventory would be maximum corresponding to the infinite irradiation time. The calculated activity released rate of 131I, 132I, 133I, 134I and 135I for 10 days operation at 3 MW(t) power level are given in Table 1. The Table illustrates that the total activity in the reactor core and released rate from con- tainment to environment through the stack for 131I, 132I, 133I, 134I, and 135I are comparable with one another. This is due to the similarity of fission yields and fraction of release for these radionuclides. 3. Atmospheric Dispersion and Radiological Concentration Calculation Models 3.1. The Gaussian Plume Model (GPM) 1e lr l ipbi lr QFFAt (2) In the case of an accident, the escaped fission products Copyright © 2012 SciRes. JMP  M. A. MALEK ET AL. 1574 Table 1. Calculated fission product inventory for 10 days operation at 3 MW(t) power level. Radionuclides Fission yield Total activity in core (Ci) Released rate (Bq/sec) 131I 0.0289 4.074 × 10⁴ 6.965 × 10⁷ 132I 0.054 6.06 × 10⁴ 8.960 × 10⁷ 133I 0.026 5.982 × 10⁴ 1.008 × 10⁸ 134I 0.047 2.376 × 10⁴ 2.812 × 10⁷ 135I 0.050 9.973 × 10⁴ 1.622 × 10⁸ from reactor hall generally disperse in the surrounding atmospheric environment through a stack of the reactor as a radioactive smoke plume. The dispersion of radioac- tive plume to the atmosphere depends strongly on the atmospheric conditions such as temperature, wind fre- quency, direction, speed and humidity of the atmosphere. Gaussian plume model is widely applied to calculate atmospheric dispersion in the atmospheric environment. This model assuming that a Gaussian distribution in both lateral and vertical directions can be described as [6] 22 22 22 e zz HZ 2 2 2 ,,e e 2π y HZ y i yza Q xyz u ,, (3) where yz ,, is the radionuclide concentrations at point yz (Bq/m3); Qi is source strength or release rate (Bq/s), ua is the wind speed at the height of the stack (m/s), H is the stack height (m), σy and σz are the lateral and vertical dispersion parameters (m), depending on stability class. For radiological concentration assessment ground level concentration is required and therefore, z can be assumed to be zero and Equation (3) can be writ- ten as 2 eff 22 exp 22 yz QH 2 ,, exp π i yza y xyzu (4) where eff is the stack height (m). The average con- centration for release that occurs over a period of time can be calculated by applying the above equation. 3.2. Effective Stack Height (ESH) If the effluent has a significant exit velocity (or if it is at a high temperature), it will rise to a level higher than the actual stack height. The effective stack height, therefore, is the sum of the actual stack height (H) plus a factor that accounts for the exit velocity and/or the temperature of the effluent gas as [8] 14 Δ 1 vT uT eff a HH D (5) where D is the outlet stack diameter (m), v is the exit effluent velocity (m/s), T is the difference between am- bient and effluent gas temperatures, T is the absolute temperature of the effluent. For a research reactor like a TRIGA Mark-II at AERE, Savar, the temperature difference, T can be considered to zero because of active operation of the ventilation system. 3.3. Average Wind Speed at ESH Usually, meteorological data for wind speed and direc- tion are measured at a 10 m height. This speed needs to be converted into an effective stack height applying the following relationship [3,9] as eff m z H uu z (6) where uz is the speed at ground level at a height z = 10 m and m is the wind coefficient depending on underlying surface and diffusion category. 3.4. Air Concentration of Radionuclides and Gaussian Diffusion Factor In this case the sector averaged form of the GPM may be used with the following simplifying assumptions: 1) A single wind direction and frequency for each air concentration calculation; 2) A single long term average wind speed for each di- rection; 3) A neutral atmospheric stability class (Pasquill-Gif- ford stability class B) [5]. Air concentration of a radionuclide can be calculated based on the above mentioned assumptions by using the Equation [5] exp pi Ai aa PFQ Cuu (7) where CA is the ground level air concentration at down- wind distance x in sector p (Bq/m3); Pp is the fraction of the time that the wind blows towards the receptor of in- terest in sector p; ua is the geometric mean of the wind speed at the height of release (m/s); F is the Gaussian diffusion factor, appropriate for the height of release Heff and the downwind distance x being considered (m−2); Qi is the average annual discharge rate for radionuclide i (Bq/s); i is the rate constant for radioactive decay of radionuclide i. The Gaussian diffusion factor F as a function of downwind distance x for a fixed value of eff can be estimated using the 22.5˚ sector averaged form of the Gaussian plume model is given by [6] Copyright © 2012 SciRes. JMP  M. A. MALEK ET AL. 1575 2 eff 2 p2z z H x 3 ex 16 2π F (8) where is the vertical diffusion parameter (m). These expressions are appropriate for dispersion over comparatively flat territory without pronounced dills or valleys which is practically appropriate for our research rector site. The territory is assumed to be covered with pastures, forests and small villages. The value of can be calculated on the basis of the following relation- ship [5] G zEx (9) where E and G are the two parameters depending on the stability class and on the effective stack height, and x is the downwind distance. Here for stability class “B” E = 0.127 and G = 1.108 for release height of 32.36 m at various downwind dis- tance x m [10-12] was considered. 3.5. Group Deposition The radioactive material may be removed from the plume by the action of rain or snow interacting with it. In general, the process can be assumed to remove radionu- clides uniformly through the entire vertical extent of the plume. The removal rate at any distance from the source corresponds to the total amount of radio nuclides reach- ing that distance. It can also be removed from the plume by dry deposi- tion. The rate at which material is deposited from the plume will depend on the nature of the airborne material and the underlying surface and can be estimated using the concept of a deposition velocity or specifically, depo- sition coefficient. The deposition coefficient is defined as the ratio of the amount of activity deposited on the ground per unit time and the ground level air concentra- tion. For simplified assessment purposes, the following relationship is used as idwA dVVC (10) where di is the total daily average deposition rate on the ground of a given radionuclide i from both dry and wet processes, including deposition either on to impervious surfaces or on to both vegetation and soil (Bq·m−2·d−1); Vd is the dry deposition coefficient for a given radionu- clide (m/d); Vw is the wet deposition coefficient for a given radionuclide (m/d). The values of Vd and Vw for radionuclides are quite va- riable. They depend on such factors as the physical and chemical form of the radionuclide, the nature of the de- position surface, meteorological conditions and, in the case of Vw, the precipitation rate [13]. It has been rec- ommended that a total deposition coefficient, VT (=Vd + Vw). For deposition of aerosols and radioactive gasses and radioactive gasses, VT = 1000 m/d may be used for screening purposes [14]. This value of VT was found to be consistent with values for radioiodine and radiocesium from the accident at the Chernobyl nuclear power station in 1986. Deposition rate can be used to calculate the ra- dionuclide concentration on vegetation due to direct con- tamination and the concentration of radionuclide in dry soil. 3.6. Ground Concentration The ground concentration mainly depends on the ground deposition in the earlier section. It also depends on effec- tive rate constant and duration of the discharge of the radioactive material. The ground concentration can be calculated by using the equation [5], 1exp s i s i ib E gr E dt C (11) where di is the total ground deposition rate (Bq·m−2·d−1); i is the effective rate constant for reduction of the activity in top 10 to 20 cm of soil (d−1); there i = is , is the rate constant for reduction of soil ac- tivity owing to processes other than radioactive decay; and b is the duration of the discharger of radioactive material (d). t 3.7. Concentrations in Vegetation Radionuclides intercepted by and retained on vegetation may result from fallout, washout, and irrigation with con- taminated water or deposition of resuspended matter. External deposits can be taken up by foliar absorption into plants. Radionuclides may also be incorporated by uptake from the soil through roots, followed by internal redistribution of radionuclides within the plant. Processes that may lead to the reduction of radionuclide concentra- tions in vegetation include radioactive decay, growth di- lution, wash-off of externally deposited radionuclides, leaching and soil fixation. Further removal of radioactive material from vegetation may occur due to grazing, har- vesting, etc. For conditions of prolonged deposition, such as from discharges, the following equation may be used to esti- mate the concentration Cv,i,l due to direct contamination of nuclide I in and on vegetation, ,,1 1exp v i v i ie E vi E dt C ,,1vi C (12) where is measured in Bq/kg dry matter for vegeta- Copyright © 2012 SciRes. JMP  M. A. MALEK ET AL. 1576 tion consumed by grazing animals and in Bq/kg fresh matter for vegetation consumed by humans; i is the deposition rate (from wet and dry processes ) of radionu- clide i on to the ground (Bq·m−2·d−1); d is the fraction of deposited activity intercepted by the edible portion of vegetation per unit mass (or mass interception factor, m2/kg) as the results of both wet and dry deposition processes; for pasture forage the unit of mass is conven- tionally given in terms of dry weight, and for fresh vege- tables the unit is in wet weight; v i is the effective rate constant for reduction of the activity concentration of radionuclide i from crops (d−1); where v i Eiw e t ; is the time period during which the crops are exposed to contamination during the growing season (d) (assumed to be 1 day); w is the rate constant for reduction of the concentration of material deposited on the plant surfaces owing to processes other than radioactive decay (d−1); and i is the rate constant for radioactive decay of ra- dionuclide i (d−1). 3.8. Concentration for Uptake from Soil and Soil Adhering The radionuclide concentration in vegetable arising from indirect processes i.e. uptake from the soil and from soil adhering to the vegetation is given by following equation as, ,,2vi C ,si C v CF (13) where ,,2vi is measured in Bq/kg dry matter for vege- tation consumed by grazing animals and in q/kg fresh matter for vegetation consumed by humans; v is the concentration factor for uptake if the radionuclide from soil by edible parts of crops (Bq/kg plant tissue per Bq/ kg dry soil), it is conservatively assumed that all activity removed from the atmosphere becomes available for up- take from the soil; in addition, the selected values also implicitly take account of the adhesion of soil to the ve- getation; and ,is is the concentration of radionuclide i in dry soil (Bq/kg.), which can be defined as , C , 1exp s i ib si E C s i E dt (14) where i is the effective rate constant for reduction of the activity concentration in the root zone of soil (d−1), where s i Eis ; is the rate constant for reduc- tion of the concentration of material deposited in the root zone of soil owing to processes other than radioactive decay (d−1); b is the duration of the discharge of ra- dioactive material (d) (assumed to be 1 day); and t is a standardized surface density for the effective root zone in soil (kg/m2, dry soil) which is 260 [3]. The above equation refers to the total deposition and neglects the amount, which is adsorbed to the vegetation. 3.9. Total Concentration in Vegetation The total concentration of the radionuclide on the vegeta- tion at the time of consumption is ,,,1,,2 exp vivivii h CCC t C (15) where ,vi is measured in Bq/kg dry matter for vegeta- tion consumed by grazing animals and in Bq/kg fresh matter for vegetation consumed by human; i is the rate constant for radioactive decay of radionuclide I (d−1); and h is a decay (hold-up) time that represents the time interval between harvest and consumption of the food (d) which is equal to 14 d. t 3.10. Concentrations in Animal Feed The transfer of radionuclide to animals will depend on the intake of the animal and the metabolism of the vari- ous radionuclides by the animal. The intake of radionu- clides by animals depends on animal species, mass, age and growth rate of the animal, the digestibility of feed and, in the case of lactating animals, the milk is consid- ered. For generic calculations, grazing animals’ are as- sumed to be cattle, which during the grazing season, are on a diet of fresh pasture only. The grazing season de- pends on latitude and ranges from a few months to the whole year. The concentration of radionuclide i in animal feed is calculated by [5], ,, ,aip vip CfClfC C C 0t i (16) where ,ai is the concentration of radionuclide i in the animal feed (Bq/kg dry matter); ,vi is the concentra- tion of radionuclide i for pasture, calculated using Equa- tion (15) with h (Bq/kg, dry matter); , i C is the concentration of radionuclide in stored feeds (Bq/kg, dry weight), calculated using Equations (11)-(14) and sub- stituting , i for ,vi with h days; and C C90t is the fraction of the year that animals consume fresh pas- ture vegetation (dimensionless) which is 0.7 [3]. 3.11. Concentration in Milk The concentration of a radionuclide in milk is assumed to depend directly upon the amount and concentration level in the feed consumed by the lactating animal. The con- centration of radionuclide i in milk can be estimated by using the equation [5], ,, exp mimaimwwi m CFCQCQt ,mi C m (17) where is the concentration in milk of radionuclide i (Bq/L); is the fraction of the animal’s daily intake Copyright © 2012 SciRes. JMP  M. A. MALEK ET AL. 1577 of the radionuclide that each liter of milk at equilibrium which is 0.01 d/L for I [5]; ,ai is the concentration of radionuclide i in the animal feel (Bq/kg, dry matter); ,wi is the concentration of radionuclide i in water (Bq/kg); m is the amount of feed (in dry matter) con- sumed by the animal per day which is 16 kg, (dry weight) [3]; wis the amount of water consumed by the animal per day, which is 0.06 (m3/d) [5]; i C C Q Q is the rate constant for radioactive decay of radionuclide i (d−1), and m is the average time between collection and human con- sumption (assumed to be one day for fresh milk). t , ex 3.12. Concentration in Meat The radionuclide concentration in meat also depends directly on the amount and contamination level of the feed consumed by the animal. The radionuclide concen- tration in meat is calculated in the same way concentra- tion in milk. The same constraints exist except the de- fault values. It can be calculated by using the following equation [5], ,, p if CF a C ifwi QC w if Q t (18) where , i is the concentration of radionuclide i in an- imal flesh (Bq/kg); C is the fraction of the animal’s daily intake of a radionuclide that appears in each kg of at equilibrium or at the time of slaughter i.e . for I it is 0.05 d/kg which have been taken from elsewhere [5]; ,ai is the concentration of radionuclide i in the ani- mal’s feed (Bq/kg, dry matter); ,wi C is the concentra- tion of radionuclide i in water (Bq/m3); Qf is the amount of water consumed by the animal per day, which is 0.04 m3/d [5], and tf is the average time between slaughter and human consumption of meat which is 20 days [5]. C 4. Results and Discussion A computational code has been developed, using Math- CAD Professional Software to solve the mathematical expressions in order to calculate the concentration of each radionuclide of iodine. Source-term can be calcu- lated using the first part and concentration in different environmental media can be calculated using the second part of the code. The input parameters were measured for the TRIGA Mark-II reactor site, at AERE, Savar, Dhaka. The radiological concentration was estimated in different foodstuff (vegetation, milk, and meat) due to accidental release of radioiodine (131I, 132I, 133I, 134I, and 135I) through the stack of the 3 MW TRIGA Mark-II research reactor. The results of the measurements are given in the following segments. 4.1. Maximum Air Concentration for Various Directions Air concentrations were calculated with respect to the distance in 16 cardinal directions using the release rate mentioned above and with the help of Equation (7). Fig- ures 1-5 show calculated air concentration as function of distance for 131I, 132I, 133I, 134I, and 135I respectively. The maximum air concentrations for all directions were found at 110 m distance from the core of the reactor and it was found to be highest in the southern (S) direction. The values of the concentration along N, NE, E, SE, SW, W and NW directions are closer to that of S-direc- tion. In radiation protection point of view, radiological doses were assessed in different environmental pathways such as ground deposition, immersion, inhalation and ingestion of vegetable, milk and meat considering the maximum concentration for all the directions. 4.2. Ground Concentration Through dry and wet deposition, air borne particulates normally deposit on the ground surface which are the key factors for the increase of radionuclide in ground. Activ- ity concentrations of radioiodine in ground were calculated using Equation (11), measured ground concentration of Figure 1. Air concentration as a function of downwind dis- tance for 131I. Figure 2. Air concentration as a function of downwind dis- tance for 132I. Copyright © 2012 SciRes. JMP  M. A. MALEK ET AL. 1578 Figure 3. Air concentration as a function of downwind dis- tance for 133I. Figure 4. Air concentration as a function of downwind dis- tance for 134I. Figure 5. Air concentration as a function of downwind dis- tance for 135I. 131I, 132I, 133I, 134I and 135I and total concentration (131I + 132I + 133I + 134I + 135I) are graphically illustrated in Fig- ure 6 for eight (8) cardinal directions. The maximum ground concentration occurred immediately just after the accident in different directions which has been shown in Table 2. Maximum ground concentration was found in S-direction. With increasing time, the concentrations are found to decrease exponentially after the accident due to radioactive decay. This radionuclide is transferred to plants and then to meat and milk via ingestion and will be exposed to human directly and indirectly. 5. Concentration in Different Pathways 5.1. Ground Concentration The activity concentration in vegetation occurs due to direct deposition of air borne radionuclides on the edible portion of the vegetables and uptake from soil. The con- centration in vegetation for 131I, 132I, 133I, 134I, 135I and total are shown in Table 3 and plotted as a function of time for 8 directions, shown in Figure 7. This Table pre- dicts that the concentration of vegetation due to 132I, and 134I is found to be zero which is due to very short half-life and 131I is the dominant contributor of concentration in vegetation for long half life. Figure 7 predicts that the concentration in vegetation decreased exponentially with time after the accident and within 60 days most of the activity disappeared and the Sequence of concentration of iodine is Cveg 131I > Cveg 133I > Cveg 135I. 5.2. Concentration in Milk The radionuclide in milk arises due to consumption of contaminated feed by the lactating animal and its con- centration in milk depends directly on radioactivity con- centration of the feed consumed by the lactating animal. Concentrations of 131I, 132I, 133I, 134I, 135I and total (131I + 132I + 133I + 134I + 135I) in milk as a function of time for different directions are shown in Figure 8 and the con- centration in milk at time t = 0 is given in Table 4. From the graph it is clear that the maximum concen- tration occurs at time t = 0 for each direction and is de- creasing exponentially with time and become nearly to zero within 100 days. The Table 4 shows that the maxi- mum concentration was found in S-direction among all other directions. It was found the sequence of concentra- tion as Cmilk 133I > Cmilk 131I > Cmilk 132I > Cmilk 135I > Cmilk 134I, where “CmilkI” refers to the concentration of different isotopes of iodine in milk. The concentration of 133I in milk is higher than all other isotopes of iodine because of its higher concentration in animal’s feed. 5.3. Concentration in Meat The radionuclide concentration in meat occurs via con- sumption of contaminated food—in the same way as con- centration in milk. Table 5 shows the concentration in meat immediately just after the accident for eight domi- nant directions. Maximum concentration was found again in S-direction and the sequence of the concentration of Copyright © 2012 SciRes. JMP  M. A. MALEK ET AL. Copyright © 2012 SciRes. JMP 1579 Table 2. Maximum ground concentr ation for differe nt dire c t ions at time t = 0 (i.e. just after the accident). Ground concentration (Bq/m2) Direction 131I 132I 133I 134I 135I Total N 4.301×E+5 8.284E+4 4.652E+5 9.856E+3 6.831E+4 1.056E+6 NE 2.919E+5 5.622E+4 3.157E+5 6.69E+3 4.637E+4 7.168E+5 E 3.106E+5 5.986E+4 3.359E+5 7.129E+3 4.941E+4 7.629E+5 SE 5.493E+5 1.059E+5 5.942E+5 1.262E+4 8.745E+4 1.349E+6 S 1.251E+6 2.411E+5 1.353E+6 2.872E+4 1.99E+5 3.072E+6 SW 3.285E+5 6.331E+4 3.553E+5 7.539E+3 5.226E+4 8.07E+5 W 4.359E+5 8.398E+4 4.715E+5 9.995E+3 6.928E+4 1.071E+6 NW 6.013E+5 1.158E+5 6.503E+5 1.379E+4 9.555E+4 1.477E+6 Table 3. Maximum concentration in vegetation for different directions at time t = 0 (i.e. just after the accident). Concentration in vegetation (Bq/kg) Direction 131I 132I 133I 134I 135I Total N 3.764E+4 0 1.869 0 9.622E−12 3.764E+4 NE 2.554E+4 0 1.268 0 6.531E−12 2.554E+4 E 2.718E+4 0 1.35 0 6.96E−12 2.718E+4 SE 4.807E+4 0 2.387 0 1.232E−11 4.807E+4 S 1.094E+5 0 5.435 0 2.804E−11 1.095E+5 SW 2.875E+4 0 1.428 0 7.361E−12 2.875E+4 W 3.815E+4 0 1.894 0 9.758E−12 3.815E+4 NW 5.262E+4 0 2.612 0 1.346E−11 5.262E+4 Table 4. Concentration in milk for different directions at time t = 0 (i.e. just after the accident). Concentration in milk (Bq/L) Direction 131I 132I 133I 134I 135I Total N 2.814E+4 5.511E+3 3.056E+4 656.123 4.515E+3 6.938E+4 NE 2.04E+4 3.996E+3 2.216E+4 475.711 3.274E+3 5.03E+4 E 1.454E+4 2.848E+3 1.579E+4 339.297 2.335E+3 3.585E+4 SE 2.571E+4 5.038E+3 2.792E+4 600.501 4.132E+3 6.34E+4 S 5.854E+4 1.147E+4 6.357E+4 1.367E+3 9.406E+3 1.444E+5 SW 1.538E+4 3.012E+3 1.67E+4 358.837 2.469E+3 3.792E+4 W 2.04E+4 3.996E+3 2.216E+4 475.711 3.274E+3 5.03E+4 NW 2.814E+4 5.511E+3 3.056E+4 656.123 4.515E+3 6.938E+4 Table 5. Concentration in meat for different directions at time t = 0 (i.e. just after the accident). Concentration in meat (Bq/kg) Direction 131I 132I 133I 134I 135I Total N 7.549E+4 1.476E+4 8.196E+4 1.752E+3 1.21E+4 1.861E+5 NE 5.123E+4 1.002E+4 5.562E+4 1.189E+3 8.212E+3 1.263E+5 E 5.451E+4 1.066E+4 5.919E+4 1.267E+3 8.751E+3 1.344E+5 SE 9.641E+4 1.886E+4 1.047E+5 2.242E+3 1.549E+4 2.377E+5 S 2.195E+5 4.294E+4 2.384E+5 5.104E+3 3.525E+4 5.412E+5 SW 5.766E+4 1.128E+4 6.261E+4 1.34E+3 9.255E+3 1.421E+5 W 7.651E+4 1.496E+4 8.307E+4 1.776E+3 1.227E+4 1.886E+5 NW 1.055E+5 2.063E+4 1.146E+5 2.45E+3 1.692E+4 2.601E+5 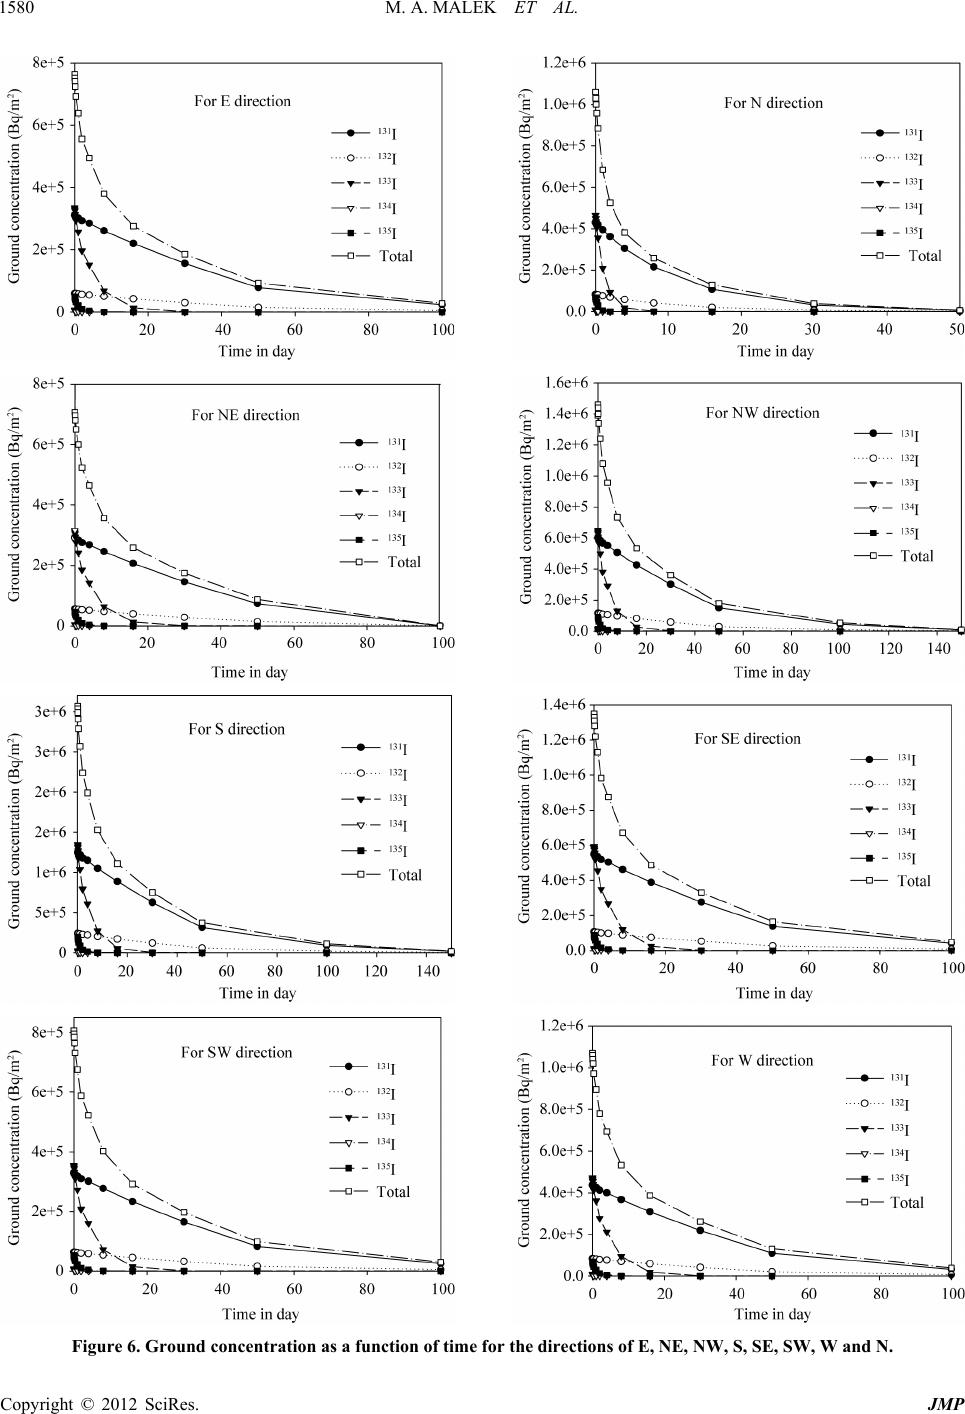 M. A. MALEK ET AL. 1580 Figure 6. Ground concentration as a function of time for the directions of E, NE, NW, S, SE, SW, W and N. Copyright © 2012 SciRes. JMP  M. A. MALEK ET AL. 1581 Figure 7. Concentration in vegetation (Bq/kg) as a function of time (day) for E, N, NW, SW, SE, NE, W and S. Copyright © 2012 SciRes. JMP  M. A. MALEK ET AL. 1582 Figure 8. Concentration in milk (Bq/kg) as a function of time (day) for directions E, NE, NW, S, SE, SW, W and N. Copyright © 2012 SciRes. JMP  M. A. MALEK ET AL. 1583 Figure 9. Concentration in meat as a function of time for the direction of E, SE, NE, W, NW, S and NE. Copyright © 2012 SciRes. JMP  M. A. MALEK ET AL. Copyright © 2012 SciRes. JMP 1584 radioiodine is Cmeat 133I > Cmeat 131I > Cmeat 132I > Cmeat 135I > Cmeat 134I where “CmeatI” refers to the concentration of different isotopes of iodine in meat. The time dependent concentration of meat due to 131I, 132I, 133I, 134I, 135I and total (131I + 132I + 133I + 134I + 135I) in different directions were plotted and are shown in Figure 9. The concentra- tion of 133I is significantly higher than that of all other isotopes of iodine (i.e. 131I, 132I, 134I, 135I). 6. Concentration in Different Pathways In this study, a computational code has been developed Based on the atmospheric dispersion phenomena for as- sessment of radiological concentration due to release of radioiodine for a hypothetical accident of the TRIGA Mark-II research reactor. Based on the assumed hypo- thetical accidental condition, activity of the radioiodine 131I, 132I, 133I, 134I and 135I in the reactor core and their release rate were calculated. The air concentrations for these five isotopes of iodine in 16 directions were pres- ently calculated with respect to downwind distance from the core of the reactor. The maximum air concentrations for all the 16 directions were found at 110 m distance from the reactor core. Maximum value of air concentra- tion for all of the radioisotopes of iodine was found along S-direction and the lowest was found in NE direction. The ground concentration, concentration in vegetation, milk, and meat for the above-mentioned radioisotopes of iodine were measured for 8 directions (i.e. N, NE, E, SE, S, SW, W, and NW) as a function of time. The concen- tration in the different pathways of the radioisotopes of radioiodine are very low in other 8 directions (i.e. NNE, ENE, ESE, SSE, SSW, WSW, WNW, and NNW), be- cause of lower frequency of the wind in these directions and hence the calculation of the concentrations along these directions were avoided in this work. Concentration in vegetation for 131I was found to be highest than all other isotopes and for 132I and 134I the values were predicted to be zero. Concentration in milk of 133I was higher and that of 134I was lower within all other isotopes of iodine. The concentration in meat of 133I was found to be higher than other isotopes of iodine and that was lower for 134I. There should be an awareness and caution about taking plants or vegetable grown at the site of accident. This study might provide a guideline on the radiological safety measures that has to be taken for ra- diation protection due to ingestion of vegetation, milk and meat from the reactor site at AERE in case of a ra- diological accident. 7. Acknowledgements The authors are thankful to the staffs of EI for their sin- cere efforts to complete the secretarial job. REFERENCES [1] International Atomic Energy Agency, Information to be Submitted in Support of Licensing Application for Nu- clear Power Plants, “A Safety Guide,” Technical Report Series No. 50-SG-G2, Vienna, 1979. [2] A. Ararkrog, “Global Radiological Impact of Nuclear Activities in the Former Soviet Union,” Proceedings of International Symposium on Environmental Impact of Radioactive Releases, Vienna, 8-12 May 1995. [3] International Atomic Energy Agency, “Generic Models and Parameters for Assessing the Environmental Transfer of Radionuclides from Routine Releases,” Safety Series No. 57, IAEA, Vienna, 1982. [4] I. I. Kryshev, K. P. Makhonko, T. G. Sazykina, “Dose Assessment and Reconstruction in the Areas of Russia Contaminated after the Chernobyl Accident,” IAEA- TECDOC-755, pp. 105-114. [5] International Atomic Energy Agency, “Generic Models for Use in Assessing the Impact of Discharge of Radioac- tive Substances to the Environment,” Safety Series No. 19, IAEA, Vienna, 2001. [6] International Atomic Energy Agency, “Research Reactor Core Conversion Guidebook,” IAEA-TECDOC-643, 2, 1992. [7] W. L. Woodruff, D. K. Warinner and J. E. Motas, “Re- search Reactor Core Conversion Guide Book,” IAEA- TECDOC-643, 2, 1992, pp. 155-178. [8] H. Chember, “Introduction to Health Physics,” 3rd Edi- tion, The MeGraw-Hill Companies Inc., New York, 1996. [9] INTERATOM, Bergisch Glad Bach, Federal Republic of Germany, “Fundamental Calculation Model for the De- termination of the Radiological Effects inside and outside the Research Reactor after Hypothetical Accidents with Release of High Amount of Fission Products from the Core, Research Reactor Core Conversion Guidebook,” IAEA-TECDOC-643, IAEA, Vienna 2, 1992, pp. 211- 232. [10] H. Geiss, K. Nester, P. Thomas and K. J. Vogt, “In der Bundesrepublik Deutschland Experimental Ermittelte Aus- breitungsparameter Fuer 100 m Emissionshoehe,” Reps Juel-1707, KIK-3095, Kernforschungsanlage Kuelich/Kern- forschungsze-ntrum, Karlsruhe, 1981. [11] K. J. Vogt and H. Geiss, “Neue Ausbreitungskoeffi- zienten Fuer 50 and 100 m Emissionshaoehe,” Internal Rep., Kernforschungsanlage, Juelich, 1980. [12] W. Huebschmann, K. Nester, and P. Thomas, “Ausbrei- tungsparameter Fuer Emissionshoehe, von 160 m und 195 m,” Rep. KfK-2939, Kernforschungszentrum, Karlsruhe, 1980. [13] National Council on Radiation Protection and Measure- ments, “Uncertainty in NCRP Screening Models Relating to Atmospheric Transport, Deposition, and Uptake by Humans,” NCRP Commentary No. 8, NCRP, Bethesda, 1993. [14] National Council on Radiation Protection and Measure- ments, “Screening Techniques for Determining Compli- ance with Environmental Standards,” Releases of Ra- dionucliders to the Atmosphere, NCRP Commentary No.  M. A. MALEK ET AL. 1585 3, Revision Plus Addendum, NCRP, Bethesda, 1996. [15] S. S. Raza, M. Iqbal, A. Salauddin, R. Avila and S. Per- vez, Time-Integrated Thyroid Dose for Accidental Re- leases from Pakistan Research Reactor,” Journal of Ra- diological Protection, Vol. 24, No. 3, 2004, pp. 307- 314. doi:10.1088/0952-4746/24/3/009 [16] M. Mizanur Rahaman, “Dose Assessment of a Contami- nated Land Containing Radioactive Materials,” M.Phil Thesis, Bangladesh University of Engineering and Tech- nology, Dhaka, 2003. Copyright © 2012 SciRes. JMP
|