Y. KURIHARA ET AL.
794
bank independence on stock prices as well as the effects
of some macroeconomic variables on stock prices. The
central bank independence index is drawn from two fa-
mous ones [1,13], which have been cited frequently. Two
groups of countries area used for this analysis: dev eloped
economies and developing/emerging economies. A com-
parison of these categories seems very important for the
conduct of monetary policy and for stable growth. Al-
though the ideal would be to use a reliable central bank
index, it is difficult to collect this type of data. Two reli-
able data [9,13] are employed in this article. However,
political and economic elements of the two indices are
distinguished to analyze the effects of the central bank
independence and some economic variables on stock
prices.
2. Theoretical Analysis
This article empirically examines the effect of central
bank independence and economic variables on stock
market prices. The equation for the empirical analysis is
as follows:
STOCKit = Const + αCBIit + βXit + εit (1)
STOCK means year-to-year p ercentage change of stock
prices. CBI denotes central bank independence index. X
means four macroeconomic variables related to stock
prices (explained in 3-1 in detail). i denotes country and t
means time. This equation is orthodox and not new as
based on [1]. Both the effect of CBI effect on stock
prices and some related macroeconomic variables with
stock prices and goals of central banks are added as ex-
planation variables for empirical estimation. This equa-
tion is orthodox and not new as based on [1].
The effect of CBI on stock prices is the main focus of
this article; it cannot be omitted. Second, almost all of
the central banks conduct their policies to attain stable
inflation rates. Inflation rate should be examined. Third,
interest rate is the most important factor for determina-
tion of stock prices. It is added as an explanation variable.
Fourth, as most central banks are interested in economic
growth, GDP growth is used as an explanation variable.
Finally, export growth is added as an explanation vari-
able as per [1], because not only the cases of developed
but also those of emerging and developed countries are
employed for estimation. Some developing and emerging
economics depend on exports for economic growth, na-
mely, in stock prices.
The main interest is in the effects of CBI on stock
prices. The CBI indices used here are the Cukierman and
Arnone index of the subindices for political independ-
ence and economic independence, together and in total.
All measures of CBI are measured for the period for
which the returns are calculated. Changes do not always
represent permanent shifts in the level of the CBI proxy.
3. Empirical Method and Results
3.1. Empirical Method
The data are yearly. For central bank independence, the
data derived from [9,13] are both used. The two papers
provided data regarding central bank independence; all
data are fixed. The sample periods are from 1989 to 1992
for the index of [13] and from 2005 to 2007 for the index
of [9]. These indices are based on information about cen-
tral bank independence across 10 dimensions. [9,13] are
combined with different weights in an economic and
political independence index. Both economic and politi-
cal factors are taken into account.
[14] found that the differences in behaviors among
central banks are consistent with the economic measure
of independence, which measures how easy it is for the
government to finance its deficits by direct access to
credit from the central bank. For example, one of the
economic differences is whether or not the central bank
is obliged to finance government debt, and one of the
political differences is the relationship between the cen-
tral bank and the government in determining monetary
policy. Both economic and political elements should be
considered in determining the central bank index.
This article divides the countries into two groups: 1)
developed countries and 2) developing or emerging
countries. For developed countries, the countries esti-
mated are Australia, Austria, Belgium, Korea, Nether-
lands, New Zealand, Norway, Portugal, Singapore, Spain,
Sweden, Switzerland, the United Kingdom, and the Uni-
ted States. Developing and emerging economies include
Barbados, Columbia, Israel, Malta, Peru, Philippines,
South Africa, Turkey, and Venezuela. Only the countries
selected were examined in this analysis due to the data
available.
The stock market prices are percentage year-to-year
change and are used for dependent variables. Explana-
tory variables include the index of central bank inde-
pendence, inflation, GDP growth, export growth, and in-
terest rate. All of the data except the index of central
bank independence are percentage year-to-year change
and are from International Financial Statistics (Interna-
tional Monetary Fund). Three indices are used for central
bank independence: total, economic, and political.
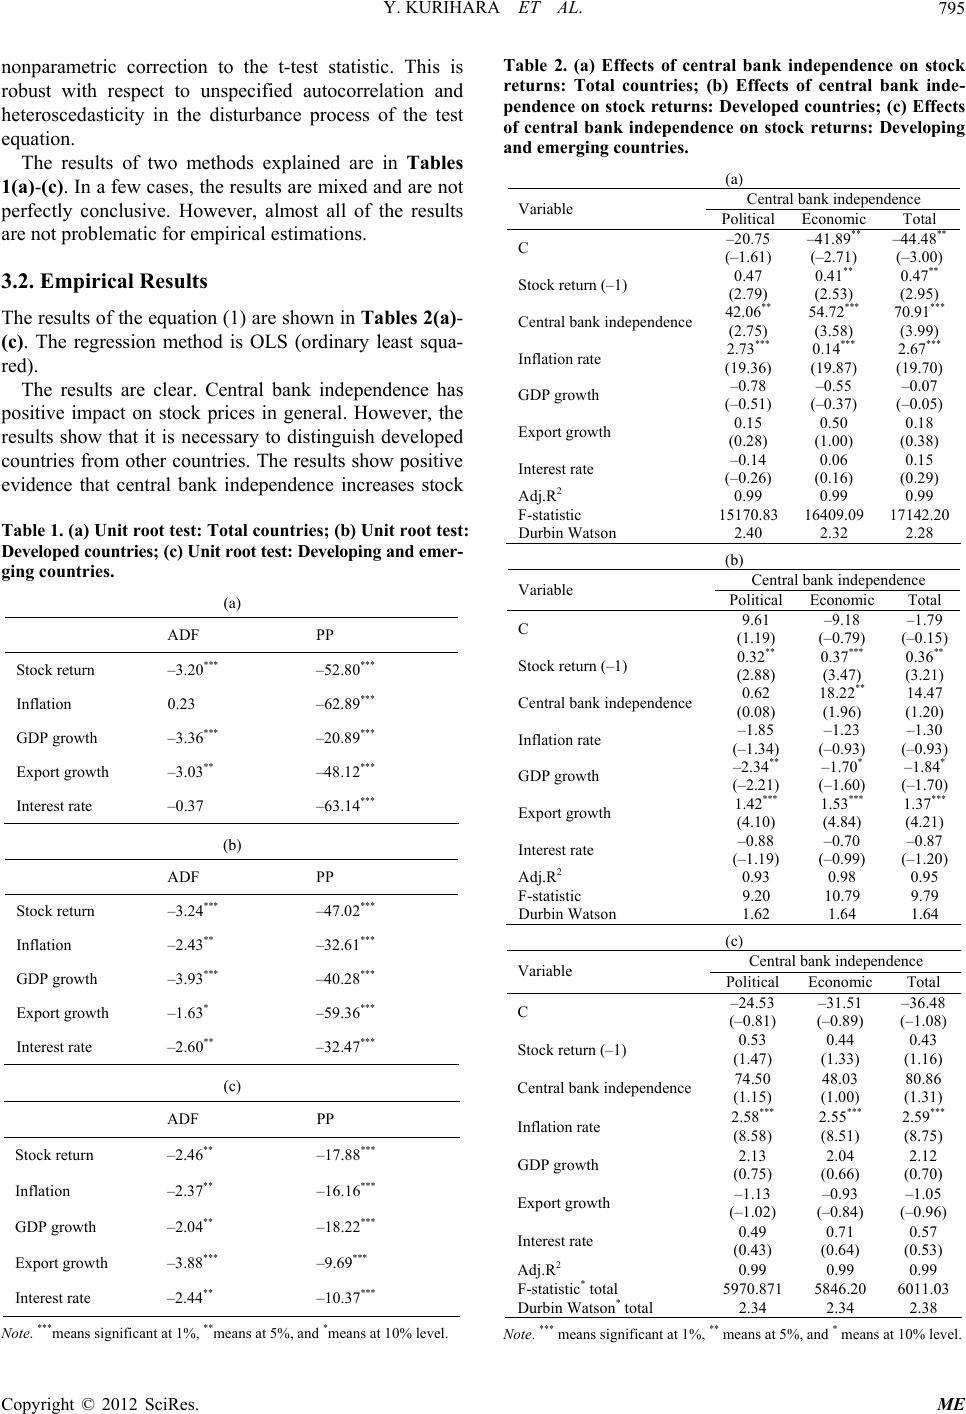
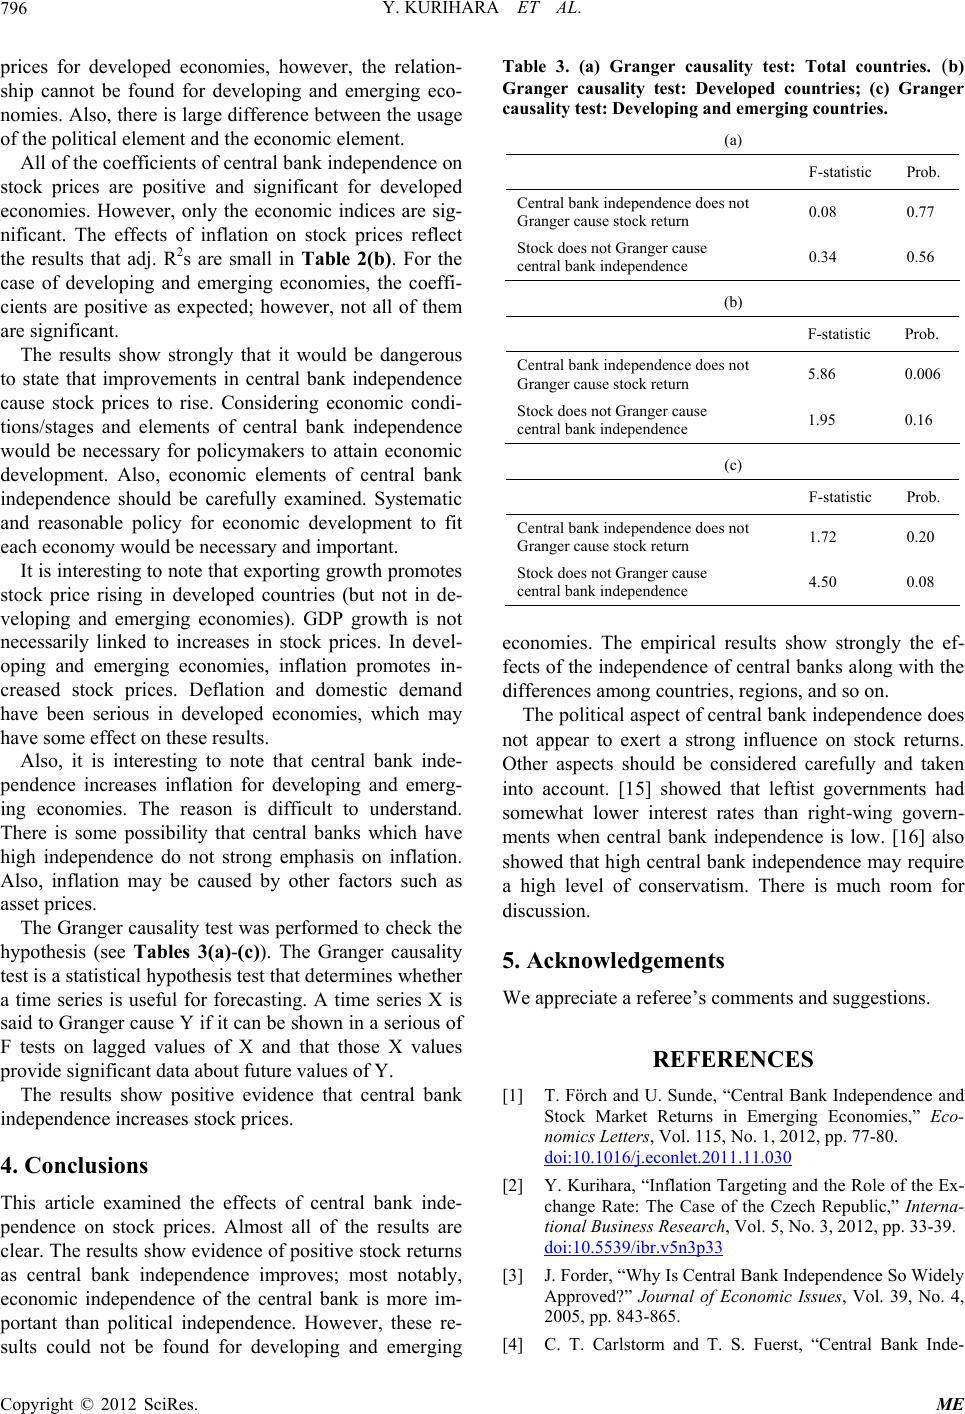
It is necessary to check unit root tests for estimation.
This paper uses two typical methods: augmented Dickey-
Fuller (ADF) and Phillips-Perron (PP). ADF is most used
for empirical estimation; however, if the series is corre-
lated at higher order lags, the assumption of white noise
disturbances is violated. The PP test proposes a method
by which to control for higher order serial correlation in
a series than is accepted in the equation. The test makes a
Copyright © 2012 SciRes. ME