Paper Menu >>
Journal Menu >>
 Modern Economy, 2012, 3, 766-779 http://dx.doi.org/10.4236/me.2012.36098 Published Online October 2012 (http://www.SciRP.org/journal/me) Consumption Profile of the Socially Excluded People Maniklal Adhikary1, Khokon Sarkar2 1Department of Economics, University of Burdwan, Burdwan, India 2Department of Economics, M.U.C Women’s College, Burdwan, India Email: khknsrkr@gmail.com Received April 19, 2012; revised June 10, 2012; accepted June 20, 2012 ABSTRACT People are excluded when they are not a part of main stream of society in their daily life due to caste, creed, religion and economic condition. This indicates that the socially excluded people are customarily shunned in the zone of em- ployment, community, friends and family. Nobody would deny that many old age people, homeless people, people with aids, people with mental and physical disability, ex-prisoners are said to be at the risk of exclusion. In this paper we have defined excludability in terms of castes, creed, religion, economic conditions and others. We would look into the food security status reflected in consumption profile among those particular categories of people, in terms of their monthly per capita expenditure (MPCE) on both food and non-food items with the help of NSSO 61st round data. Based on goal post index the consumption pattern of the socially excluded people across different states of India has been made evident. We have also tested the Engels law, and it has been found empirically accepted. Contrasted with the situation of other caste people the food security status of the socially excluded people has been found to be placed at all-time low level. Keywords: Social Exclusion; Food Security; Monthly per Capita Expenditure; Engels Law 1. Introduction India suffers from chronic food insecurity and social ex- clusion from the very beginning. But the problems of exclusion are far older than the problems of food insecu- rity. Food insecurity and social exclusion are the two faces of the same coin as both prevail in the society si- multaneously [1]. The problem of food insecurity has even been found to exist in its full strength since inde- pendence. But the problems of exclusion were prevalent from the ancient era of the Indian society. In a society food insecurity exists when all people at all time do not have safe, sufficient and nutritious food for their active and healthy life. That is, from the supply point of view it indicates the lack of availability, and from the demand side it reflects the lack of purchasing power [2]. On the other hand social exclusion exists when some people do not have the same opportunity to lead an equal healthy life as others of the society due to some social obligations. Both these problems are multifaceted and so we cannot define them in a single word. In some cases food insecurity gives birth to social exclusion and in some other cases social exclusion leads to food inse- curity; also sometimes both food insecurity and social exclusion grow simultaneously [3]. From the emergence of the concept of food security, various methods have been introduced by various authors to measure the actual number of food insecure persons. Food insecurity exists in almost all society in India, but it is very prominent amongst socially excluded classes. Here we are taking monthly per capita expenditure of the various communities of the people as a proxy measure to reflect on food insecurity/security. From Engel’s law of expenditure pattern, we know that as the income of the person increases his expenditure on necessary commo- dity (especially on food) decreases. This implies that the demand curve as income increases will be backward bending to the necessary commodity axis. So obviously for those who are not at the level of the food security, their consumption pattern should not follow this law. And it is evident that the socially excluded people e.g. SC/ST population suffer more chronic food insecurity than the others [4]. India is the largest democratic country in the world. It has also a large history of social exclusion. The exclusion among the Indians started from the Vedic period, where the people were separated in some caste according to their livelihood and living style. The people those who belonged to the lower caste were deprived and exploited in the society and this has not yet changed significantly. Long after independence the classism, which was the main cause of exclusion in traditional past period con- tinued still in a different manner. And it became the main feature of the Indian society; especially caste became the C opyright © 2012 SciRes. ME  M. ADHIKARY, K. SARKAR 767 main pillar of identity in The Hindu society. So, caste becomes the main factor of exclusion or inclusion in the various economic activities like production, distribution or any gainful job to a particular person. The Hindu caste system looks like a Pyramid structure where majority of the lower caste were kept at the bottom of the Pyramid and forced to serve to the upper caste. As Dr. Ambedkar (1979) [5] truly said that by the Hindu social system the communities are placed in an ascending scale of respect and a descending scale of hatred. In an Anthropological Survey of India (ASI) K. S. Singh, Published many papers entitled as “the People of India”, which identified 2800 castes including 450 SC, 461 ST, and 766 OBC. In our country, all major assets of production are owned by the upper caste people and lower strata of the society that particularly includes de- pressed classes (SC/ST) is the section of people without asset. The unequal distribution of wealth compels the depressed classes to depend on the upper classes for their survival. This is the main reason of socio-economic ex- ploitation and exclusion in India. So, the socially excludable sections of the society in India are SC/ST and they are called Dalit. Their eco- nomic conditions are being wear and tear gradually. Generally they are working in the unorganized sector and their socio-economic conditions are miserable as pointed out in various commissions’ reports appointed by the Government of India. It has been found that though India is on the path of high economic growth, its number of people live below the poverty line. It is a matter of dis- appointment that still 79 per cent of unorganized workers, 88 percent of SC/ST population, 80 per cent of OBC and 84 percent of Muslims belong to the poor and vulnerable group [6]. They are living in social insecurity, insanitary environment and excruciating conditions. In India women are also excluded from socio eco- nomic status from the very beginning of the Indian cul- ture. They were excluded from the basic education, ac- tive participation in labour force, and political participa tion in taking decision for family welfare. They are also excluded from the property right in Hindu bequest sys- tem. In India it was also not permitted for the widows to marry again; so after being widow for them there were no means of subsistence for their daily necessity, and they were forcedly excluded from the society in every respect. Even in India inter creed marriage or inter caste marriage are not socially well conventional still now. After the 60 years of independence the uncovered picture of social exclusion in India is still unending in its means. This paper has been organized as follows. In Section 2, we discuss some literature on social exclusion and food security. In Section 3, we have discussed the objective of this study, where we try to analysis various definitions and implications of food security and social exclusion with the history of exclusion prevalent in India for a long time, since in this paper we want to draw special atten- tion on socially excluded peoples. In Section 4, we dis- cuss about our methodology and data base we have used. We try to evaluate empirically the food security status of various socially excluded persons across the major states of India, in Section 5. And finally conclusions and rec- ommendations from our findings are presented in Section 6. 2. Brief Review of Literature According to Department for International Development (DFID 2005) [7] on “Reducing Poverty by Tackling So- cial Exclusion” there are various ways by which people can be excluded from the others of the society across the world. And DFID cited varies examples of exclusion from the current phenomenon continuing in the world. In this paper it has been highlighted that the social exclu- sion promotes poverty, and as a result, poverty reduction programs basically failed because of social exclusion. And how social exclusion promotes poverty had been defined as follows: 1) Social exclusion causes poverty of particular people, leading to higher rates of poverty among affected groups; 2) Social exclusion reduces productive capacity and rate of poverty reduction of a society as a whole. And DFID finally suggests many policies through which we can reduce exclusion and poverty and ulti- mately social insecurity in all respects. Robert Jenkins (2006) [8] pointed out that the socially excluded section of the society namely SC/ST are not only deprived from the common rights of the daily life namely food, shelter, clothing but also deprived from the right to education. He collected data from the NSSO and NHFS-II, and after analyzing these data he concluded that the enrolment of SC/ST students in primary schools is too low compared to that of other classes. And obvi- ously in higher education the ratio of SC/ST students to those of others is declining continuously as the level of education increases. According to Jenkins the causes of low enrollment are: 1) lack of sufficient schools in re- mote areas; 2) the ruthless behavior of the upper caste teachers towards SC/ST students; 3) the pecuniary condi- tions of the parents as the cost of education for most of the SC/ST families are seen to be much higher than their monthly per capita income; 4) the opportunity costs of education for the girls are also higher than the cost of education as they are used for working at home for the well being of the family. Based on data collected by NHFS-II and NSSO (60th round) Peter Svedberg (2006) [9] has established the fact that child nutrition in India varies among different states between the values 22 to 56 percent. The methodology Copyright © 2012 SciRes. ME  M. ADHIKARY, K. SARKAR 768 he applied is the multiple regression analysis with con- trols for multi co-linearity, reverse causation and robust- ness. It has been found in his study that the interstate differences in child stunting are not directly correlated with the differences in income poverty, rather it can be better explained with the provision of child health care along with fertility rate. Child health care provision has been explained in terms of relative status of women in society and household per capita income. And he has analyzed that the larger interstate variation in fertility was strongly related with government health expendi- tures and household per capita income. Amartya Sen (2000) [10] has examined critically the idea of social exclusion, particularly in the context of deprivation and poverty. In his analysis social exclusion has been placed as capability deprivation, which is the broader meaning of poverty. And this theoretical ground- work for the approach of social exclusion will help us extend the practical use of the approach. Addis Ababa (September, 2009) [11] shows that in Ethiopia more than 58% of total population were living in absolute poverty (2007).This is because of the fact that the impact of inflation started in 2005 and has apparently resulted in increased food insecurity in urban areas. The prices of cereals have been reported to increase by more than 100% since mid 2005. 3. Objectives The word “social exclusion” [12] comes from France, where it was used as the basis for policy of social inclu- sion or integrating people into society, to provide com- mon benefits to the deprived classes of the society. Peo- ple are excluded when they are not a part of main stream of society in their daily life; that is, people are said to be excluded socially when they are out of employment, com- munity, friends and family. Also many old age, homeless, people with aids, people with mental and physical dis- ability, ex-prisoners are said to be at the risk of exclusion. This is a very wide concept. On the one hand, it means lack of opportunity for social relationship and on the other hand, it means failure of social protection to those dishonored socially separated people. Exclusion comes in various ways. It primarily comes from the division of society based on caste system and gender biasness in the form of social sense. Exclusion also comes from financial sector which means that finan- cially weaker section of the society or poor people is excluded from participating in the normal activities, such as basic health care, higher education etc. From the labor market when people are unemployed for a long term, they are generally at the threat of exclusion. In many cases we can also notice the familial exclusion also of women who are deprived of taking the decision about the family matters. Children with physical and mental chal- lenge, people returning from jail, old-age people with inability to work etc are also some examples of social exclusion. From the macroeconomic point of view exclusion sharply focuses on rural urban discrepancies. Often we see that in urban areas there is high rate of growth equal to the national average rate in all sectors, but in rural areas in every respect the progress is far below the na- tional average. So, the fruits of economics are lion- shared by urban people only, while the rural people are strictly excluded from the economic progress. Even the economic progress is not equally shared by all the states; some states are far behind the national progress of the economy. This implies that social exclusion and eco- nomic exclusion are interlinked. As a matter of fact so- cial exclusion is likely to lead to economic deprivation of people. It is commonly expected that the socially excluded people are likely to lack economic security; the most vi- sible thing is the food insecurity of the socially excluded people. Food security is a multi-faceted concept—va- riously defined and interpreted. At one end of the scale, food security implies the availability of adequate supplies at a global and national level; at the other end, the con- cern is with adequate nutrition and well-being. Food se- curity as a concept originated only in the mid-1970s in the discussions of international food problems at a time of global food crisis. The initial focus of attention was primarily on food supply problems of assuring the avail- ability and to some degree the price stability of basic foodstuffs at the international and national level. The ini- tial focus, reflecting the global concerns of 1974, was on the volume and stability of food supplies. Food security was defined in the 1974 World Food Summit as “avail- ability at all times of adequate world food supplies of basic foodstuffs to sustain a steady expansion of food consumption and to offset fluctuations in production and prices”. In 1983, FAO expanded its concept to include securing access by vulnerable people to available supplies. This implies that attention should be balanced between the demand for and supply of the food. With this concept in mind, the food security equation needs to ensure that all people at all time must have to have both physical and economic access to the basic food they need for their livelihood. In 1986, the World Bank report “Poverty and Hunger” focused on the temporal dynamics of food insecurity. It introduced the widely accepted distinction between chro- nic food insecurity, associated with problems of struc- tural poverty and low incomes, and transitory food inse- curity, which involved periods of intensified pressure caused by natural disasters or economic collapse. This Copyright © 2012 SciRes. ME  M. ADHIKARY, K. SARKAR 769 concept of food security must be substantiated by the access of all people to sufficient food for their active and healthy life. The 1996 World Food Summit adopted a still more complex definition: “Food security, at the in- dividual, household, national, regional and global levels [is achieved] when all people, at all times, have physical and economic access to sufficient, safe and nutritious food to meet their dietary needs and food preferences for an active and healthy life”. This definition has further been refined in the State of Food Insecurity 2001: “Food security has a situation that exists when all people, at all times, have physical, social and economic access to suf- ficient, safe and nutritious food that meets their dietary needs and food preferences for an active and healthy life”. Essentially, food security can be described as a phe- nomenon relating to individuals. It is the nutritional status of the individual household member that is the ultimate focus, and the risk of that adequate status not being achieved or becoming undermined. The later risk describes the vulnerability of individuals in this context. As the definitions reviewed above imply that vulnerabil- ity may occur both as a chronic and transitory phenome- non. Useful working definitions state that food security exists when all people, at all times, have physical, social and economic access to sufficient, safe and nutritious food which meets their dietary needs and food prefer- ences for an active and healthy life. Household food se- curity is the application of this concept to the family level, with individuals within households as the focus of concern. Food insecurity exists when people do not have adequate physical, social or economic access to food as defined above. Our objectives in this study are as follows. 1) We shall examine the consumption profile of the socially excluded people’s across the 27 major states of India, with respect to GPI (goal post index), such that it reflects the food security status among the various cate- gories of the people, within the states. And 2) We examine the validity of Engels law of expendi- ture in Indian economy, since for food secured people the proportion of income spent on food is expected to decline with increase in income. 4. Methodology and Database Following Engel’s law (1821-1896) we want to see the absolute change in MPCE on food and non-food item for a percentage change in total MPCE, which is the proxy for the gross monthly income of the household. Since,the data on monthly income of the household is not abailable we have consider total MPCE equivalent to monthly per capita income. As we know by Engel’s law that as the income of the people increases, the expenditure on ne- cessity item like food will decrease. There is a close link between food security and Engle’s law. If the family un- der considaration has its food secure it is expected that with an increase in income the proportionate expenditure on food item decrease in othe words if the family has food security, the family is likely to increase its propor- tionate expenditure on luxary or non food iteam. There- fore if we see emperically that the proportion of income spend on food increases this is an indication that the fam- ily have not got already food security. On the otherhand if empirically it is found that the proportion of income on non food item increases this implise that the family con- cerned have already got food security and can effort to spend more income on non-food item and less on food item. Let y = MPCE on food and/or MPCE on non food. x = Total MPCE and A model that accomplishes this purpose can be written as 12 ln i yii xu (1) where the slope coefficient 2 = change in y/change in ln x = change in y /relative change in x We have, 22 d 1or dd d y y x x xx (2) This states that the absolute change in y y is equal to slope times the relative change in x. If the latter is multiplied by 100, then (2) gives the absolute change in y for a percentage change in x. Thus, if x x changes by 0.01 unit (or, 1 percent), the absolute change in y is 2 0.01 . The variables we shall consider are presented below MPCETOTAL: monthly per capita expenditure which is a proxy for monthly per capita total income; MPCE- FOOD: monthly per capita expenditure on food and MPCENFOOD: monthly per capita expenditure on non- food items. Here our objective is to examine whether the slope co- efficient 2 which is the absolute change in MPCE on food or non food iteam due to 1% change in MPCE- TOTAL will remain unalterd or not. Our null hypothesis is 02 :0H Against the alternative hypothesis 12 :0H For the empirical estimation we have used data from NSSO 61st round (July 2004-June 2005) for the 27 major states in India. Copyright © 2012 SciRes. ME  M. ADHIKARY, K. SARKAR Copyright © 2012 SciRes. ME 770 5. Food Security Status among the Socially Excluded Persons: Results of Estimation Since India has been suffering from both chronic food insecurity and social exclusion, we will discuss about how socially excluded section of the society is affected in the form of food insecurity. We are considering the con- sumption profile of the socially excluded people both in rural and urban regions. The Indian system of exclusion on the foundation of caste has also been reflected by the NSSO report (2004-2005). It has been exposed that near about 70 per- cent of the Indian population are backward classes sur- rounded by 19.59% SCs and 8.63% STs. It has been found that 91.4% of STs and 79.8% of SCs live in rural areas. The per capita monthly expenses of people living in urban areas were Rs.1052.36 per month against Rs.558.78 to those in rural areas. According to NSSO survey all India average spending by rural STs was the lowest at Rs.426.19, followed by rural SCs (Rs.474.72) and OTHER (Rs.658.31). In urban India, STs spent Rs.857.46, SCs Rs.758.38 and OTHERs Rs.1306.10 per month on an average. If we try to make a goal post index [13] on the basis of monthly per capita expenditure (MPCE) across the dif- ferent states of India for different groups of people, the interstate disparity among the socially excluded people’s consumption status will be evident easily. Our goal post index (GPI) is built on the formula Actual MPCEMinimum MPCE GPI Maximum MPCEMinimum MPCE The value of GPI lies between 0 and 1. The states for which the GPI value is nearly 1 are said to be more se- cured in respect of food and also for non-food item. On the other hand, the states for which GPI value is close to 0 are said to be more insecure in the consumption of food and non-food item. Now look at the below diagrams. Figure 1 shows the GPI on MPCE on food for ST community living in the Figure 1. GPI of food for rural ST. 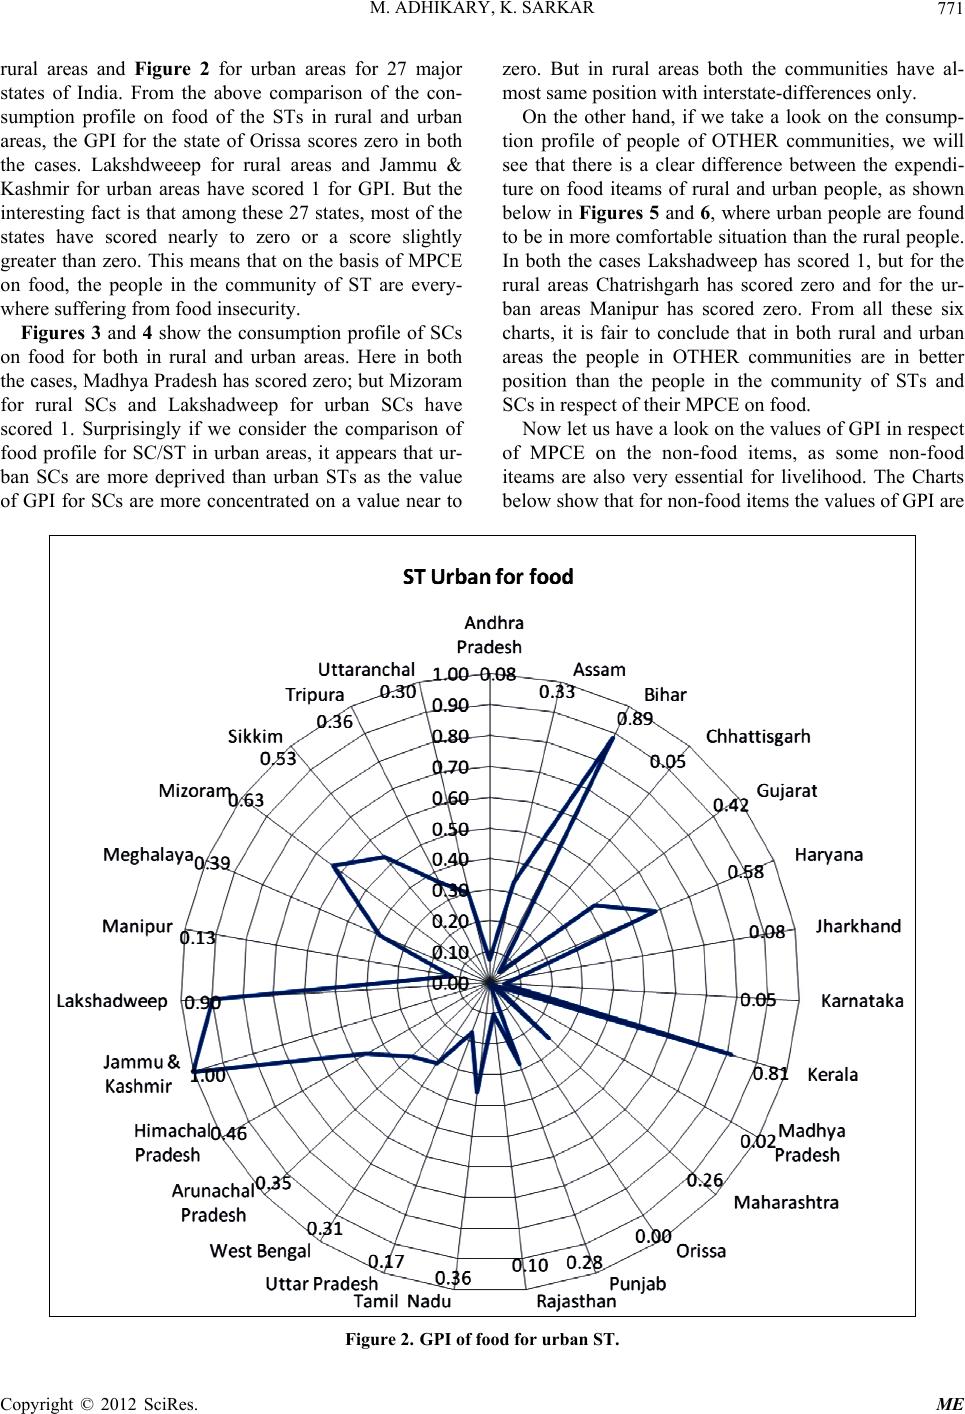 M. ADHIKARY, K. SARKAR 771 rural areas and Figure 2 for urban areas for 27 major states of India. From the above comparison of the con- sumption profile on food of the STs in rural and urban areas, the GPI for the state of Orissa scores zero in both the cases. Lakshdweeep for rural areas and Jammu & Kashmir for urban areas have scored 1 for GPI. But the interesting fact is that among these 27 states, most of the states have scored nearly to zero or a score slightly greater than zero. This means that on the basis of MPCE on food, the people in the community of ST are every- where suffering from food insecurity. Figures 3 and 4 show the consumption profile of SCs on food for both in rural and urban areas. Here in both the cases, Madhya Pradesh has scored zero; but Mizoram for rural SCs and Lakshadweep for urban SCs have scored 1. Surprisingly if we consider the comparison of food profile for SC/ST in urban areas, it appears that ur- ban SCs are more deprived than urban STs as the value of GPI for SCs are more concentrated on a value near to zero. But in rural areas both the communities have al- most same position with interstate-differences only. On the other hand, if we take a look on the consump- tion profile of people of OTHER communities, we will see that there is a clear difference between the expendi- ture on food iteams of rural and urban people, as shown below in Figures 5 and 6, where urban people are found to be in more comfortable situation than the rural people. In both the cases Lakshadweep has scored 1, but for the rural areas Chatrishgarh has scored zero and for the ur- ban areas Manipur has scored zero. From all these six charts, it is fair to conclude that in both rural and urban areas the people in OTHER communities are in better position than the people in the community of STs and SCs in respect of their MPCE on food. Now let us have a look on the values of GPI in respect of MPCE on the non-food items, as some non-food iteams are also very essential for livelihood. The Charts below show that for non-food items the values of GPI are Figure 2. GPI of food for urban ST. Copyright © 2012 SciRes. ME  M. ADHIKARY, K. SARKAR 772 Figure 3. GPI of food for rural SC. Figure 4. GPI of food for urban SC. Copyright © 2012 SciRes. ME 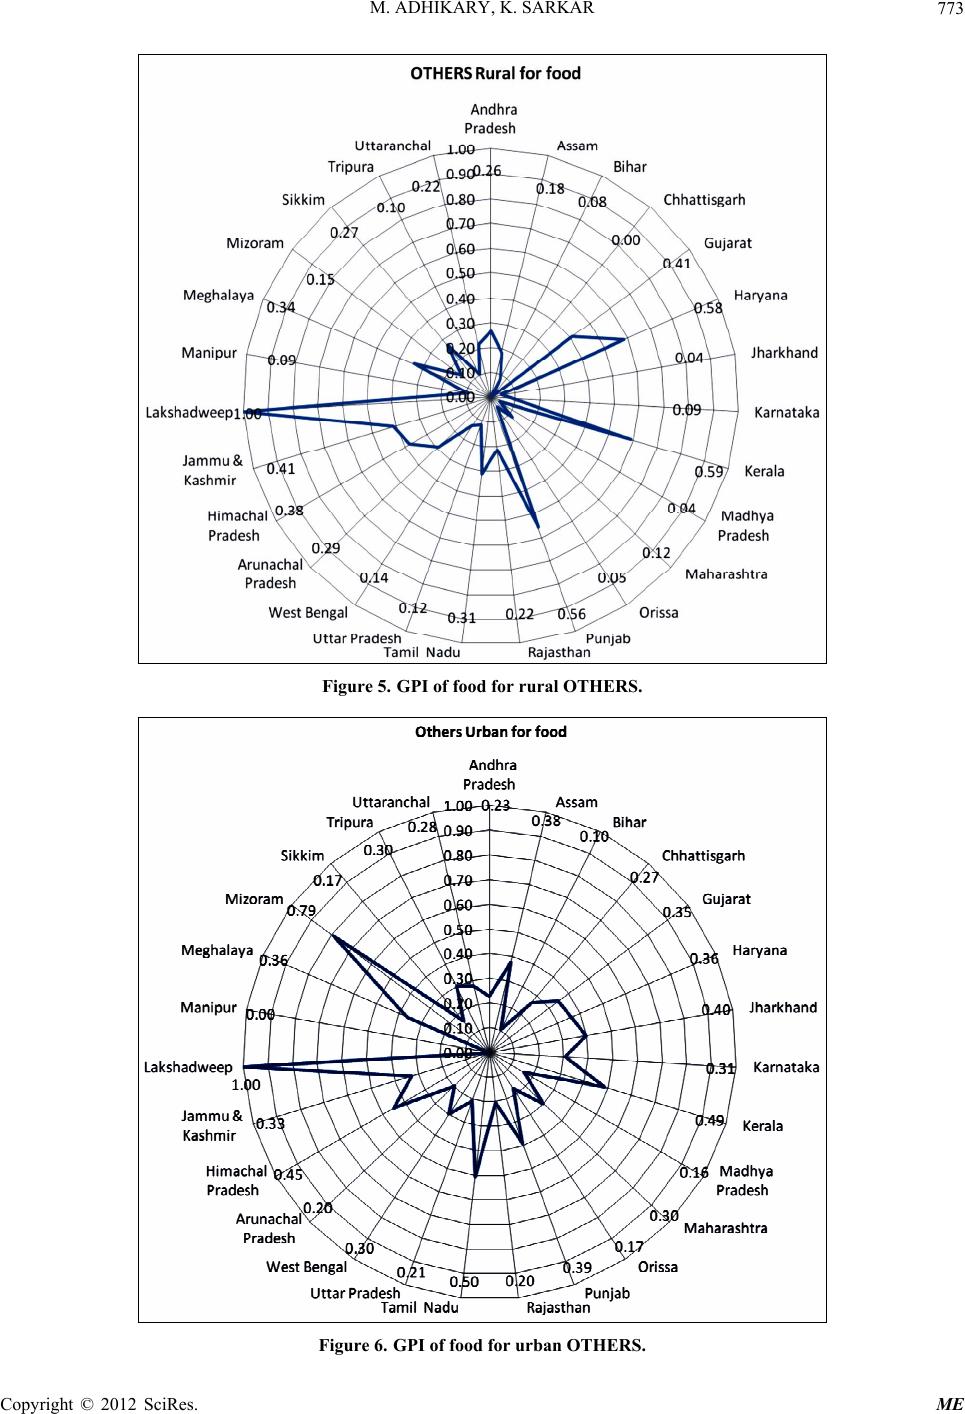 M. ADHIKARY, K. SARKAR 773 Figure 5. GPI of food for rural OTHERS. Figure 6. GPI of food for urban OTHERS. Copyright © 2012 SciRes. ME 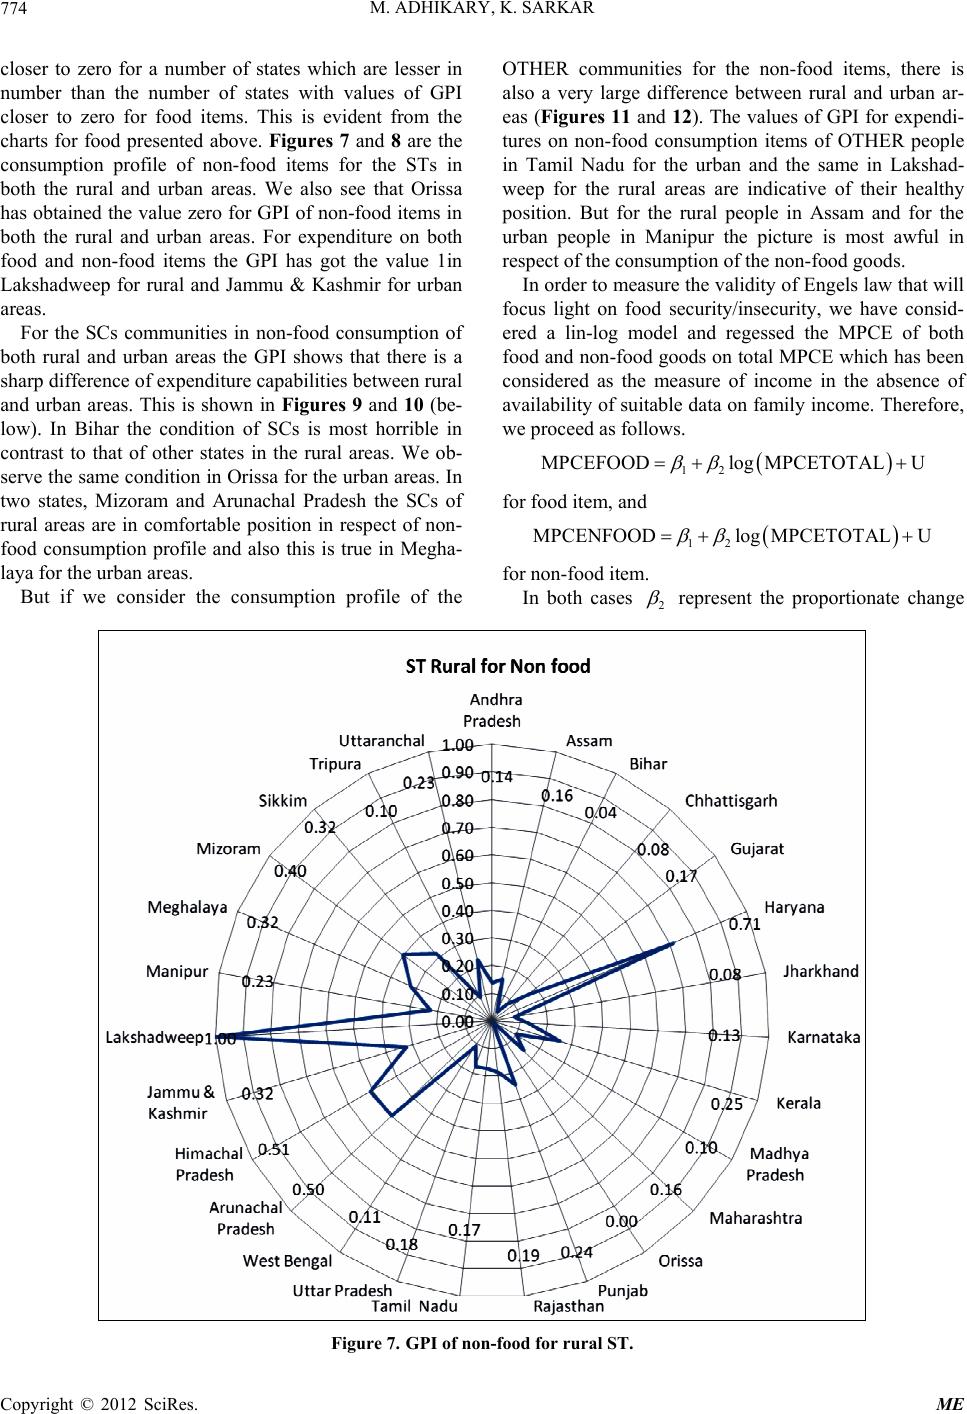 M. ADHIKARY, K. SARKAR Copyright © 2012 SciRes. ME 774 OTHER communities for the non-food items, there is also a very large difference between rural and urban ar- eas (Figures 11 and 12). The values of GPI for expendi- tures on non-food consumption items of OTHER people in Tamil Nadu for the urban and the same in Lakshad- weep for the rural areas are indicative of their healthy position. But for the rural people in Assam and for the urban people in Manipur the picture is most awful in respect of the consumption of the non-food goods. closer to zero for a number of states which are lesser in number than the number of states with values of GPI closer to zero for food items. This is evident from the charts for food presented above. Figures 7 and 8 are the consumption profile of non-food items for the STs in both the rural and urban areas. We also see that Orissa has obtained the value zero for GPI of non-food items in both the rural and urban areas. For expenditure on both food and non-food items the GPI has got the value 1in Lakshadweep for rural and Jammu & Kashmir for urban areas. In order to measure the validity of Engels law that will focus light on food security/insecurity, we have consid- ered a lin-log model and regessed the MPCE of both food and non-food goods on total MPCE which has been considered as the measure of income in the absence of availability of suitable data on family income. Therefore, we proceed as follows. For the SCs communities in non-food consumption of both rural and urban areas the GPI shows that there is a sharp difference of expenditure capabilities between rural and urban areas. This is shown in Figures 9 and 10 (be- low). In Bihar the condition of SCs is most horrible in contrast to that of other states in the rural areas. We ob- serve the same condition in Orissa for the urban areas. In two states, Mizoram and Arunachal Pradesh the SCs of rural areas are in comfortable position in respect of non- food consumption profile and also this is true in Megha- laya for the urban areas. 12 MPCEFOODlog MPCETOTALU for food item, and 12 MPCENFOODlog MPCETOTALU for non-food item. But if we consider the consumption profile of the In both cases 2 represent the proportionate change Figure 7. GPI of non-food for rural ST. 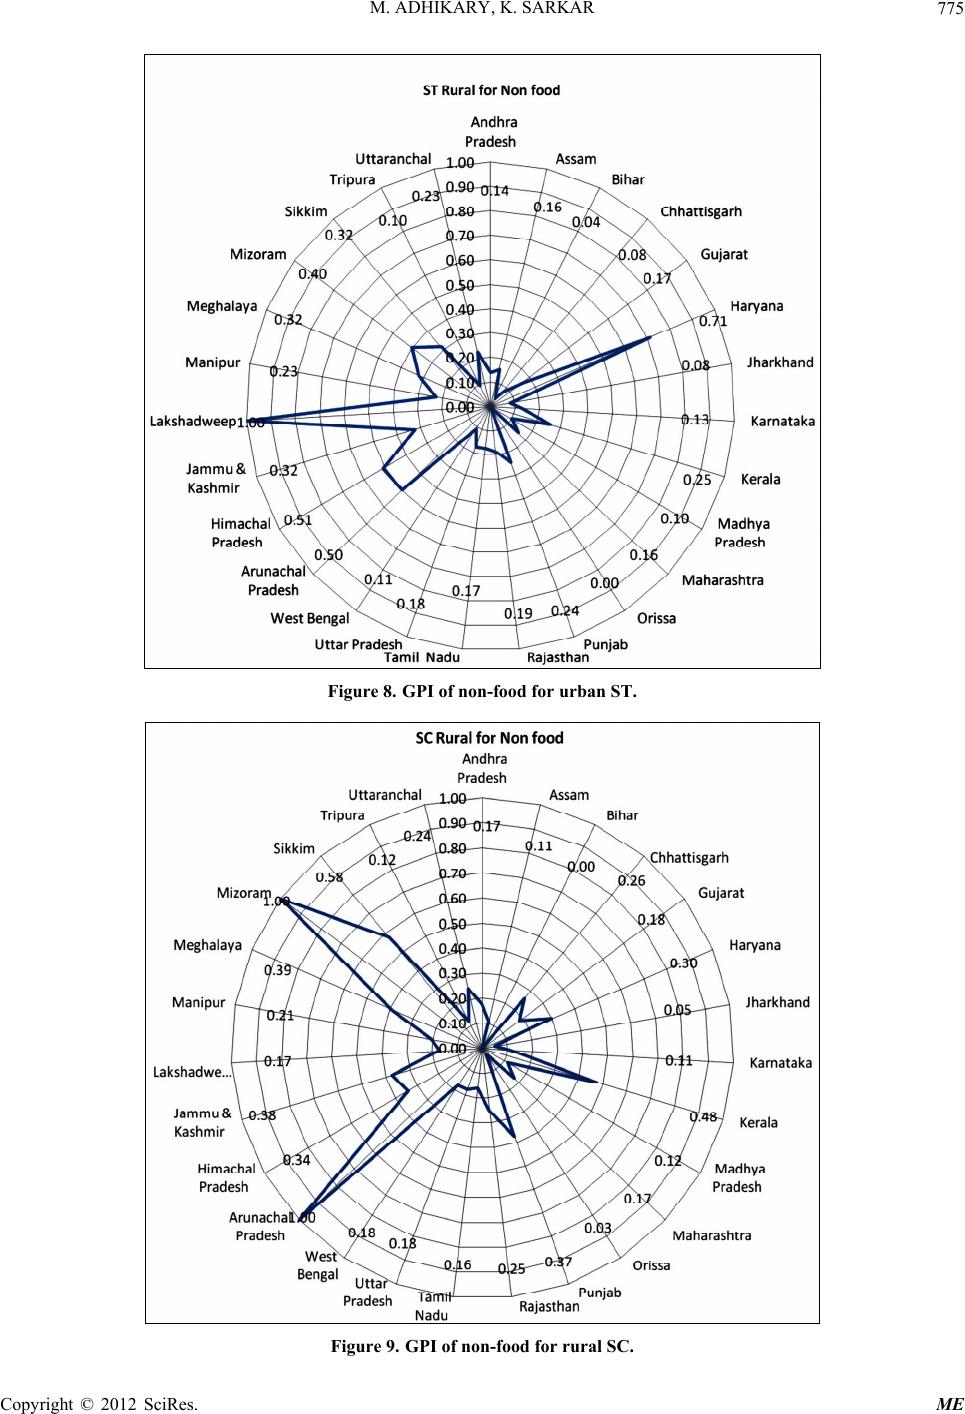 M. ADHIKARY, K. SARKAR 775 Figure 8. GPI of non-food for urban ST. Figure 9. GPI of non-food for rural SC. Copyright © 2012 SciRes. ME 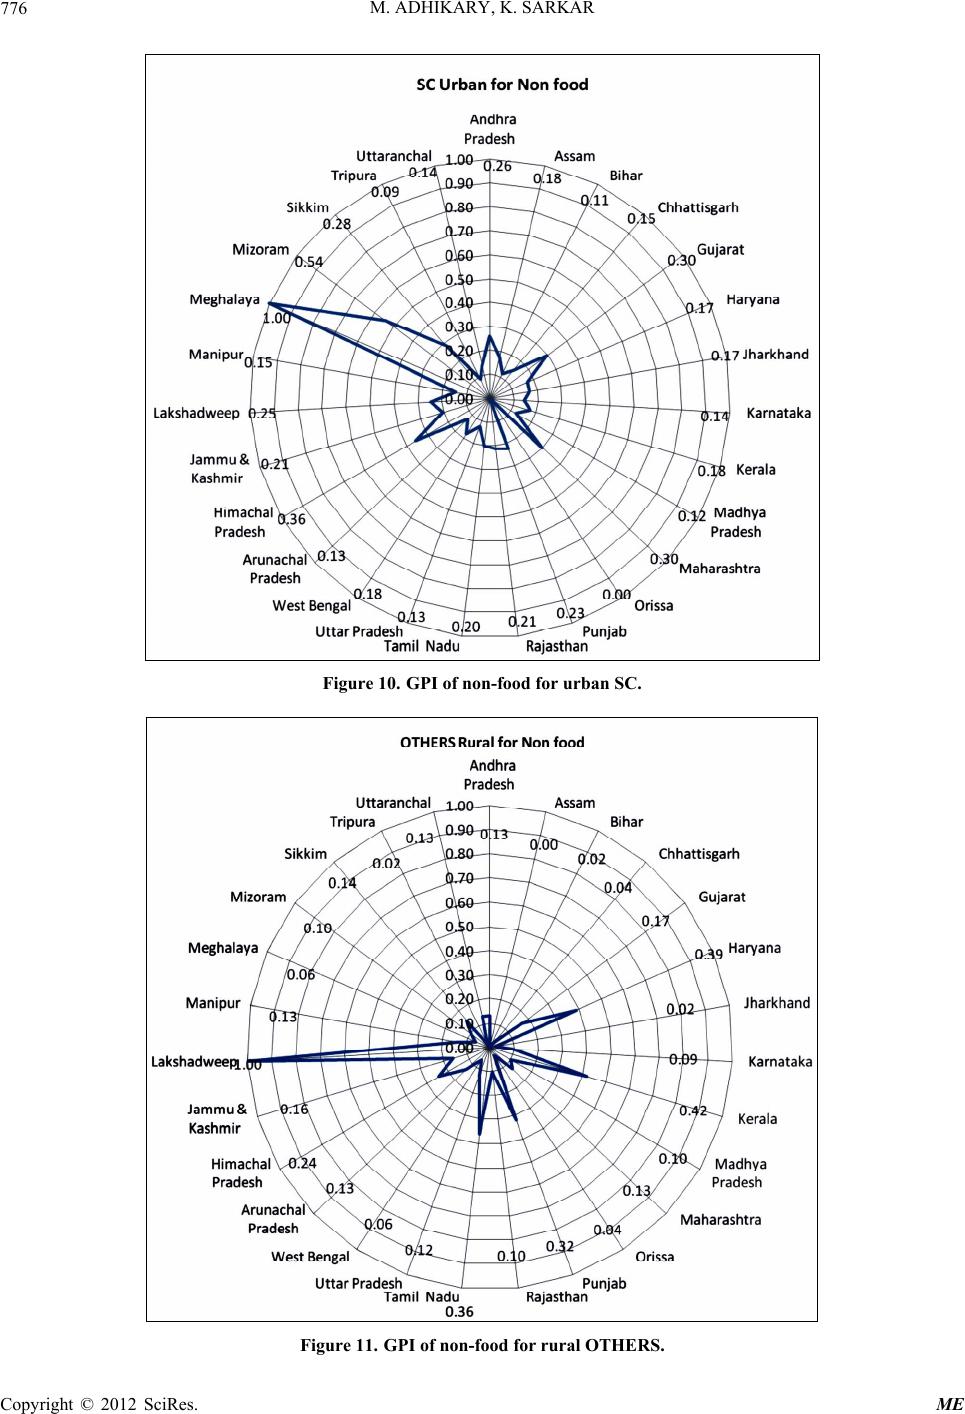 M. ADHIKARY, K. SARKAR 776 Figure 10. GPI of non-food for urban SC. Figure 11. GPI of non-food for rural OTHERS. Copyright © 2012 SciRes. ME 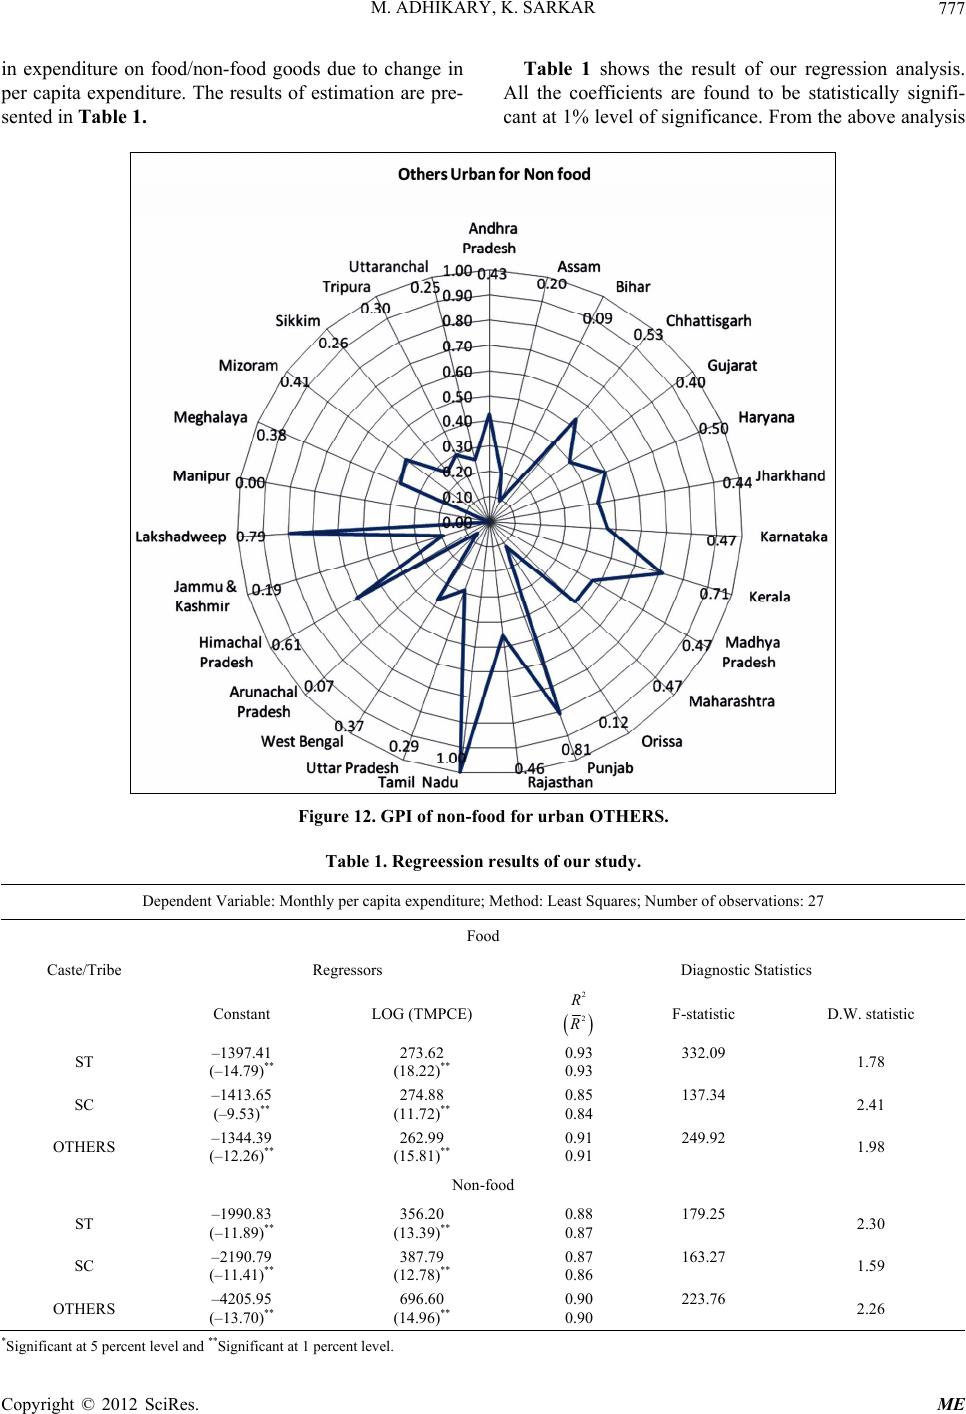 M. ADHIKARY, K. SARKAR Copyright © 2012 SciRes. ME 777 Table 1 shows the result of our regression analysis. All the coefficients are found to be statistically signifi- cant at 1% level of significance. From the above analysis in expenditure on food/non-food goods due to change in per capita expenditure. The results of estimation are pre- sented in Table 1. Figure 12. GPI of non-food for urban OTHERS. Table 1. Regreession results of our study. Dependent Variable: Monthly per capita expenditure; Method: Least Squares; Number of observations: 27 Food Caste/Tribe Regressors Diagnostic Statistics Constant LOG (TMPCE) 2 R 2 R F-statistic D.W. statistic ST –1397.41 (–14.79)** 273.62 (18.22)** 0.93 0.93 332.09 1.78 SC –1413.65 (–9.53)** 274.88 (11.72)** 0.85 0.84 137.34 2.41 OTHERS –1344.39 (–12.26)** 262.99 (15.81)** 0.91 0.91 249.92 1.98 Non-food ST –1990.83 (–11.89)** 356.20 (13.39)** 0.88 0.87 179.25 2.30 SC –2190.79 (–11.41)** 387.79 (12.78)** 0.87 0.86 163.27 1.59 OTHERS –4205.95 (–13.70)** 696.60 (14.96)** 0.90 0.90 223.76 2.26 *Significant at 5 percent level and **Significant at 1 percent level.  M. ADHIKARY, K. SARKAR 778 we can say that for the 1% boost in the MPCE, the ex- penditure on food increases by Rs.2.74 for STs, Rs.2.75 by SCs and Rs.2.63 by OTHERS (approximately). And for the 1% boost in the MPCE, the expenditure on non-food items increases by Rs.3.56 for STs, Rs.3.87 for SCs and Rs.6.96 for OTHERS (approximately). As we know by the Engels law of expenditure that as the in- come of a person increases his expenditure on food de- creases as he tries to consume more of luxary commodi- ties, from the above analysis we see that for every cate- gory of the people the expenditure on food increases as the per capita expenditure increases. So, we may con- clude that those people of India are still suffering from the chronic food insecurity, and these socially excluded people are in depths of despair than others. 6. Conclusions and Recomondations In this study our first objective was to see the position of socially excluded people across the 27 major states of India in both rural and urban areas. After analysing the GPI on the basis of MPCE, we observe the uneven dis- tribution of income as well as per capita expenditure among the states between the rural and urban areas within the various categories of the people. So, we would like to state that the Government should takes special cares for these states, which are in an awkward position of poverty. In rural urban circumstances there is also a sharp dif- ference in respect of MPCE on both food and non-food goods, and so measures relating to increase in per capita income of the household through appropriate employ- ment generation in the rural areas should be taken. This will likely to result in the reduction of the difference be- tween rural urban MPCE. For the various categories of the people, especially for the socially excluded communities, their MPCE for both food and non-food goods are alawys lower in compari- sion to that of others for every state. So, it is also very important to provide them with special facilities in re- spect of income/expenditure, so that the gap between social inclusion and exclusion in respect of MPCE can be minimized. For the effective validation of Engels law which fo- cuses on the issue of food security, India first needs to reach the position in food security not only from the sup- ply side but also from the demand side. In supply side though, India can claim that she has achived food secu- rity but from the demand side it is far from being satis- factory, especially, for those of her socially excluded communities, who are unable to attain the effective de- mand everywhere in every respect. In order to create effective demand through these ex- cluded people India needs some job oriented programmes. Although some job oriented programmes like PMRY, NREGA [14], 100 days work etc. are running all over India, their effective implimentation are very poor in some states and also in some states their performance is unsatisfactory. Micro finance [15] provision for those socially ex- cluded people can also be a very effective instrument to achive food security from the demand side. REFERENCES [1] S. S. Acharya, “National Food Policies Impacting on Food Security: The Experience of India, a Large Popu- lated Country,” Research Paper No. 2006/70, World In- stitute for Development Economics Research, UNU, 2006. [2] A. Addis, “Food Security and Vulnerability in Selected Town of Tigray Region, Ethiopia, Vulnerability Assess- ment and Mapping (VAM),” WFP-UNICEF, Ethiopia, 2009. [3] M. Adhikary and R. Mazumder, “Economic Reforms and Productivity Change in Selected Indian Industries,” Avi- jeet Publication, New Delhi, 2009. [4] M. Adhikary and R. Sarkar, “Food Security System in India—A Close Look,” Lambert Academic Publishing, Saarbrücken, 2011. [5] C. Ramesh, “Impact of Trade Liberalization and Related Reforms on India’s Agricultural Sector, Rural Food Se- curity, Income and Poverty,” Policy Paper No. 19, Na- tional Center for Agricultural Economics and Policy, New Delhi, 2003. [6] DFID, “Reducing Poverty by Tackling Social Exclusion,” Department for International Development, London, 2005. [7] G. Nilabja and B. G. Khasnubish, “Looking for the An- swers to the Food Security Problem: India under Current Compulsions,” Research Paper No. 2006/123, World In- stitute for Development Economic Research, UNU, 2006. [8] J. R. Behrman, H. Alderman and J. Hoddinoll, “The Chal- lenge of Hunger and Malnutrition,” Hunger and Malnutri- tion 19th February 2004 Copenhagen Challenge Paper, Copenhagen University Press, Copenhagen, 2004. [9] P. Svedberg, “841 Million Undernaurished? On the Tyr- anny of Deriving a Number,” Seminar Paper No. 656, In- stitute for International Economics Studies, Stockholm, 1998. [10] P. Svedberg, “Undernutrition Overestimated,” Seminar Pa- per No. 693, Institute for International Economic Studies, Stockholm, 2001. [11] P. Svedberg, “Child Malnutrition in Shining India: A X-State Empirical Analysis,” 2006. http://www.bvsde.paho.org/bvsacd/cd56/svedberg-07090 6.pdf [12] N. Ramchandran, “Women and Food Security in South Asia: Current Issues and Emerging Concerns,” Research Paper No. 2006/131, World Institute for Development Economic Research, UNU, 2006. Copyright © 2012 SciRes. ME  M. ADHIKARY, K. SARKAR 779 [13] S. Amartya, “Social Exclusion: Concept, Application and Security,” Social Development Paper No. 1, Asian De- velopment Bank, Manila, 2000. [14] S. Abele, E. Twin and C. Legg, “Food Security in Eastern Africa and the Great Lakes,” Crop Crises Control Project (C3P), USAID, 2007. [15] S. Mahindra Dev, C. Ravi, B. Biswanathan, A. Gulati and S. Ramachander, “Economic Liberalization, Targeted Pro- grams and Household Food Security: A Case Study of India,” MTID Discussion Paper No. 68, International Food Policy Research Institute, Washington, 2004. Copyright © 2012 SciRes. ME |

