 Open Journal of Marine Science, 2012, 2, 167-176 http://dx.doi.org/10.4236/ojms.2012.24020 Published Online October 2012 (http://www.SciRP.org/journal/ojms) Effect of Salinity on Growth of Mussels, Mytilus edulis, with Special Reference to Great Belt (Denmark) Hans Ulrik Riisgård*, Line Bøttiger, Daniel Pleissner Marine Biological Research Centre, University of Southern Denmark, Kerteminde, Denmark Email: *hur@biology.sdu.dk Received August 14, 2012; revised September 14, 2012; accepted September 28, 2012 ABSTRACT The effects of salinities between 10 and 30 psu on the growth of blue mussels, Mytilus edulis, were studied in laboratory feeding experiments and compared to the growth of mussels suspended in net-bags in the brackish water Great Belt, Denmark. In the laboratory, 3 series of growth experiments were conducted: in Series #1, groups of mussels were ex- posed to 10, 15, 25 and 30 psu, in Series #2, two groups of mussels were exposed to 10 and 30 psu, respectively, for 15 days (first period) where upon the mussels were exposed to the reversed salinities for another 15 days (second period). In Series #3, two groups of mussels were initially exposed to 15 and 25 psu for 22 days whereupon the mussel groups were exposed to the reversed salinities for another 17 days. In the laboratory experiments there was a tendency towards reduced growth with decreasing salinity, reflected as reduced shell growth rate and decreasing weight specific growth rate with falling salinity. The shell growth rate was relatively low in the first feeding period compared to the second period, and mussels that were initially exposed to 10 psu, where the growth was low, exhibited fast growth when subse- quently exposed to 30 psu, and reversed when 30 psu mussels were exposed to 10 psu. The study showed that mussels are able to adjust growth at changing salinities, and the observed effect of salinity could partly be explained by a tempo- rary shell valve closure after a sudden change in salinity. The specific growth rate of mussels measured in laboratory experiments at salinities between 15 to 25 psu (4.2% to 4.8% d–1) were comparable to the growth of mussels in the field experiment (3.2% to 4.0% d–1) where the salinity varied between 24 and 13 psu during the growth period. Keywords: Mussels; Mytilus edulis; Salinity Effects; Growth Rates; Condition Index; Doubling Time 1. Introduction The blue mussel, Mytilus edulis, is a common member of the filter-feeding zoobenthos of coastal and estuarine intertidal areas where it may often encounter different salinities. Salinity is a key environmental factor that may directly influence the feeding behaviour and growth of mussels. Thus, constantly low salinities, frequency and amplitude of salinity changes, as well as the changing- rate of salinity will influence the behavioural response (siphon and shell valve closure), the filtration activity, actual growth rate, the maximal size, and the early deve- lopment and survival of mussels [1-9]. Due to low salinities in the inner Baltic Sea (6 to 8 psu in the northern Baltic proper) Mytilus edulis is dwarfed in this area [10-12], and in the northern Baltic Sea along the southern coast of Finland where the salinity decreases from 6.5 psu in the west to become only 3 psu in the east, M. edulis lives at the margin of its salinity tolerance, and here a marked decline in mussel size can be observed along the decreasing salinity gradient [8]. Davenport [3] studied the response of both sudden and slowly falling seawater salinities on M. edulis’ exhalant-siphon and shell valve closure. The behavioural response of the mussel was found to be dependent upon the rate of changes in salinity rather than being triggered by a fall to a critical salinity. At a changing rate of 16.75 psu·h–1 (which may be compared to 10 to 12 psu·h–1 in the Con- way estuary, UK, [13]), Davenport [3,4] found it likely that oxygen depletion in the mantle water may be de- layed “as a result of the mussels’ partial isolation re- sponse to falling salinity”. The effect of fluctuating salin- ity with a rate of 5.33 psu·h–1 (sinusoidal variation be- tween 0 and 32 psu during 6 h) on shell growth of small M. edulis has been studied by Almada-Villela [5] who found that the growth was “markedly depressed”. Further, Almada-Villela [5] studied the long term (38 d) effect on shell growth of different lowered salinities, and found that growth was significantly depressed at 6.4 and 16 psu, but not at 22.4 psu. Likewise, Hiebenthal et al. [14] re- cently found that M. edulis performed best at 25 psu and further that temperature effects may interact with salinity effects. However, acclimation to reduced salinities may take place [3,4,9,15-17], but due to shell valve closure *Corresponding author. C opyright © 2012 SciRes. OJMS 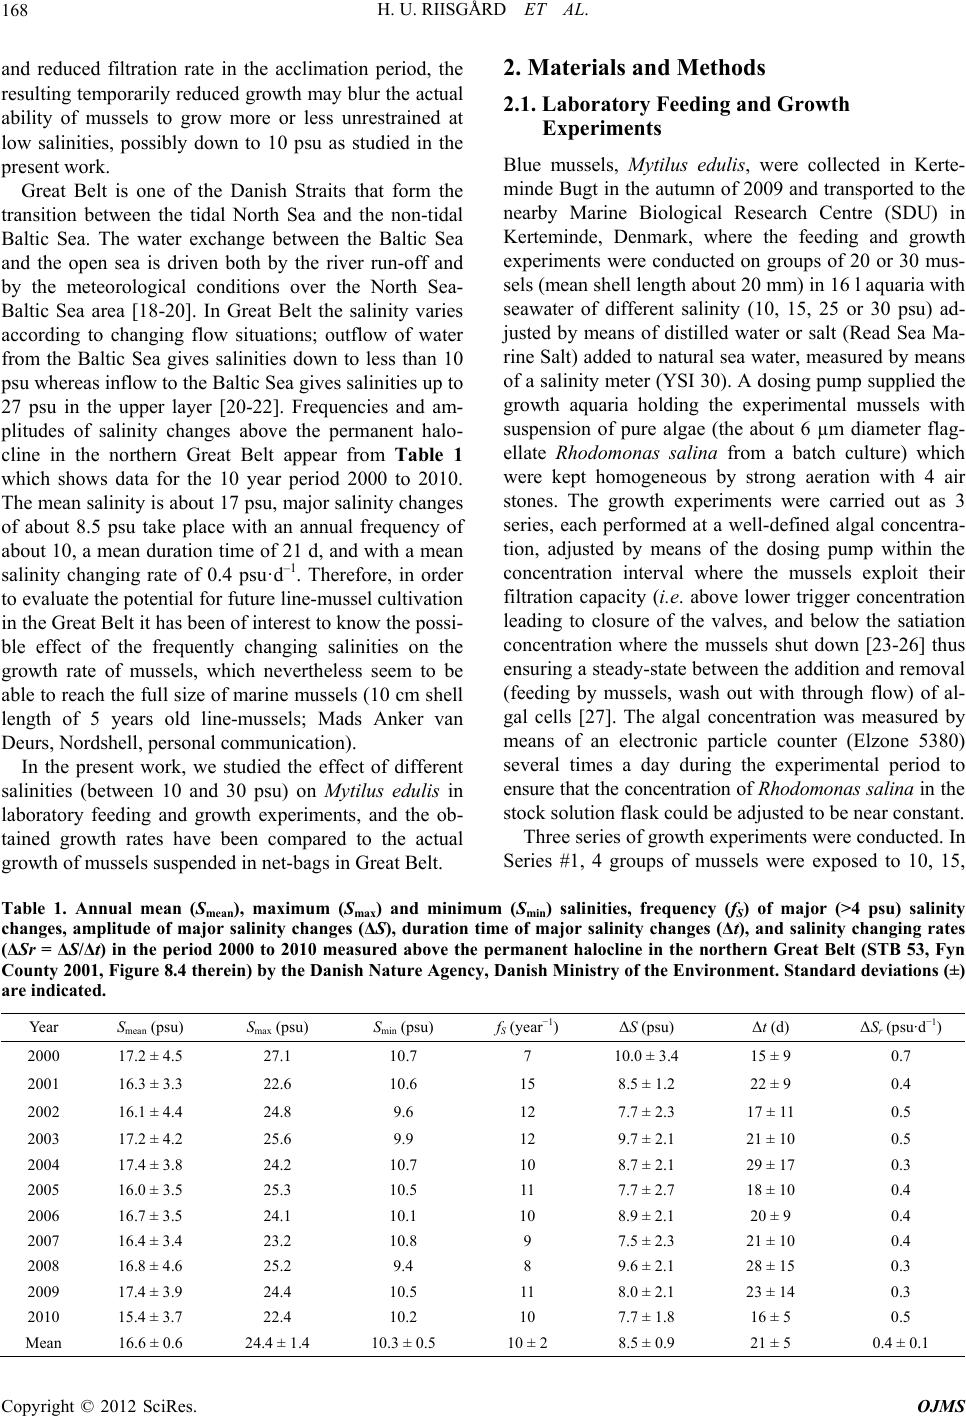 H. U. RIISGÅRD ET AL. 168 and reduced filtration rate in the acclimation period, the resulting temporarily reduced growth may blur the actual ability of mussels to grow more or less unrestrained at low salinities, possibly down to 10 psu as studied in the present work. Great Belt is one of the Danish Straits that form the transition between the tidal North Sea and the non-tidal Baltic Sea. The water exchange between the Baltic Sea and the open sea is driven both by the river run-off and by the meteorological conditions over the North Sea- Baltic Sea area [18-20]. In Great Belt the salinity varies according to changing flow situations; outflow of water from the Baltic Sea gives salinities down to less than 10 psu whereas inflow to the Baltic Sea gives salinities up to 27 psu in the upper layer [20-22]. Frequencies and am- plitudes of salinity changes above the permanent halo- cline in the northern Great Belt appear from Table 1 which shows data for the 10 year period 2000 to 2010. The mean salinity is about 17 psu, major salinity changes of about 8.5 psu take place with an annual frequency of about 10, a mean duration time of 21 d, and with a mean salinity changing rate of 0.4 psu·d–1. Therefore, in order to evaluate the potential for future line-mussel cultivation in the Great Belt it has been of interest to know the possi- ble effect of the frequently changing salinities on the growth rate of mussels, which nevertheless seem to be able to reach the full size of marine mussels (10 cm shell length of 5 years old line-mussels; Mads Anker van Deurs, Nordshell, personal communication). In the present work, we studied the effect of different salinities (between 10 and 30 psu) on Mytilus edulis in laboratory feeding and growth experiments, and the ob- tained growth rates have been compared to the actual growth of mussels suspended in net-bags in Great Belt. 2. Materials and Methods 2.1. Laboratory Feeding and Growth Experiments Blue mussels, Mytilus edulis, were collected in Kerte- minde Bugt in the autumn of 2009 and transported to the nearby Marine Biological Research Centre (SDU) in Kerteminde, Denmark, where the feeding and growth experiments were conducted on groups of 20 or 30 mus- sels (mean shell length about 20 mm) in 16 l aquaria with seawater of different salinity (10, 15, 25 or 30 psu) ad- justed by means of distilled water or salt (Read Sea Ma- rine Salt) added to natural sea water, measured by means of a salinity meter (YSI 30). A dosing pump supplied the growth aquaria holding the experimental mussels with suspension of pure algae (the about 6 µm diameter flag- ellate Rhodomonas salina from a batch culture) which were kept homogeneous by strong aeration with 4 air stones. The growth experiments were carried out as 3 series, each performed at a well-defined algal concentra- tion, adjusted by means of the dosing pump within the concentration interval where the mussels exploit their filtration capacity (i.e. above lower trigger concentration leading to closure of the valves, and below the satiation concentration where the mussels shut down [23-26] thus ensuring a steady-state between the addition and removal (feeding by mussels, wash out with through flow) of al- gal cells [27]. The algal concentration was measured by means of an electronic particle counter (Elzone 5380) several times a day during the experimental period to ensure that the concentration of Rhodomonas salina in the stock solution flask could be adjusted to be near constant. Three series of growth experiments were conducted. In Series #1, 4 groups of mussels were exposed to 10, 15, Table 1. Annual mean (Smean), maximum (Smax) and minimum (Smin) salinities, frequency (fS) of major (>4 psu) salinity changes, amplitude of major salinity changes (ΔS), duration time of major salinity changes (Δt), and salinity changing rates (ΔSr = ΔS/Δt) in the period 2000 to 2010 measured above the permanent halocline in the northern Great Belt (STB 53, Fyn County 2001, Figure 8.4 therein) by the Danish Nature Agency, Danish Ministry of the Environment. Standard deviations (±) are indicated. Year Smea n (psu) Smax (psu) Smin (psu) fS (year−1) ΔS (psu) Δt (d) ΔSr (psu·d−1) 2000 17.2 ± 4.5 27.1 10.7 7 10.0 ± 3.4 15 ± 9 0.7 2001 16.3 ± 3.3 22.6 10.6 15 8.5 ± 1.2 22 ± 9 0.4 2002 16.1 ± 4.4 24.8 9.6 12 7.7 ± 2.3 17 ± 11 0.5 2003 17.2 ± 4.2 25.6 9.9 12 9.7 ± 2.1 21 ± 10 0.5 2004 17.4 ± 3.8 24.2 10.7 10 8.7 ± 2.1 29 ± 17 0.3 2005 16.0 ± 3.5 25.3 10.5 11 7.7 ± 2.7 18 ± 10 0.4 2006 16.7 ± 3.5 24.1 10.1 10 8.9 ± 2.1 20 ± 9 0.4 2007 16.4 ± 3.4 23.2 10.8 9 7.5 ± 2.3 21 ± 10 0.4 2008 16.8 ± 4.6 25.2 9.4 8 9.6 ± 2.1 28 ± 15 0.3 2009 17.4 ± 3.9 24.4 10.5 11 8.0 ± 2.1 23 ± 14 0.3 2010 15.4 ± 3.7 22.4 10.2 10 7.7 ± 1.8 16 ± 5 0.5 Mean 16.6 ± 0.6 24.4 ± 1.4 10.3 ± 0.5 10 ± 2 8.5 ± 0.9 21 ± 5 0.4 ± 0.1 Copyright © 2012 SciRes. OJMS 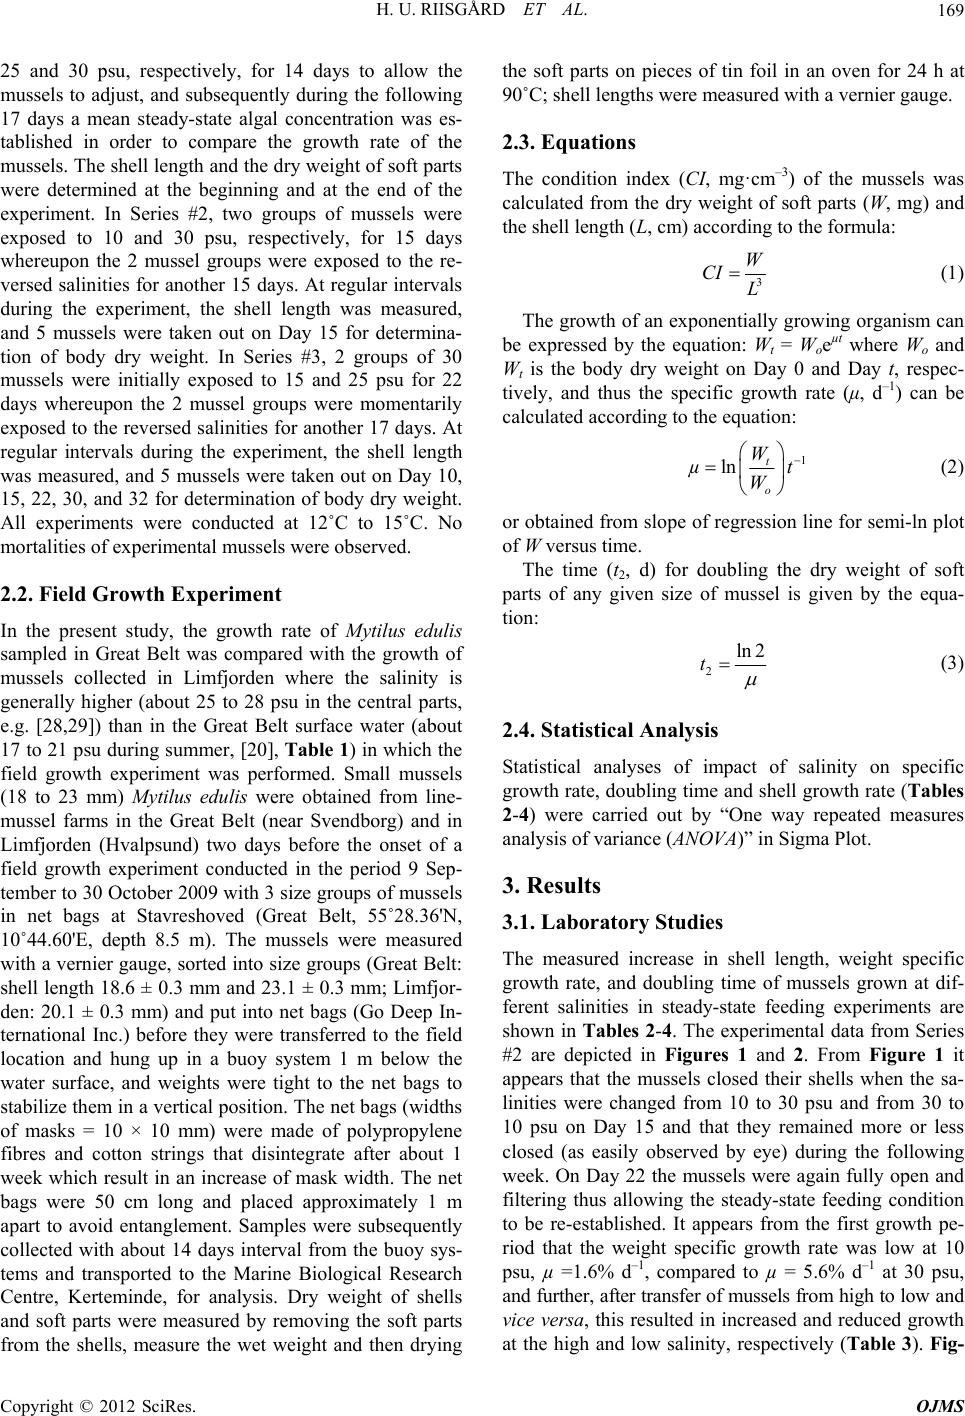 H. U. RIISGÅRD ET AL. 169 25 and 30 psu, respectively, for 14 days to allow the mussels to adjust, and subsequently during the following 17 days a mean steady-state algal concentration was es- tablished in order to compare the growth rate of the mussels. The shell length and the dry weight of soft parts were determined at the beginning and at the end of the experiment. In Series #2, two groups of mussels were exposed to 10 and 30 psu, respectively, for 15 days whereupon the 2 mussel groups were exposed to the re- versed salinities for another 15 days. At regular intervals during the experiment, the shell length was measured, and 5 mussels were taken out on Day 15 for determina- tion of body dry weight. In Series #3, 2 groups of 30 mussels were initially exposed to 15 and 25 psu for 22 days whereupon the 2 mussel groups were momentarily exposed to the reversed salinities for another 17 days. At regular intervals during the experiment, the shell length was measured, and 5 mussels were taken out on Day 10, 15, 22, 30, and 32 for determination of body dry weight. All experiments were conducted at 12˚C to 15˚C. No mortalities of experimental mussels were observed. 2.2. Field Growth Experiment In the present study, the growth rate of Mytilus edulis sampled in Great Belt was compared with the growth of mussels collected in Limfjorden where the salinity is generally higher (about 25 to 28 psu in the central parts, e.g. [28,29]) than in the Great Belt surface water (about 17 to 21 psu during summer, [20], Table 1) in which the field growth experiment was performed. Small mussels (18 to 23 mm) Mytilus edulis were obtained from line- mussel farms in the Great Belt (near Svendborg) and in Limfjorden (Hvalpsund) two days before the onset of a field growth experiment conducted in the period 9 Sep- tember to 30 October 2009 with 3 size groups of mussels in net bags at Stavreshoved (Great Belt, 55˚28.36'N, 10˚44.60'E, depth 8.5 m). The mussels were measured with a vernier gauge, sorted into size groups (Great Belt: shell length 18.6 ± 0.3 mm and 23.1 ± 0.3 mm; Limfjor- den: 20.1 ± 0.3 mm) and put into net bags (Go Deep In- ternational Inc.) before they were transferred to the field location and hung up in a buoy system 1 m below the water surface, and weights were tight to the net bags to stabilize them in a vertical position. The net bags (widths of masks = 10 × 10 mm) were made of polypropylene fibres and cotton strings that disintegrate after about 1 week which result in an increase of mask width. The net bags were 50 cm long and placed approximately 1 m apart to avoid entanglement. Samples were subsequently collected with about 14 days interval from the buoy sys- tems and transported to the Marine Biological Research Centre, Kerteminde, for analysis. Dry weight of shells and soft parts were measured by removing the soft parts from the shells, measure the wet weight and then drying the soft parts on pieces of tin foil in an oven for 24 h at 90˚C; shell lengths were measured with a vernier gauge. 2.3. Equations The condition index (CI, mg·cm–3) of the mussels was calculated from the dry weight of soft parts (W, mg) and the shell length (L, cm) according to the formula: 3 W CI L (1) The growth of an exponentially growing organism can be expressed by the equation: Wt = Woeµt where Wo and Wt is the body dry weight on Day 0 and Day t, respec- tively, and thus the specific growth rate (μ, d–1) can be calculated according to the equation: 1 ln t o W µ W t (2) or obtained from slope of regression line for semi-ln plot of W versus time. The time (t2, d) for doubling the dry weight of soft parts of any given size of mussel is given by the equa- tion: 2 ln 2 t (3) 2.4. Statistical Analysis Statistical analyses of impact of salinity on specific growth rate, doubling time and shell growth rate (Tables 2-4) were carried out by “One way repeated measures analysis of variance (ANOVA)” in Sigma Plot. 3. Results 3.1. Laboratory Studies The measured increase in shell length, weight specific growth rate, and doubling time of mussels grown at dif- ferent salinities in steady-state feeding experiments are shown in Tables 2-4. The experimental data from Series #2 are depicted in Figures 1 and 2. From Figure 1 it appears that the mussels closed their shells when the sa- linities were changed from 10 to 30 psu and from 30 to 10 psu on Day 15 and that they remained more or less closed (as easily observed by eye) during the following week. On Day 22 the mussels were again fully open and filtering thus allowing the steady-state feeding condition to be re-established. It appears from the first growth pe- riod that the weight specific growth rate was low at 10 psu, µ =1.6% d–1, compared to µ = 5.6% d–1 at 30 psu, and further, after transfer of mussels from high to low and vice versa, this resulted in increased and reduced growth at the high and low salinity, respectively (Table 3). Fig- Copyright © 2012 SciRes. OJMS 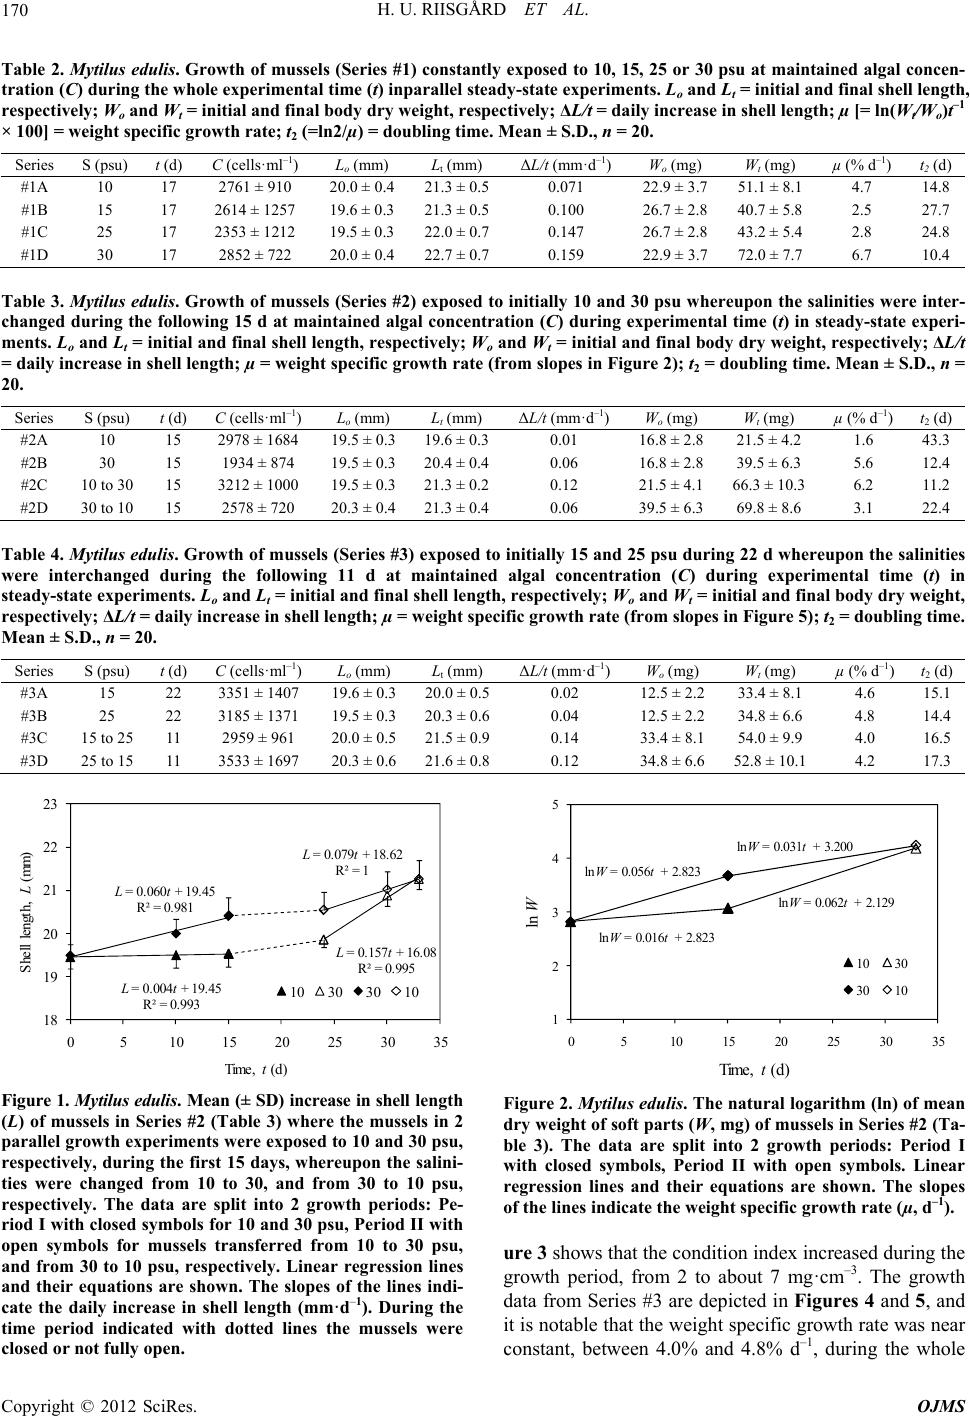 H. U. RIISGÅRD ET AL. 170 Table 2. Mytilus edulis. Growth of mussels (Series #1) constantly exposed to 10, 15, 25 or 30 psu at maintained algal concen- tration (C) during the whole experimental time (t) inparallel steady-state experiments. Lo and Lt = initial and final shell length, respectively; Wo and Wt = initial and final body dry weight, respectively; ΔL/t = daily increase in shell length; µ [= ln(Wt/Wo)t–1 × 100] = weight specific growth rate; t2 (=ln2/µ) = doubling time. Mean ± S.D., n = 20. Series S (psu) t (d) C (cells·ml–1) Lo (mm) Lt (mm) ΔL/t (mm·d–1) Wo (mg) Wt (mg) µ (% d–1)t2 (d) #1A 10 17 2761 ± 910 20.0 ± 0.421.3 ± 0.50.071 22.9 ± 3.751.1 ± 8.1 4.7 14.8 #1B 15 17 2614 ± 1257 19.6 ± 0.321.3 ± 0.50.100 26.7 ± 2.840.7 ± 5.8 2.5 27.7 #1C 25 17 2353 ± 1212 19.5 ± 0.322.0 ± 0.70.147 26.7 ± 2.843.2 ± 5.4 2.8 24.8 #1D 30 17 2852 ± 722 20.0 ± 0.422.7 ± 0.70.159 22.9 ± 3.772.0 ± 7.7 6.7 10.4 Table 3. Mytilus edulis. Growth of mussels (Series #2) exposed to initially 10 and 30 psu whereupon the salinities were inter- changed during the following 15 d at maintained algal concentration (C) during experimental time (t) in steady-state experi- ments. Lo and Lt = initial and final shell length, respectively; Wo and Wt = initial and final body dry weight, respectively; ΔL/t = daily increase in shell length; µ = weight specific growth rate (from slopes in Figure 2); t2 = doubling time. Mean ± S.D., n = 20. Series S (psu) t (d) C (cells·ml–1) Lo (mm) Lt (mm) ΔL/t (mm·d–1)Wo (mg) Wt (mg) µ (% d–1)t2 (d) #2A 10 15 2978 ± 1684 19.5 ± 0.319.6 ± 0.30.01 16.8 ± 2.821.5 ± 4.2 1.6 43.3 #2B 30 15 1934 ± 874 19.5 ± 0.320.4 ± 0.40.06 16.8 ± 2.839.5 ± 6.3 5.6 12.4 #2C 10 to 30 15 3212 ± 1000 19.5 ± 0.321.3 ± 0.20.12 21.5 ± 4.166.3 ± 10.3 6.2 11.2 #2D 30 to 10 15 2578 ± 720 20.3 ± 0.421.3 ± 0.40.06 39.5 ± 6.369.8 ± 8.6 3.1 22.4 Table 4. Mytilus edulis. Growth of mussels (Series #3) exposed to initially 15 and 25 psu during 22 d whereupon the salinities were interchanged during the following 11 d at maintained algal concentration (C) during experimental time (t) in steady-state experiments. Lo and Lt = initial and final shell length, respectively; Wo and Wt = initial and final body dry weight, respectively; ΔL/t = daily increase in shell length; µ = weight specific growth rate (from slopes in Figure 5); t2 = doubling time. Mean ± S.D., n = 20. Series S (psu) t (d) C (cells·ml–1) Lo (mm) Lt (mm) ΔL/t (mm·d–1)Wo (mg) Wt (mg) µ (% d–1)t2 (d) #3A 15 22 3351 ± 1407 19.6 ± 0.320.0 ± 0.50.02 12.5 ± 2.233.4 ± 8.1 4.6 15.1 #3B 25 22 3185 ± 1371 19.5 ± 0.320.3 ± 0.60.04 12.5 ± 2.234.8 ± 6.6 4.8 14.4 #3C 15 to 25 11 2959 ± 961 20.0 ± 0.521.5 ± 0.90.14 33.4 ± 8.154.0 ± 9.9 4.0 16.5 #3D 25 to 15 11 3533 ± 1697 20.3 ± 0.621.6 ± 0.80.12 34.8 ± 6.652.8 ± 10.1 4.2 17.3 L= 0.004t+ 19.45 R² = 0.993 L= 0.157t+ 16.08 R² = 0.995 L= 0.060t+ 19.45 R² = 0.981 L= 0.079t+ 18.62 R² = 1 18 19 20 21 22 23 0510 15 20 25 30 35 Shell length, L( mm) Time , t(d) 10 30 30 10 Figure 1. Mytilus edulis. Mean (± SD) increase in shell length (L) of mussels in Series #2 (Table 3) where the mussels in 2 parallel growth experiments were exposed to 10 and 30 psu, respectively, during the first 15 days, whereupon the salini- ties were changed from 10 to 30, and from 30 to 10 psu, respectively. The data are split into 2 growth periods: Pe- riod I with closed symbols for 10 and 30 psu, Period II with open symbols for mussels transferred from 10 to 30 psu, and from 30 to 10 psu, respectively. Linear regression lines and their equations are shown. The slopes of the lines indi- cate the daily increase in shell length (mm·d–1). During the time period indicated with dotted lines the mussels were closed or not fully open. lnW= 0.016t+ 2.823 lnW= 0.062t+ 2.129 lnW= 0.056t+ 2.823 lnW= 0.031t+ 3.200 1 2 3 4 5 0510 15 20 25 30 35 ln W Time , t(d) 10 30 30 10 Figure 2. Mytilus edulis. The natural logarithm (ln) of mean dry weight of soft parts (W, mg) of mussels in Series #2 (Ta- ble 3). The data are split into 2 growth periods: Period I with closed symbols, Period II with open symbols. Linear regression lines and their equations are shown. The slopes of the lines indicate the weight specific growth rate (µ, d–1). ure 3 shows that the condition index increased during the growth period, from 2 to about 7 mg·cm–3. The growth data from Series #3 are depicted in Figures 4 and 5, and it is notable that the weight specific growth rate was near constant, between 4.0% and 4.8% d–1, during the whole Copyright © 2012 SciRes. OJMS 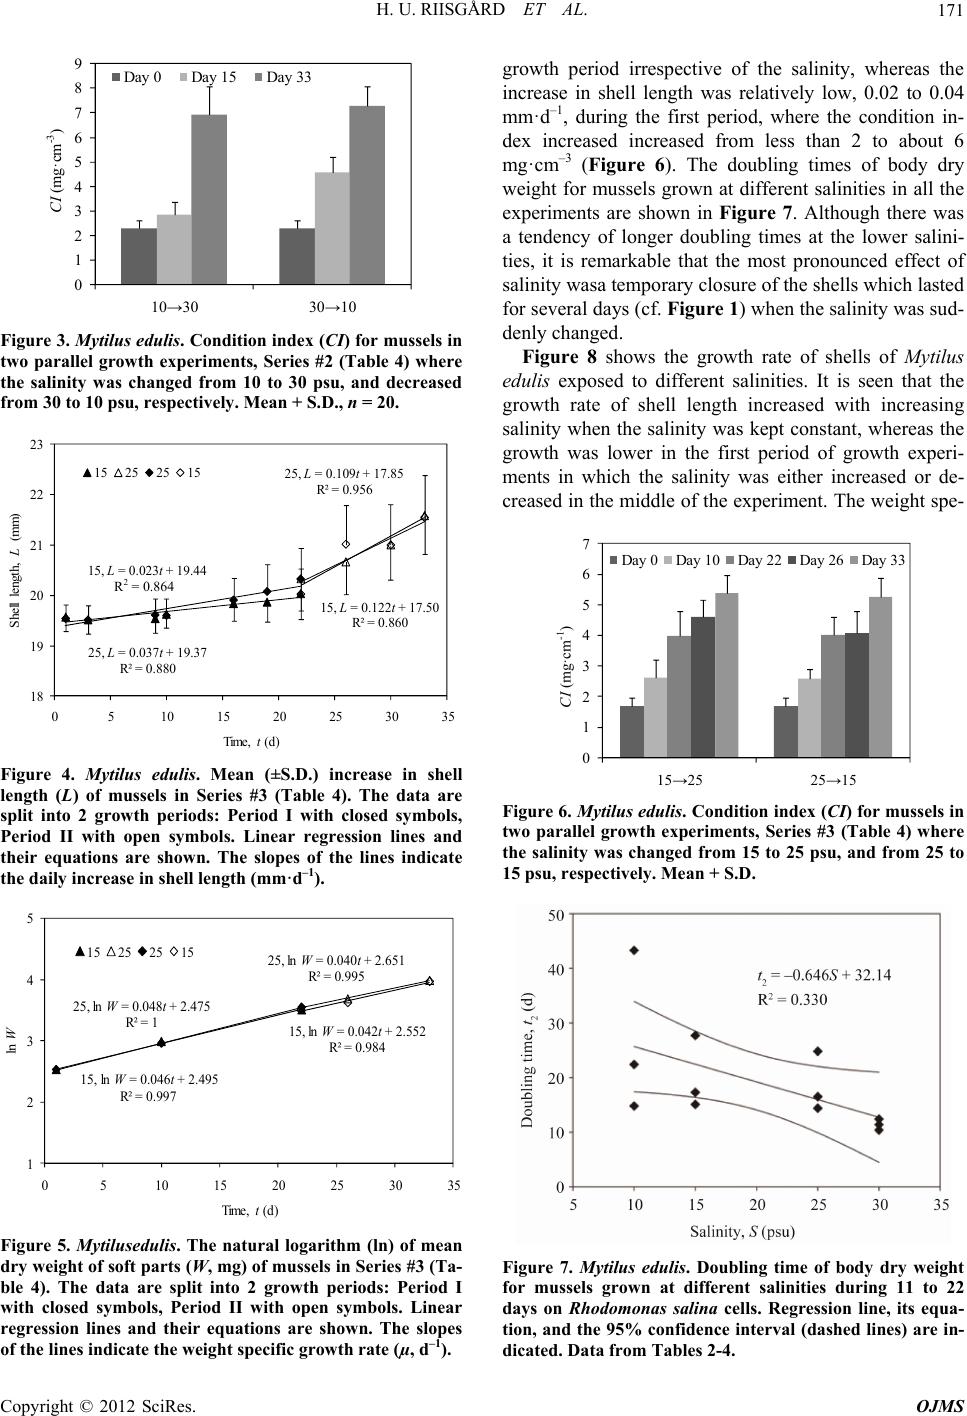 H. U. RIISGÅRD ET AL. 171 0 1 2 3 4 5 6 7 8 9 10→30 30→10 CI (mg cm -3 ) Day 0Day 15Day 33 CI (mg·cm -3 ) Figure 3. Mytilus edulis. Condition index (CI) for mussels in two parallel growth experiments, Series #2 (Table 4) where the salinity was changed from 10 to 30 psu, and decreased from 30 to 10 psu, respectively. Mean + S.D., n = 20. 15, L= 0.023t+ 19.44 R² = 0,864 25, L= 0.109t+ 17.85 R² = 0.956 25, L= 0.037t+ 19.37 R² = 0.880 15, L= 0.122t+ 17.50 R² = 0.860 18 19 20 21 22 23 0510 15 20 25 30 35 Shell length, L(mm) Time, t(d) 15 25 25 15 R 2 = 0.864 Figure 4. Mytilus edulis. Mean (±S.D.) increase in shell length (L) of mussels in Series #3 (Table 4). The data are split into 2 growth periods: Period I with closed symbols, Period II with open symbols. Linear regression lines and their equations are shown. The slopes of the lines indicate the daily increase in shell length (mm·d–1). 15, ln W= 0.046t+ 2.495 R² = 0.997 25, ln W= 0.040t+ 2.651 R² = 0.995 25, ln W= 0.048t+ 2.475 R² = 115, ln W= 0.042t+ 2.552 R² = 0.984 1 2 3 4 5 0510 15 20 25 30 35 ln W Time , t(d) 15 25 25 15 Figure 5. Mytilusedulis. The natural logarithm (ln) of mean dry weight of soft parts (W, mg) of mussels in Series #3 (Ta- ble 4). The data are split into 2 growth periods: Period I with closed symbols, Period II with open symbols. Linear regression lines and their equations are shown. The slopes of the lines indicate the weight specific growth rate (µ, d–1). growth period irrespective of the salinity, whereas the increase in shell length was relatively low, 0.02 to 0.04 mm·d–1, during the first period, where the condition in- dex increased increased from less than 2 to about 6 mg· c m–3 (Figure 6). The doubling times of body dry weight for mussels grown at different salinities in all the experiments are shown in Figure 7. Although there was a tendency of longer doubling times at the lower salini- ties, it is remarkable that the most pronounced effect of salinity wasa temporary closure of the shells which lasted for several days (cf. Figure 1) when the salinity was sud- denly changed. Figure 8 shows the growth rate of shells of Mytilus edulis exposed to different salinities. It is seen that the growth rate of shell length increased with increasing salinity when the salinity was kept constant, whereas the growth was lower in the first period of growth experi- ments in which the salinity was either increased or de- creased in the middle of the experiment. The weight spe- 0 1 2 3 4 5 6 7 15→25 25→15 CI (mg cm -1 ) Day 0Day 10Day 22Day 26Day 33 CI (mg·cm -1 ) Figure 6. Mytilus edulis. Condition index (CI) for mussels in two parallel growth experiments, Series #3 (Table 4) where the salinity was changed from 15 to 25 psu, and from 25 to 15 psu, respectively. Mean + S.D. Figure 7. Mytilus edulis. Doubling time of body dry weight for mussels grown at different salinities during 11 to 22 days on Rhodomonas salina cells. Regression line, its equa- tion, and the 95% confidence interval (dashed lines) are in- dicated. Data from Tables 2-4. Copyright © 2012 SciRes. OJMS 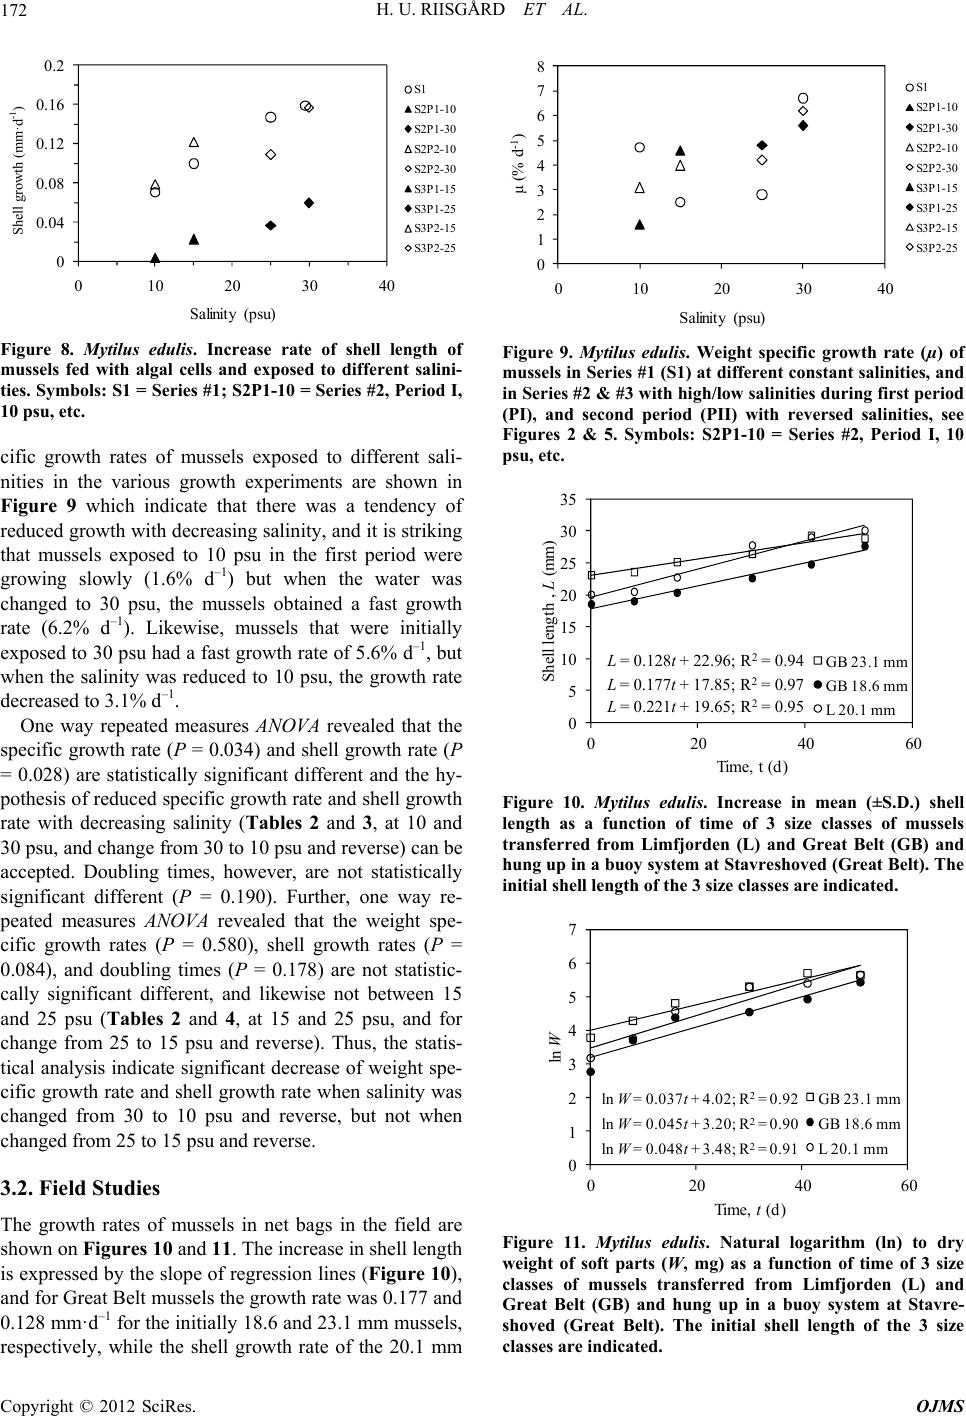 H. U. RIISGÅRD ET AL. 172 0 0.04 0.08 0.12 0.16 0.2 0 10203040 Shell growth (mm d -1 ) Salinity (psu) S1 S2 P1 -10 S2 P1 -30 S2 P2 -10 S2 P2 -30 S3 P1 -15 S3 P1 -25 S3 P2 -15 S3 P2 -25 Shell growth (mm·d -1 ) Figure 8. Mytilus edulis. Increase rate of shell length of mussels fed with algal cells and exposed to different salini- ties. Symbols: S1 = Series #1; S2P1-10 = Series #2, Period I, 10 psu, etc. cific growth rates of mussels exposed to different sali- nities in the various growth experiments are shown in Figure 9 which indicate that there was a tendency of reduced growth with decreasing salinity, and it is striking that mussels exposed to 10 psu in the first period were growing slowly (1.6% d–1) but when the water was changed to 30 psu, the mussels obtained a fast growth rate (6.2% d–1). Likewise, mussels that were initially exposed to 30 psu had a fast growth rate of 5.6% d–1, but when the salinity was reduced to 10 psu, the growth rate decreased to 3.1% d–1. One way repeated measures ANOVA revealed that the specific growth rate (P = 0.034) and shell growth rate (P = 0.028) are statistically significant different and the hy- pothesis of reduced specific growth rate and shell growth rate with decreasing salinity (Tables 2 and 3, at 10 and 30 psu, and change from 30 to 10 psu and reverse) can be accepted. Doubling times, however, are not statistically significant different (P = 0.190). Further, one way re- peated measures ANOVA revealed that the weight spe- cific growth rates (P = 0.580), shell growth rates (P = 0.084), and doubling times (P = 0.178) are not statistic- cally significant different, and likewise not between 15 and 25 psu (Tables 2 and 4, at 15 and 25 psu, and for change from 25 to 15 psu and reverse). Thus, the statis- tical analysis indicate significant decrease of weight spe- cific growth rate and shell growth rate when salinity was changed from 30 to 10 psu and reverse, but not when changed from 25 to 15 psu and reverse. 3.2. Field Studies The growth rates of mussels in net bags in the field are shown on Figures 10 and 11. The increase in shell length is expressed by the slope of regression lines (Figure 10), and for Great Belt mussels the growth rate was 0.177 and 0.128 mm·d–1 for the initially 18.6 and 23.1 mm mussels, respectively, while the shell growth rate of the 20.1 mm 0 1 2 3 4 5 6 7 8 0 10203040 µ (% d -1 ) Salinity (psu) S1 S2P1 -10 S2P1 -30 S2P2 -10 S2P2 -30 S3P1 -15 S3P1 -25 S3P2 -15 S3P2 -25 Figure 9. Mytilus edulis. Weight specific growth rate (µ) of mussels in Series #1 (S1) at different constant salinities, and in Series #2 & #3 with high/low salinities during first period (PI), and second period (PII) with reversed salinities, see Figures 2 & 5. Symbols: S2P1-10 = Series #2, Period I, 10 psu, etc. L= 0.128t+ 22.96; R 2 = 0.94 L = 0.177t+ 17.85; R 2 = 0.97 L= 0.221t+ 19.65; R 2 = 0.95 0 5 10 15 20 25 30 35 0 20406 Shell length , L(mm) Time, t (d) 0 GB 23.1 mm GB 18.6 mm L 20.1 mm Figure 10. Mytilus edulis. Increase in mean (±S.D.) shell length as a function of time of 3 size classes of mussels transferred from Limfjorden (L) and Great Belt (GB) and hung up in a buoy system at Stavreshoved (Great Belt). The initial shell length of the 3 size classes are indicated. ln W = 0.037t + 4.02; R2= 0.92 ln W = 0.045t+ 3.20; R2= 0.90 ln W= 0.048t+ 3.48; R2= 0.91 0 1 2 3 4 5 6 7 0 20406 ln W Time, t(d) 0 GB 23.1 mm GB 18.6 mm L 20.1 mm Figure 11. Mytilus edulis. Natural logarithm (ln) to dry weight of soft parts (W, mg) as a function of time of 3 size classes of mussels transferred from Limfjorden (L) and Great Belt (GB) and hung up in a buoy system at Stavre- shoved (Great Belt). The initial shell length of the 3 size classes are indicated. Copyright © 2012 SciRes. OJMS  H. U. RIISGÅRD ET AL. 173 mussels from Limfjorden was 0.221 mm·d–1. Likewise, the weight specific growth rates are expressed by the slope of regression lines (Figure 11). Thus, the weight specific growth rate of 20.1 mm mussels from Limfjor- den was 4.8% d–1 which may be compared with 4.5 and 3.7% d–1 for 18.6 and 23.1 mm Great Belt mussels, re- spectively. From Figure 12 it appears that the initial condition index was low, <3 mg·cm–3, but rapidly in- creased during especially the first 30 days to become high, about 9 to 12 mg·cm–3. The mussels from Limfjor- den had the shortest body-dry weight doubling time of t2 = (ln2/0.048 =) 14.4 d, compared to 15.4 and 18.7 d for the 18.6 and 23.1 mm Great Belt mussels, respectively. Clearly, the mussels from Limfjorden were not impeded by being transferred to the lower saline Great Belt. 4. Discussion In all the laboratory mussel-growth experiments there was a tendency towards reduced growth with decreasing salinity, reflected as increasing doubling time of the body dry weight (Figure 7), reduced shell growth (Figure 8), and as decreasing weight specific growth rate with fal- ling salinity (Figure 9). However, it is notable that the shell growth rate was relatively low in the first feeding period compared to the second period (Figure 8). This phenomenon is likely to be due physiological and be- havioural adaptation correlated with shell valve opening- closing [1,3,4,16], possibly combined with an increasing condition index during the experiments (Figures 3 and 6). It is also striking that mussels initially exposed to 10 psu where the growth was low (1.6% d–1) exhibited a faster growth when exposed to 30 psu, and reversed, when 30 psu mussels were exposed to 10 psu (Figure 2, Table 3). The cumulative shell length increase of small (15 mm) 0 2 4 6 8 10 12 14 16 0816 30 41 51 CI (mg cm -3 ) Time (d) L 20.1 mmGB 18.6 mm GB 23.1 mm C (mg·cm -3 ) Figure 12. Mytilus edulis. Condition index (CI, mean + S.D.) as a function of time of 3 size classes of mussels transferred from Limfjorden (L) and Great Belt (GB) and hung up in a buoy system at Stavreshoved (Great Belt). The initial shell lengths of the 3 size classes are indicated. Mytilus edulis at different constant lowered salinities, be- tween 12.8 and 32 psu, was studied in a long-term ex- periment by Almada-Villela [5] using a laser technique. It was found that the growth was initially delayed at 12.8 and 16 psu but recovered eventually, and mussels in the range 19.2 to 32 psu grew at similar rates. The delay of growth was overcome rapidly for mussels in 16 psu whereas those in 12.8 psu “suffered severely from low salinity” (i.e. shell closure for 8 to 9 days, only 50% of the mussels survived more than 12 days). It was sug- gested by Almada-Villela [5] that acclimation of shell growth does take place and that the threshold for shell growth is close to 12.8 psu. Further, Hiebenthal et al. [14] found that effects of salinity on both growth and mortal- ity may be influenced by temperature. In the present work no mortalities were observed at 10 psu where a considerable shell growth was observed in Series #1 and Series #S2P2-10 (Figure 8). However, the present study confirms that mussels are able to adjust shell growth at reduced salinities, and the observed tolerance of the brackish water Great Belt mussels to lower salinities than experienced by Almada-Villela [5] may be explained by the high saline (32 psu) mussels used by the last-men- tioned [7,30,31]. The growth rate and maximum size of M. edulis is much lower in the Baltic Sea (7 psu) than in the North Sea (28 psu), and reciprocally transplanted mussels were found by Kautsky et al. [7] to grow at rates similar to those of native mussels at each site, and there- fore the authors suggested that the observed variation should be explained by “physiological differences due to environmental salinity”. The mortality was very high (>90%) among North Sea mussels transferred to the Bal- tic Sea, whereas the survival of Baltic mussels trans- ferred to the North Sea was very high, and therefore Kautsky et al. [7] suggested that the different survival rates may have “genetic causes”, and differences be- tween Baltic and North Sea mussels may thus be due to “differential selection” as suggested by Tedengren et al. [30] and Johannesson et al. [31]. The weight specific growth rates measured in the la- boratory growth studies on Mytilus edulis exposed to sa- linities between 15 to 25 psu (Figure 5) are comparable to the growth rates obtained in the field growth experi- ment (Figure 11). Thus, the doubling times of body dry weight in the laboratory experiments varied between 10.4 and 24.8 d (Tables 2-4), which may be compared with 14.4 to 18.7 d for mussels in the field, and this inspires confidence to both relevance and credibility of the labo- ratory growth experiments. The chlorophyll a concentration in Great Belt is rou- tinely monitored by the Danish Nature Agency, Danish Ministry of the Environment. The mean (±S.D.) concen- tration measured during the field-growth period in the northern Great Belt (55˚30.46'N, 10˚51.72'E, 12 km NE Copyright © 2012 SciRes. OJMS  H. U. RIISGÅRD ET AL. 174 of Stavreshoved) was 3.0 ± 1.1 µg·chla·l–1 which is equi- valent to (3.0/1.251 × 103 =) 2400 Rhodomonas salina cells·ml–1 [32]. This value is fairly close to the mean al- gal concentration used in the laboratory feeding experi- ments, and this indicates that the observed effects of sa- linity on growth may also apply for mussels in the field. Here, it should be mentioned that available monitoring data on the biomass of autotrophic and heterotrophic plankton in the Great Belt has recently been examined by Riisgård et al. [33] who found that the heterotrophic biomass generally accounts for less than 10% of the total pelagic biomass, and that it therefore can be concluded that the autrotrophic plankton, which can be quantified by measurement of the chla concentration, generally dominates the pelagic microplankton in the Great Belt. In the actual field-growth period for mussels, the salinity varied between 24.4 and 13.0 psu (Figure 13), and the salinity decreased from 23.3 to 13.3 psu in the period 13 to 26 October, thus resulting in a decrease of ([23.3 – 13.3]/13 =) 0.8 psu·d–1. This salinity changing rate may be compared with the values listed in Table 1 from which it appears that the typical salinity changing 0 3 6 9 12 15 18 21 24 27 30 Temperature / Salinity / Chl a S T C 0.0 3.0 6.0 9.0 12.0 15.0 18.0 21.0 24.0 27.0 30.0 Temperature / Salinity / Chl a S T C A B Figure 13. Salinity (S, psu), temperature (T, ˚C), and chlo- rophyll a (C, µg·l–1) in the northern Great Belt (STB53, close to the experimental net-bag mussel growth site) (A) in 2009, and (B) during the mussel growth period (marked by broken vertical lines). Based on data provided by the Dan- ish Nature Agency, Danish Ministry of the Environment. rate in the Great Belt is about 0.4 psu·d–1 and that major salinity changes take place about10 times per year with at duration time of about 21 d. The shell-closure effect observed in the laboratory when the salinity was suddenly changed and which lasted for several days (Figure 1) does not represent the normal environmental conditions in the Great Belt (Table 1, Figure 13) where the salinity-changing rate is relatively low and where Mytilus edulis may therefore be able to adjust (acclimate) to the occasionally high (up to about 25 psu) and low salinities (down to about 10 psu) in such a way that the growth rate remains rather unaffected. More studies on the effect of Great Belt-relevant salinity changing rates on feeding behaviour as well as growth experiments with mussels that are well-adjusted to low salinities (i.e. fully open valves and exhalant siphon, cf. [3]) are needed to separate the acute shell-closing effect on food uptake and growth from the possible physio- logical effect of low salinities on the metabolism and excretion of nitrogen [11,34,35] resulting in reduced growth. 5. Acknowledgements This work formed part of the MarBioShell project sup- ported by the Danish Agency for Science, Technology and Innovation for the period January 2008 to December 2012. Thanks are due to the Danish Nature Agency, Danish Ministry of the Environment, for providing moni- toring data from the Great Belt, and to Kim Lundgreen for comments on the manuscript. REFERENCES [1] B. Bøhle, “Effects of Adaptation to Reduced Salinity on filtration Activity and Growth of Mussels (Mytilusedulis L.),” Journal of Experimental Marine Biology and Ecol- ogy, Vol. 10, No. 1, 1972, pp. 41-47. doi:10.1016/0022-0981(72)90091-3 [2] B. F. Theisen, “Allozyme Clines and Evidence of Strong Selection in Three Loci in Mytilusedulis L. (Bivalva) from Danish Waters,” Ophelia, Vol. 17, No. 1, 1978, pp. 135-142. doi:10.1080/00785326.1978.10425477 [3] J. Davenport, “The Isolation Response of Mussels (Myti- lusedulis L.) Exposed to Falling Seawater Concentra- tions,” Journal of the Marine Biological Association of the United Kingdom, Vol. 59, No. 1, 1979, pp. 123-132. doi:10.1017/S0025315400046221 [4] J. Davenport, “Is Mytilus edulis a Short Term Osmoregu- lator?” Comparative Biochemistry and Physiology, Vol. 64A, No. 1, 1979, pp. 91-95. doi:10.1016/0300-9629(79)90436-5 [5] P. C. Almada-Villela, “The Effects of Reduced Salinity on the Shell Growth of Small Mytilus edulis,” Journal of the Marine Biological Association of the United Kingdom, Vol. 64, No. 1, 1984, pp. 71-182. Copyright © 2012 SciRes. OJMS  H. U. RIISGÅRD ET AL. 175 doi:10.1017/S0025315400059713 [6] L. L. Gruffydd, D. R. Huxley and D. J. Crisp, “The Re- duction in Growth of Mytilus edulis in Fluctuating Salin- ity Regimes Measured Using Laser Diffraction Patterns and the Exaggeration of This Effect by Using Tap Water as the Diluting Medium,” Journal of the Marine Biologi- cal Association of the United Kingdom, Vol. 64, No. 2, 1984, pp. 401-409. doi:10.1017/S0025315400030071 [7] N. Kautsky, K. Johannesson and M. Tedengren, “Geno- typic and Phenotypic Differences between Baltic and North Sea Populations of Mytilus edulis Evaluated th- rough Reciprocal Transplantations. I. Growth and Mor- phology,” Marine Ecology Progress Series, Vol. 59, 1990, pp. 203-210. doi:10.3354/meps059203 [8] M. Westerbom, M. Kilpi and O. Mustonen, “Blue Mus- sels, Mytilusedulis, at the Edge of the Range: Population Structure, Growth and Biomass along a Salinity Gradient in the North-Eastern Baltic Sea,” Marine Biology, Vol. 140, No. 5, 2002, pp. 991-999. doi:10.1007/s00227-001-0765-6 [9] J.-W. Qiu, R. Tremblay and E. Bourget, “Ontogenetic Changes in Hyposaline Tolerance in the Mussels Mytilus edulis and M. trossulus: Implications for Distribution,” Marine Ecology Progress Series, Vol. 228, 2002, pp. 143-152. doi:10.3354/meps228143 [10] N. Kautsky, “Growth and Size Structure in a Baltic Myti- lus edulis Population,” Marine Biology, Vol. 68, No. 2, 1982, pp. 117-133. doi:10.1007/BF00397599 [11] M. Tedengren and N. Kautsky, “Comparative Study of the Physiology and Its Probable Effect on Size in Blue Mussels (Mytilus edulis L.) from the North Sea and the Northern Baltic Proper,” Ophelia, Vol. 25, No. 3, 1986, pp. 147-155. doi:10.1080/00785326.1986.10429746 [12] I. Vuorinen, A. E. Antsulevich and N. V. Maximovich, “Spatial Distribution and Growth of the Common Mussel Mytilus edulis L. in the Archipelago of SW-Finland, Northern Baltic Sea,” Boreal Environment Research, Vol. 7, 2002, pp. 41-52. [13] P. J. Dare and D. B. Edwards, “Seasonal Changes in Flesh Weight and Biochemical Composition of Mussels (Mytilusedulis L.) in Conwy Estuary, North Wales,” Journal of Experimental Marine Biology and Ecology, Vol. 18, No. 2, 1975, pp. 89-97. doi:10.1016/0022-0981(75)90066-0 [14] C. Hiebenthal, E. E. Philipp, A. Eisenhauer and M. Wahl, “Interactive Effects of Temperature and Salinity on Shell Formation and General Condition in Baltic Sea Mytilus edulis and Arctica islandica,” Aquatic Biology, Vol. 14, 2012, pp. 289-298. doi:10.3354/ab00405 [15] S. E. Shumway and P. A. Gabbot, “The Effect of Fluctu- ating Salinity on the Concentrations of Free Amino Acids and Ninhydrin-Positive Substances in the Adductor Mus- cles of Eight Species of Bivalve Molluscs,” Journal of Experimental Marine Biologyand Ecology, Vol. 29, No. 2, 1977, pp. 131-150. doi:10.1016/0022-0981(77)90044-2 [16] C. J. Costa and A. W. Pritchard, “The Response of Myti- lus edulis to Short Duration Hypoosmotic Stress,” Com- parative Biochemistry and Physiology, Vol. 61A, No. 1, 1978, pp. 149-155. doi:10.1016/0300-9629(78)90292-X [17] I. D. Marsden, “Effects of Reduced Salinity and Seston Availability on Growth of the New Zealand Little-Neck Clam Austrovenus stutchburi,” Marine Ecology Progress Series, Vol. 266, 2004, pp. 157-171. doi:10.3354/meps266157 [18] G. Kullenberg and T. S. Jacobsen, “The Baltic Sea: An Outline of Its Physical Oceanography,” Marine Pollution Bulletin, Vol. 12, No. 6, 1981, pp. 183-186. doi:10.1016/0025-326X(81)90168-5 [19] J. S. Møller, “Water Masses, Stratification and Circula- tion,” In: B. B. Jørgensen and K. Richardson, Eds., Eu- trophication in Coastal Marine Ecosystems, Amercian Geophysical Union, Coastal and Estuarine Studies, Vol. 52, 1996, pp. 51-66. [20] Fyn County, “Aquatic Environment of Fyn, Denmark, 1976-2000. Streams and Lakes, Coastal Waters, Ground- water, Environmental Impact of Wastewater and Agri- culture,” Fyn County, Odense, 2001. [21] C. Jürgensen, “Modelling of Nutrient Release from Sedi- ment in a Tidal Inlet, Kertinge Nor, Funen, Denmark,” Ophelia, Vol. 42, No. 1, 1995, pp. 163-178. doi:10.1080/00785326.1995.10431502 [22] J. Bendtsen, K. E. Gustafsson, J. Söderkvist and J. L. S. Hansen, “Ventilation of Bottom Water in the North Sea- Baltic Sea Transition Zone,” Journal of Marine Systems, Vol. 75, No. 1-2, 2009, pp. 138-149. doi:10.1016/j.jmarsys.2008.08.006 [23] H. U. Riisgård, “Filtration Rate in the Blue Mussel Myti- lus edulis Linnaeus, 1758: Dependence on Algal Concen- tration,” Journal of Shellfish Research, Vol. 10, No. 1, 1991, pp. 29-35. [24] H. U. Riisgård, “On Measurement of Filtration Rate in Bivalves—The Stony Road to Reliable Data, Review and Interpretation,” Marine Ecology Progress Series, Vol. 211, 2001, pp. 275-291. doi:10.3354/meps211275 [25] H. U. Riisgård, J. Lassen and C. Kittner, “Valve-Gape Response Times in Mussels (Mytilusedulis)—Effects of Laboratory Preceding-Feeding Conditions and in Situ Tidally Induced Variation in Phytoplankton Biomass,” Journal of Shellfish Research, Vol. 25, No. 3, 2006, pp. 901-913. [26] H. U. Riisgård, P. P. Egede and I. B. Saavedra, “Feeding Behaviour of the Mussel Mytilus edulis: New Observa- tions, with a Minireview of Current Knowledge,” Journal of Marine Biology, 2011, Article ID: 312459. doi:10.1155/2011/312459 [27] P. S. Larsen and H. U. Riisgård, “Validation of the Flow-Through (FTC) and Steady-State (SS) Methods for Clearance Rate Measurements in Bivalves,” Biology Open, 2011, [28] B. B. Jørgensen, “Seasonal Oxygen Depletion in the Bot- tom Waters of a Danish Fjord and Its Effect on the Ben- thic Community,” Oikos, Vol. 34, 1980, pp. 68-76. doi:10.2307/3544551 [29] P. Wiles, L. A. van Duren, C. Häse, J. Larsen and J. H. Simpson, “Stratification and Mixing in the Limfjorden in Relation to Mussel Culture,” Journal of Marine Systems, Vol. 60, No. 1-2, 2006, pp. 129-143. doi:10.1016/j.jmarsys.2005.09.009 Copyright © 2012 SciRes. OJMS  H. U. RIISGÅRD ET AL. Copyright © 2012 SciRes. OJMS 176 [30] M. Tedengren, C. André, K. Johannesson and N. Kautsky, “Genotypic and Phenotypic Differences between Baltic and North Sea Populations of Mytilus edulis Evaluated through Reciprocal Transplantations. III. Physiology,” Marine Ecology Progress Series, Vol. 59, 1990, pp. 221- 227. doi:10.3354/meps059221 [31] K. Johannesson, N. Kautsky and M. Tedengren, “Geno- typic and Phenotypic Differences between Baltic and North Sea Populations of Mytilus edulis Evaluated th- rough Reciprocal Transplantations. II. Genetic Variation,” Marine Ecology Progress Series, Vol. 59, 1990, pp. 211-219. doi:10.3354/meps059211 [32] I. Clausen and H. U. Riisgård, “Growth, Filtration and Respiration in the Mussel Mytilus edulis: No Regulation of the Filter-Pump to Nutritional Needs,” Marine Ecology Progress Series, Vol. 141, 1996, pp. 37-45. doi:10.3354/meps141037 [33] H. U. Riisgrd, K. Lundgreen and P. S. Larsen, “A Pre- liminary Evaluation of Potential for Line-Mussel Produc- tion in the Great Belt (Denmark) Based on Actual Growth of Young Mussels Mytilus edulis,” 2012, Submitted. [34] W. B. Stickle and T. D. Sabourin, “Effects of Salinity on the Respiration and Heart Rate of the Common Mussel, Mytilus edulis L., and the Black Chiton, Katherina tunica (Wood),” Journal of Experimental Marine Biologyand Ecology, Vol. 41, No. 3, 1979, pp. 257-268. doi:10.1016/0022-0981(79)90135-7 [35] S. Sadok, R. F. Uglow and S. J. Haswell, “Haemolymph and Mantle Fluid Ammonia and Ninhydrin Positive Sub- stances Variations in Salinity-Challenged Mussels (Myti- lusedulis L.),” Journal of Experimental Marine Biology- and Ecology, Vol. 211, No. 2, 1997, pp. 195-212. doi:10.1016/S0022-0981(96)02732-3
|