S. POUS ET AL.
Copyright © 2012 SciRes. OJMS
136
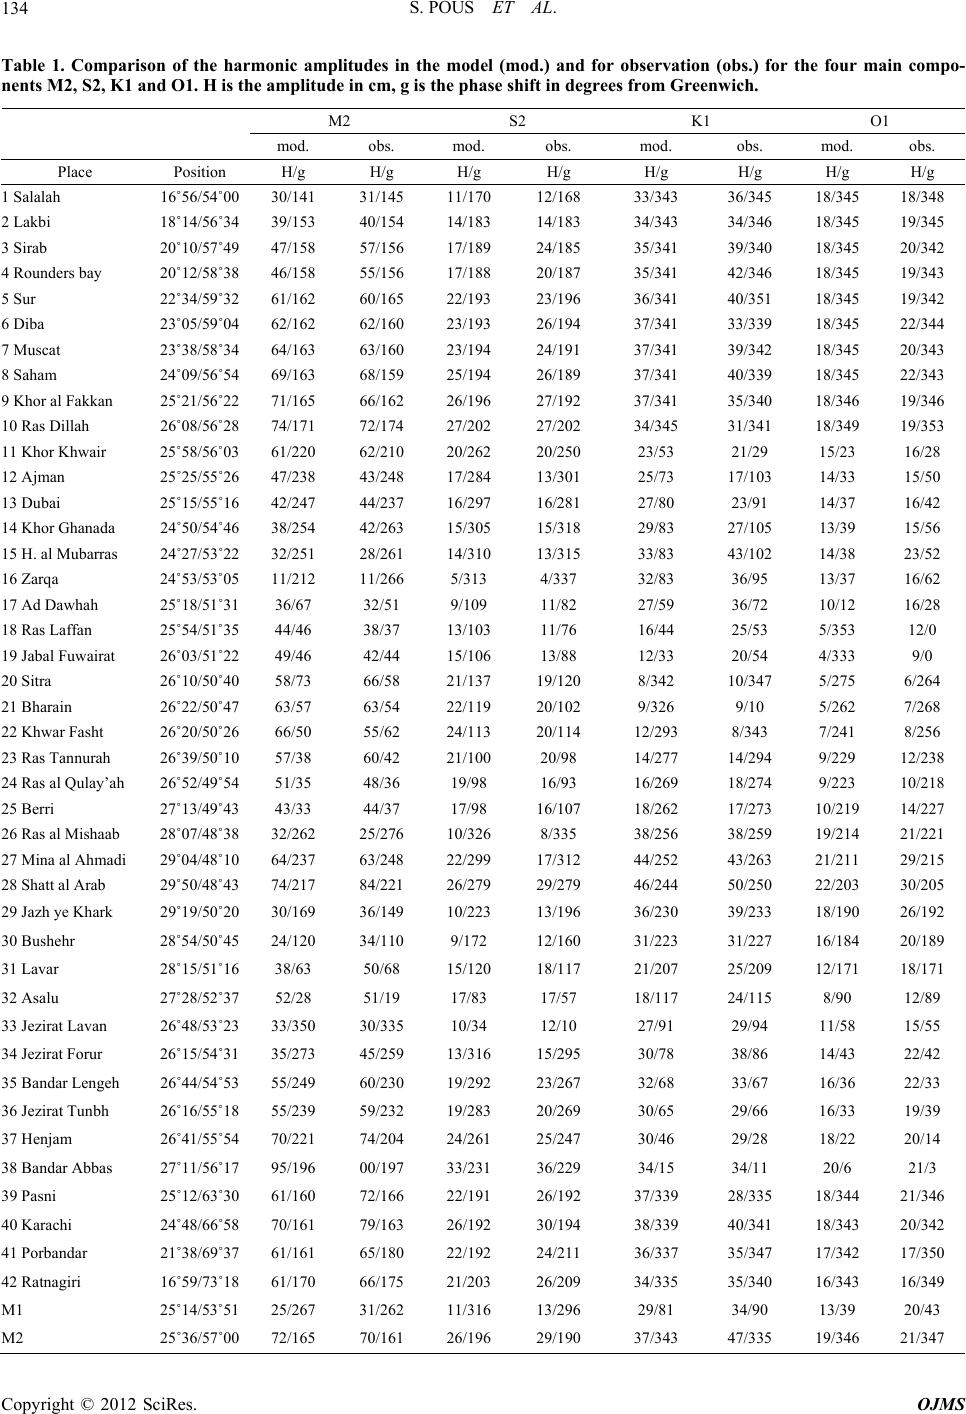
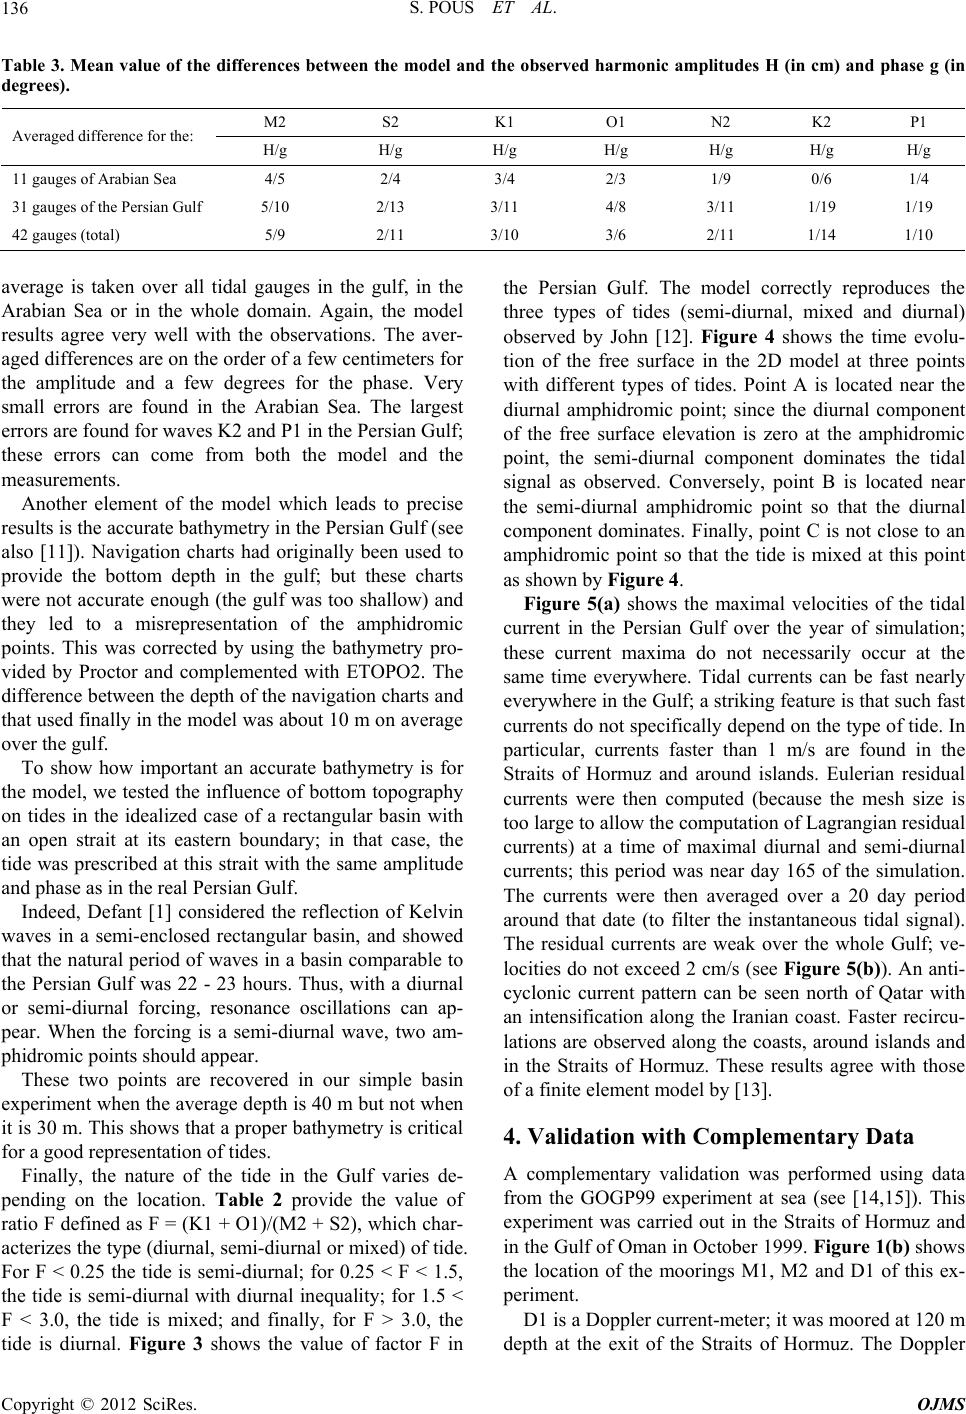
Table 3. Mean value of the differences between the model and the observed harmonic amplitudes H (in cm) and phase g (in
degrees).
M2 S2 K1 O1 N2 K2 P1
Averaged difference for the: H/g H/g H/g H/g H/g H/g H/g
11 gauges of Arabian Sea 4/5 2/4 3/4 2/3 1/9 0/6 1/4
31 gauges of the Persian Gulf 5/10 2/13 3/11 4/8 3/11 1/19 1/19
42 gauges (total) 5/9 2/11 3/10 3/6 2/11 1/14 1/10
average is taken over all tidal gauges in the gulf, in the
Arabian Sea or in the whole domain. Again, the model
results agree very well with the observations. The aver-
aged differences are on the order of a few centimeters for
the amplitude and a few degrees for the phase. Very
small errors are found in the Arabian Sea. The largest
errors are found for waves K2 and P1 in the Persian Gulf;
these errors can come from both the model and the
measurements.
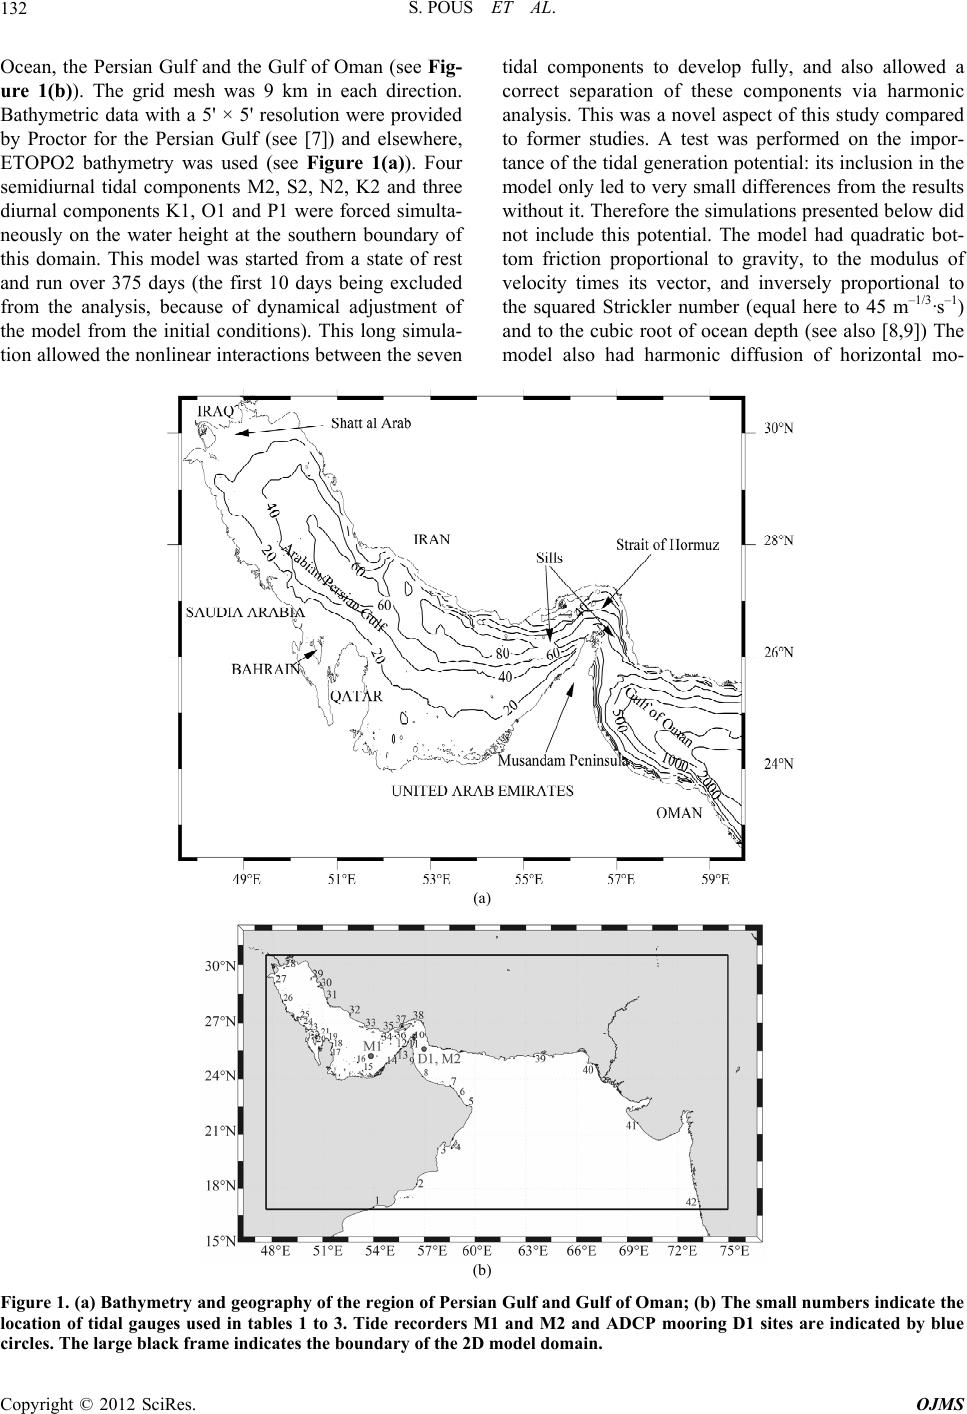
Another element of the model which leads to precise
results is the accurate bathymetry in the Persian Gulf (see
also [11]). Navigation charts had originally been used to
provide the bottom depth in the gulf; but these charts
were not accurate enough (the gulf was too shallow) and
they led to a misrepresentation of the amphidromic
points. This was corrected by using the bathymetry pro-
vided by Proctor and complemented with ETOPO2. The
difference between the depth of the navigation charts and
that used finally in the model was about 10 m on averag e
over the gulf.
To show how important an accurate bathymetry is for
the model, we tested the influence of bottom topography
on tides in the idealized case of a rectangular basin with
an open strait at its eastern boundary; in that case, the
tide was prescribed at this strait with the same amplitude
and phase as in the real Persian Gulf.
Indeed, Defant [1] considered the reflection of Kelvin
waves in a semi-enclosed rectangular basin, and showed
that the natural period of waves in a basin comparable to
the Persian Gulf was 22 - 23 hours. Thus, with a diurnal
or semi-diurnal forcing, resonance oscillations can ap-
pear. When the forcing is a semi-diurnal wave, two am-
phidromic points should appear.
These two points are recovered in our simple basin
experiment when the average depth is 40 m but not when
it is 30 m. This shows that a proper b athymetry is critical
for a good representation of tides.
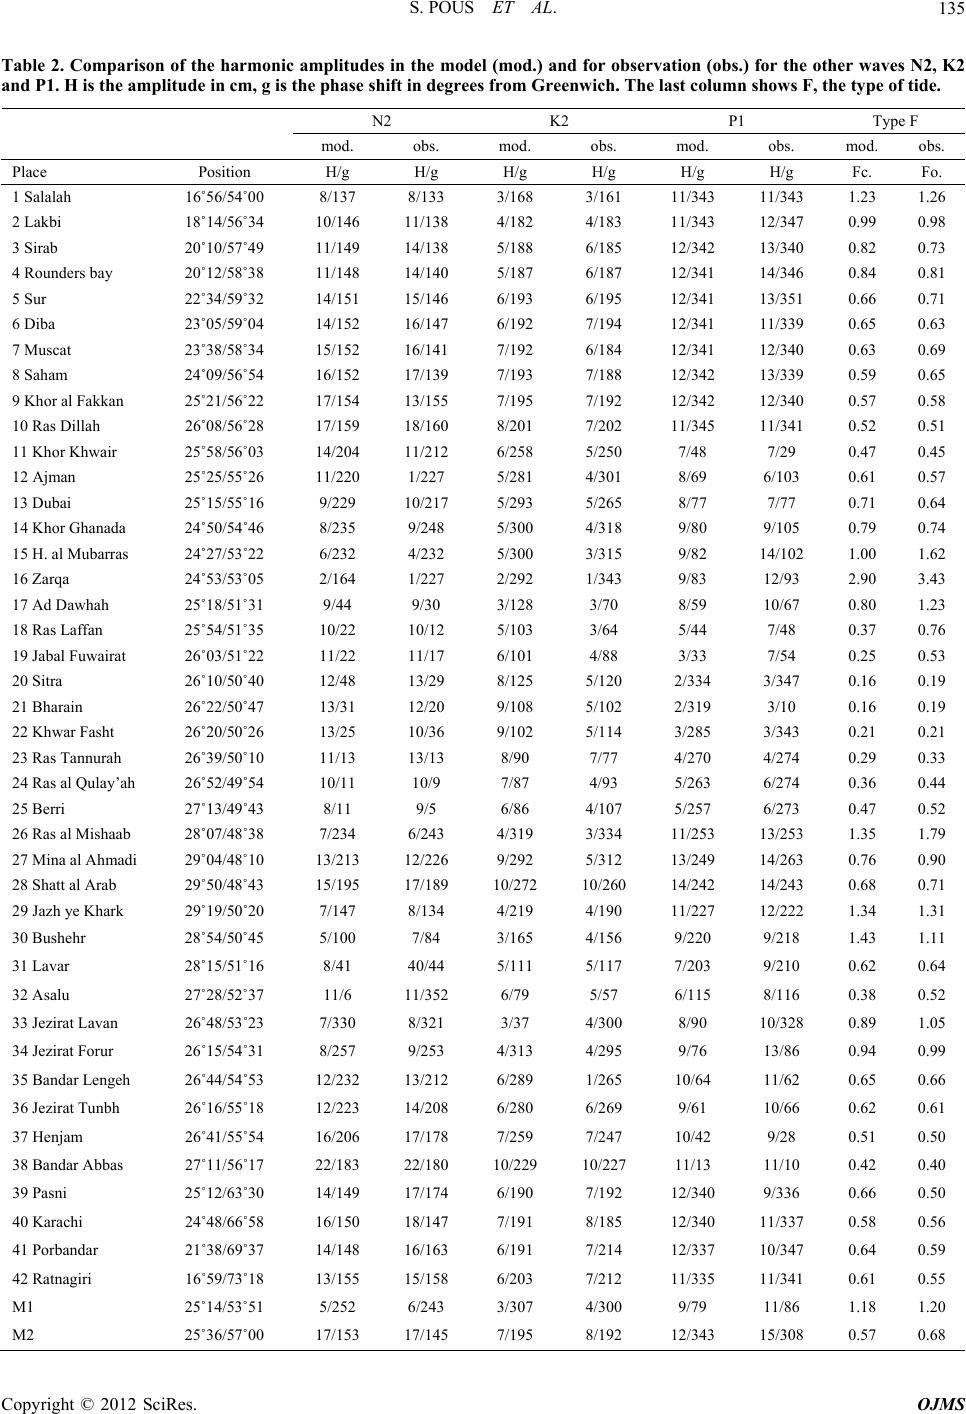
Finally, the nature of the tide in the Gulf varies de-
pending on the location. Table 2 provide the value of
ratio F defined as F = (K1 + O1)/(M2 + S2), which char-
acterizes the type (diurnal, semi-diurnal or mixed) of tide.
For F < 0.25 the tide is semi-diurnal; for 0.25 < F < 1.5,
the tide is semi-diurnal with diurnal inequality; for 1.5 <
F < 3.0, the tide is mixed; and finally, for F > 3.0, the
tide is diurnal. Figure 3 shows the value of factor F in
the Persian Gulf. The model correctly reproduces the
three types of tides (semi-diurnal, mixed and diurnal)
observed by John [12]. Figure 4 shows the time evolu-
tion of the free surface in the 2D model at three points
with different types of tides. Point A is located near the
diurnal amphidromic point; since the diurnal component
of the free surface elevation is zero at the amphidromic
point, the semi-diurnal component dominates the tidal
signal as observed. Conversely, point B is located near
the semi-diurnal amphidromic point so that the diurnal
component dominates. Finally, point C is not close to an
amphidromic point so that the tide is mixed at this point
as shown by Figure 4.
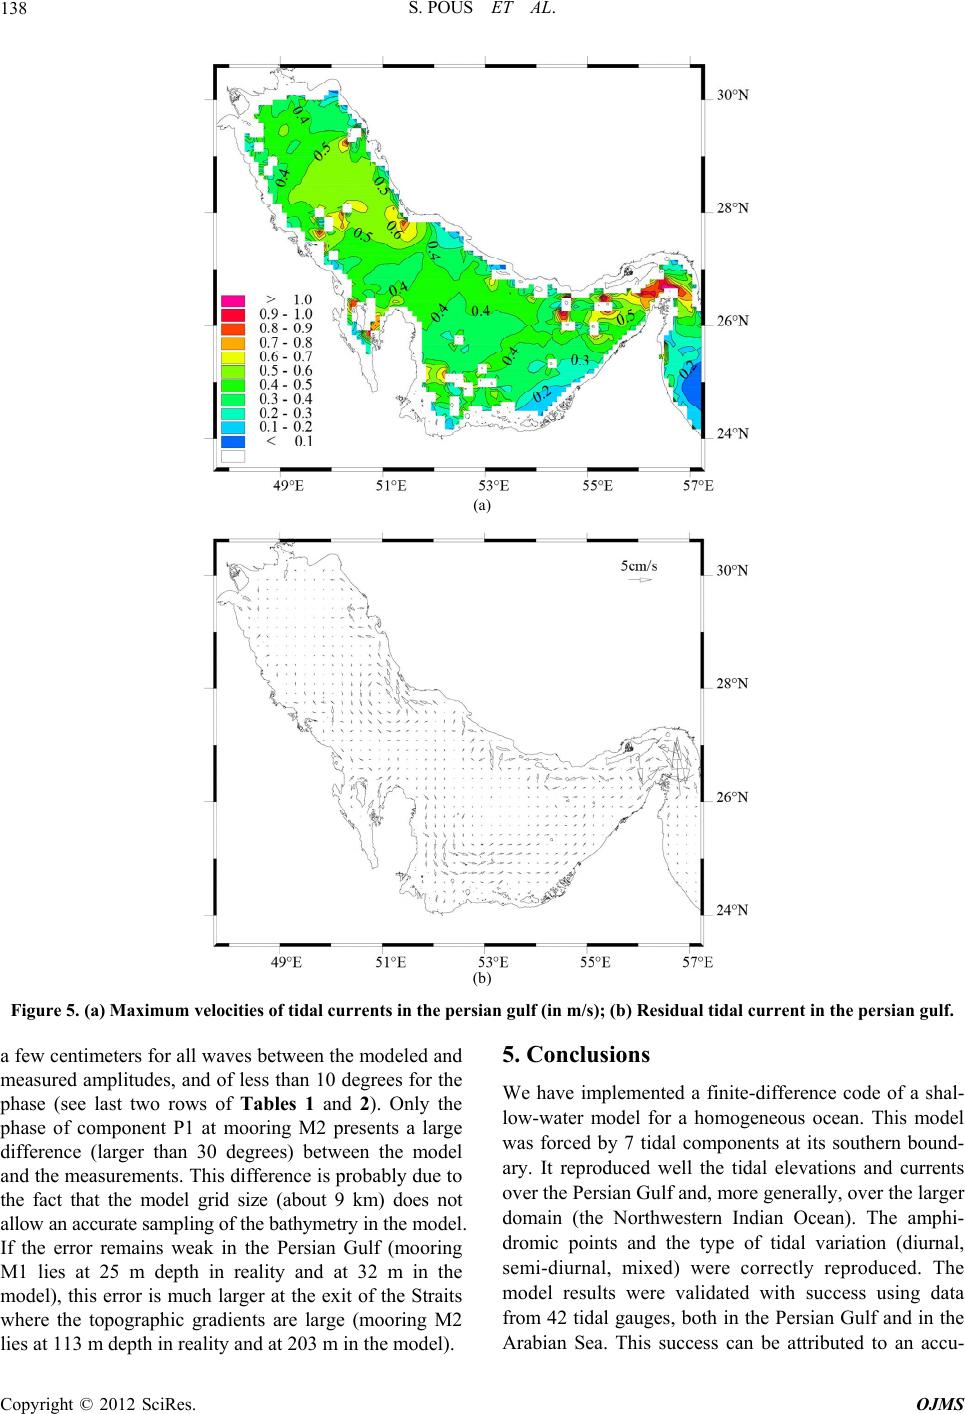
Figure 5(a) shows the maximal velocities of the tidal
current in the Persian Gulf over the year of simulation;
these current maxima do not necessarily occur at the
same time everywhere. Tidal currents can be fast nearly
everywhere in the Gulf; a striking feature is that such fast
currents do not specifically depe nd on the type of tide. In
particular, currents faster than 1 m/s are found in the
Straits of Hormuz and around islands. Eulerian residual
currents were then computed (because the mesh size is
too large to allow the computation of Lagrangian residual
currents) at a time of maximal diurnal and semi-diurnal
currents; this period was near day 165 of the simulation.
The currents were then averaged over a 20 day period
around that date (to filter the instantaneous tidal signal).
The residual currents are weak over the whole Gulf; ve-
locities do not exceed 2 cm/s (see Figure 5(b)). An anti-
cyclonic current pattern can be seen north of Qatar with
an intensification along the Iranian coast. Faster recircu-
lations are observed along the coasts, around islands and
in the Straits of Hormuz. These results agree with those
of a finite element model by [13].
4. Validation with Complementary Data
A complementary validation was performed using data
from the GOGP99 experiment at sea (see [14,15]). This
experiment was carried out in the Straits of Hormuz and
in the Gulf of Oman in October 1999. Figure 1(b) shows
the location of the moorings M1, M2 and D1 of this ex-
periment.
D1 is a Doppler current-meter; it was moored at 120 m
depth at the exit of the Straits of Hormuz. The Doppler