Paper Menu >>
Journal Menu >>
 J. Biomedical Science and Engineering, 2010, 3, 816-821 JBiSE doi:10.4236/jbise.2010.38109 Published Online August 2010 (http://www.SciRP.org/journal/jbise/). Published Online August 2010 in SciRes. http:// www.scirp. org/journal/jbise Use of instantaneous energy of ABR signals for fast detection of wave V Adeela Arooj, Mohd Rushaidin Muhamed, Sheikh Hussain Shaikh Salleh, Mohd Hafizi Omar Center for Biomedical Engineering, Faculty of Biomedical and Health Science Engineering, University Technology Malaysia, UTM Skudai, Johor, Malaysia. Email: dradeelaarooj@yahoo.com Received 16 December 2009; revised 28 January 2010; accepted 31 May 2010. ABSTRACT Brainstem evoked response audiometry is a powerful diagnostic technique in audiology, otology and neuro- logy. ABR(Auditory Brainstem Response) machine has been very useful and popular in past two decades for detection of hearing defects and pathologies in newborns and children. In ABR, wave V is the most prominent and robust wave that has been used as indicator of hearing loss. However, a fast detection of the wave V is necessary in order to implement new- born hearing screening. Researchers have intro- duced different kind of signal processing technique in order to achieve this target and one of this is Fast Fourier Transform (FFT) and Wavelet Transform. In this study, the instantaneous energy of ABR sig- nal had been introduced as a marker to identify the ABR waves. Study showed that the instantaneous energy of auditory brainstem response can be used as a marker to identify the ABR waves. This study had proposed a platform for fast hearing screening system. Keywords: Auditory Brainstem Response; Neonate; Hearing Screening; Instantaneous Energy 1. INTRODUCTION 1.1. Newborn Hearing Screening Hearing screening of neonates is the key to prevent the most serious consequences of hearing loss. One of the most common neurosensory handicaps in newborns and children is congenital hearing loss [1,2]. Hearing plays a basic role in speech, intellectual and language develop- ment. The importance of early detection and rehabili- tation of infants with hearing impairment cannot be overstated. Unfortunately, the average time between birth and the detection of congenital sensorineural (SN) hearing loss is 2.5 years. The American Joint Committee on Infant Hearing recommended that audio logical reha- bilitation should begin within the first 6 months of life (3). In cases with pronounced hearing loss even no speech ability will be developed at all causing serious communication problems and impaired intellectual and emotional development. The consequences of being deaf-mute are the needs of special schools and care, social isolation and no development of potential skills. Thus there are serious medical and economical conse- quences for the entire society due to this problem [1]. According to the World Health Organization, 5 per 1,000 neonates are born with significant hearing loss. Data on prevalence of congenital Permanent Childhood Hearing Impairment (PCHI) differs from country to country. The prevalence of PCHI has been estimated to be 1.1-1.5 for every 1000 live births in Estonia, 1 in 900 in the UK to 1 in 2500 newborns in Atlanta, Georgia. The prevalence of Hearing loss is variable among different races, birth weight and other pregnancy risk factors. It is 10-20 times higher in high risk babies as compared to normal babies. In Malaysia, there is no published data on the actual prevalence of hearing impairment in children. Estimated figures obtained from the Statistics Division, United Nations Economic and Social Commission for Asia and the Pacific (ESCAP) (2002) indicate that Malaysia with a total population of 23.8 million and birth rate of 23.5 per 1000 population has about 559,000 babies born in a year. If the prevalence of hearing loss of 1.5 in every 1000 live births is applied in our population, a rough estimate is that about 840 babies with hearing loss are born each year in this country [2]. However, one study case have been done to determine the prevalence of hearing loss among newborns delivered at Hospital University Malaya shows that the prevalence is 0.42% (16/3,762) [3]. All over the world, strategies used in UNHS are based on otoacoustic emissions (OAE) and auditory brainstem response (ABR). Particularly, methods based on ABR are well-considered due to their high specificity and  A. Arooj et al. / J. Biomedical Science and Engineering 3 (2010) 816-821 817 Copyright © 2010 SciRes. JBiSE sensitivity rates, and their high correlation between impairment and alteration in the ABR pattern [4]. OAE testing evaluates the integrity of the inner ear (cochlea). In response to noise, vibrations of the hair cells in a healthy inner ear generate electrical responses, known as otoacoustic emissions. The absence of OAEs indicates that the inner ear is not responding appropriately to sound [5]. There are two types of OAE screening techni- ques, Transient Evoked Otoacoustic Emissions (TEOAEs) and Distortion Product Otoacoustic Emissions (DPOAEs) [5,6]. The Auditory Brainstem Response (ABR) is one of the most widely used auditory evoked potentials (AEP). The ABR is a far-field, differentially averaged, electro- physiologically recorded signal. It represents the sum- med and averaged responses of thousands of nerve fibres to repeated acoustic stimulation [7]. The stimulus is delivered via earphones or an inserted ear probe and scalp electrodes are used to pick up the signal. ABR evaluates the integrity of the peripheral auditory system and the auditory nerve pathways up to the brainstem and is able to identify infants who have normal cochlear function but abnormal eighth-nerve function (auditory neuropathy) [5]. Detection of wave V in the ABR measurements is the most reliable objective diagnosis and quantification of hearing loss in children [8-11]. Due to a poor signal-to-noise ratio, 2000-4000 sweeps have to be averaged to obtain a meaningful, visually notice- able signal at a particular stimulation level [12]. Usually in Malaysia, Hearing Screening is done when babies are brought to the Maternal Child Health Clinics or private clinics for their routine immunization using the Infant Distraction Test or when children fail to attain normal language milestones (personal communication). Recently, newborn hearing screening has been intro- duced in a few hospitals on a regular basis in the Klang Valley. In other centers, babies with high risk factors such as prolonged NICU stay, craniofacial anomalies or previous history of meningitis are usually referred earlier for a full audiological assessment. Typically, screening programs use a 2-stage screening approach, either OAE repeated twice, OAE followed by ABR, or ABR repeated twice, or use a 3-stage screening approach, OAE repeat- ed twice and followed by ABR [13,14]. NHS programs are commonly conducted as multiple stage procedures. Figure 1 shows the implementation of universal NHS in the state of Saarland, Germany [6]. 1.2. ABR Recording System In 1984, an automated electric response audiometry recording system has been developed [15]. It uses Nascom 2, an 8 bit microcomputer with a Z80A pro- cessor running at 4 MHz, 32 KB RAM and 8 input/ output ports, 12 bit analog to digital converter, low noise differential amplifier, optically isolated amplifier and DC to DC converter. An electro-sensitive printer has been used to record the patient information and the ABR result. The gain of the amplifier depends on the full- scale voltage range of the A-D converter and mini- mum voltage input requirements [16]. Typical gain values for evoked response systems range from 10,000-500,000 [16-22]. Taking care of the gain of the amplifier is important. It must be low enough to avoid saturation [23]. Frequency bandwidth is important in order to get the correct range for the signal. The frequency bandwidth of the ABR signal, typically range from 20 Hz-5 kHz [24-26]. This bandwidth will pass the wave v and slow SN10 components of the ABR which are important in the estimation of hearing thresholds. There are variety of sampling rate value with variety of resolution bits that has been used to sample the ABR signal; 12.8, 20 and 50 kHz; 12 and 16 bit [19,20,26]. 1.3. Wave V Detection Various kinds of methods have been introduced for detection of ABR waves. Woodworth et al. [9], introduced a matched filter technique, derived from an ABR obtained at high stimulus level in order to calculate wave V latency at lower intensity level as shown in Figure 2. Strauss et al. [12], introduced an approach for detection of ABRs using a smart single sweep analysis system. The method used a small number of sweeps which is decomposed by optimized tight frames and evaluated by a kernel based novelty detection machine [12]. Delgado and Ozdamar [18], mentioned that results of spectral analysis, spectral filtering and fiber-tract modeling of ABRs were used to determine the most suitable filters to detect the position of the various peaks. These analyses revealed general trends in ABR Figure 1. Organization of 3 stage universal NHS Program (implemented in the state of Saarland, Germany)  818 A. Arooj et al. / J. Biomedical Science and Engineering 3 (2010) 816-821 Copyright © 2010 SciRes. JBiSE Figure 2. Detection of wave V in ABR. composition from one intensity to another and were used to write labeling rules [18]. Wilson and Aghdasi [15], used a Discrete Wavelet Transform (DWT) of ABR signals in order to detect the ABR waves. The wavelets technique is used to decompose a signal into discrete sets of details (high frequencies) and approximations (low frequencies). The different scaled signals are then rebuilt from their resulting wavelet coefficients and analyzed in a method similar to the full signal analysis [24]. In this study, the instantaneous energy of ABR signal has been introduced as a marker to identify the ABR waves. Instantaneous energy technique has pre- viously been employed in other applications of ECG and heart sound signal processing, such as heart sound seg- mentation [27,28]. 2. MATERIALS AND METHODS 2.1. Experiment Setup Figure 3 shows the diagram of the hardware system setup. It consists of (A) gTec USBamp, a biosignal amplifier and data acquisition machine, (B) gPAH, a programmable attenuator, (C) trigger box, (D) head- phone, (E) laptop, (F) MP3 player and (G) electrodes. The gTec USBamp was used to amplify and acquire the ABR signals. The gPAH was used to attenuate the click stimulus produced by MP3 player. MP3 player could be replaced by a laptop as well. The study was done on infants at Pusat Kesihatan (Health Clinic) UTM, JB, Malaysia. The infants were included in the study after a written consent signed by their parents. Our Team included biomedical engineers, nurses and medical doc- tor. Under supervision of medical doctor, the electrodes were applied by nurses on the infant’s frontal parietal (FP) area and mastoid process. Trigger box was used to produce trigger signal from the click stimulus where as different laptops were used in the experiments in order to get smooth clicks. The triggered signal was used to segment the ABR signals. The recorded signals were transferred to a laptop by gTec USBamp via USB port. The recorded signal was filtered at bandwidth ranges from 100 Hz-3000 kHz. The click stimulus rate was setup at 10 clicks sec–1 and the signal was sampled at 19.2 kHz with 24 bit resolution. The stimulus intensity levels used in the experiments are 80, 70 and 60 dBnHL. The signals were averaged after 2048 click stimulus repetitions. Figure 4 shows the electrode’s configuration used in the experiments. The positive electrode (channel 1) was connected to FP2, the negative electrode (re- ference) was connected to mastoid and ground electrode was connected to forehead. The FP2 IS 10% from nasion on the right side of parietal bone. Matlab R2006a simulink software had been used to capture the raw ABR signals from the gTec USBamp and analyze the signals. However, few configurations need to be carried out using the Matlab model. The analysis algorithm was written in Matlab M-file format. 3. RESULTS AND DISCUSSION Figure 5 shows the presentation of the ABR averaged signal and the instantaneous energy of the averaged signal. Figure 5(a) shows the result acquired from a normal person and Figure 5(b) shows the result acquired from a hearing loss person. Both signals are recorded with the intensity of 80 dB. On the ABR averaging signal graph shows three different averaged signals. The signals are plotted on three different baselines, 0, 1 Figure 3. Diagram of the hardware system setup. Figure 4. Electrodes configuration. 1v 0v -1v  A. Arooj et al. / J. Biomedical Science and Engineering 3 (2010) 816-821 819 Copyright © 2010 SciRes. JBiSE and 2 uV respectively. The averaged signal on the 0 base- line used is 500 sweeps, the averaged signal on the 1 baseline used is 250 sweeps, on the 2 baseline used is 125. The dotted vertical line marked the latency of wave V. It can be observed that wave V occurred at specific points in the signal of normal person, Figure 5(a), but did not occur in the signal of hearing loss person, Figure 5(b). Table 1 shows the summary of the graph. The normal subject showed results with the latency 5.313 m/sec and amp- litude range from 0.335-0.235 uV. The hearing loss subject showed result with the latency 5.156msec and amplitude range from –0.9288 to –0.707 uV. The objective of the study is, to investigate the effect- tiveness of instantaneous energy for the detection of (a) (b) Figure 5. Wave V detection using instantaneous energy of ABR signal on (a) normal subject (b) hearing loss subject 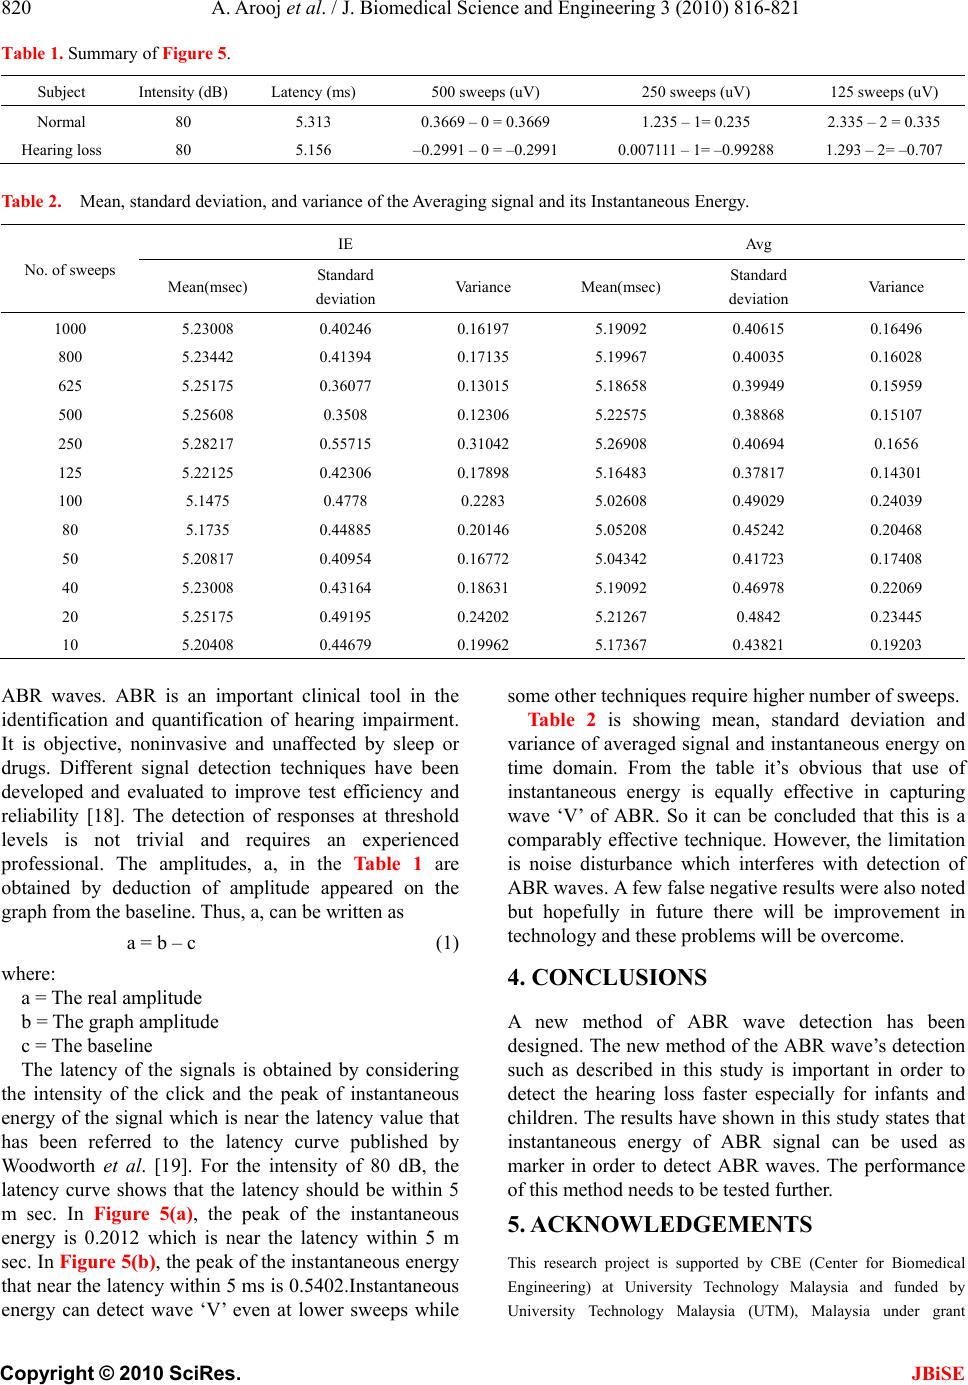 820 A. Arooj et al. / J. Biomedical Science and Engineering 3 (2010) 816-821 Copyright © 2010 SciRes. JBiSE Table 1. Summary of Figure 5. Subject Intensity (dB) Latency (ms) 500 sweeps (uV) 250 sweeps (uV) 125 sweeps (uV) Normal 80 5.313 0.3669 – 0 = 0.3669 1.235 – 1= 0.235 2.335 – 2 = 0.335 Hearing loss 80 5.156 –0.2991 – 0 = –0.2991 0.007111 – 1= –0.99288 1.293 – 2= –0.707 Table 2. Mean, standard deviation, and variance of the Averaging signal and its Instantaneous Energy. No. of sweeps IE Avg Mean(msec) Standard deviation Variance Mean(msec) Standard deviation Variance 1000 5.23008 0.40246 0.16197 5.19092 0.40615 0.16496 800 5.23442 0.41394 0.17135 5.19967 0.40035 0.16028 625 5.25175 0.36077 0.13015 5.18658 0.39949 0.15959 500 5.25608 0.3508 0.12306 5.22575 0.38868 0.15107 250 5.28217 0.55715 0.31042 5.26908 0.40694 0.1656 125 5.22125 0.42306 0.17898 5.16483 0.37817 0.14301 100 5.1475 0.4778 0.2283 5.02608 0.49029 0.24039 80 5.1735 0.44885 0.20146 5.05208 0.45242 0.20468 50 5.20817 0.40954 0.16772 5.04342 0.41723 0.17408 40 5.23008 0.43164 0.18631 5.19092 0.46978 0.22069 20 5.25175 0.49195 0.24202 5.21267 0.4842 0.23445 10 5.20408 0.44679 0.19962 5.17367 0.43821 0.19203 ABR waves. ABR is an important clinical tool in the identification and quantification of hearing impairment. It is objective, noninvasive and unaffected by sleep or drugs. Different signal detection techniques have been developed and evaluated to improve test efficiency and reliability [18]. The detection of responses at threshold levels is not trivial and requires an experienced professional. The amplitudes, a, in the Table 1 are obtained by deduction of amplitude appeared on the graph from the baseline. Thus, a, can be written as a = b – c (1) where: a = The real amplitude b = The graph amplitude c = The baseline The latency of the signals is obtained by considering the intensity of the click and the peak of instantaneous energy of the signal which is near the latency value that has been referred to the latency curve published by Woodworth et al. [19]. For the intensity of 80 dB, the latency curve shows that the latency should be within 5 m sec. In Figure 5(a), the peak of the instantaneous energy is 0.2012 which is near the latency within 5 m sec. In Figure 5(b), the peak of the instantaneous energy that near the latency within 5 ms is 0.5402.Instantaneous energy can detect wave ‘V’ even at lower sweeps while some other techniques require higher number of sweeps. Table 2 is showing mean, standard deviation and variance of averaged signal and instantaneous energy on time domain. From the table it’s obvious that use of instantaneous energy is equally effective in capturing wave ‘V’ of ABR. So it can be concluded that this is a comparably effective technique. However, the limitation is noise disturbance which interferes with detection of ABR waves. A few false negative results were also noted but hopefully in future there will be improvement in technology and these problems will be overcome. 4. CONCLUSIONS A new method of ABR wave detection has been designed. The new method of the ABR wave’s detection such as described in this study is important in order to detect the hearing loss faster especially for infants and children. The results have shown in this study states that instantaneous energy of ABR signal can be used as marker in order to detect ABR waves. The performance of this method needs to be tested further. 5. ACKNOWLEDGEMENTS This research project is supported by CBE (Center for Biomedical Engineering) at University Technology Malaysia and funded by University Technology Malaysia (UTM), Malaysia under grant  A. Arooj et al. / J. Biomedical Science and Engineering 3 (2010) 816-821 821 Copyright © 2010 SciRes. JBiSE “Universal Hearing Screening in Malaysia Based On A Cost Efficient Organization Structure Using An Innovative ABR Technology: The Johor Screening Scheme” Vot 77013. REFERENCES [1] Yoshinaga-Itano, C. (1999) Benefits of early intervention for children with hearing loss. Otolaryngol. Clinics of North America, 32(6), 1089-1102. [2] Sivalal, S. (2005) Screening for hearing loss in infants. Health Technology Assessment Report. http://www.moh. gov.my/MohPortal/DownloadServlet?id=717&type=2 [3] Joint Committee on Infant Hearing (1982) Position statement. American Academy of Paediatrics. Pediatrics, 70, 496-497. [4] American Academy of Pediatric (1999) Newborn and infant hearing loss: Detection and intervention. Pe- diatrics, 103, 527-530. [5] Helfand, O.M., Thompson, D.C., Davis, R., McPhillips, H., Homer, C.J. and Lieu, T.L. (2001) Newborn hearing screening: Systematic evidence review. AHRQ Pub- lication No. 02-S001, Agency for Healthcare Research and Quality, Rockville. [6] Delb, W., Merkel, D., Pilorget, K., Schmitt, J. and Plinkert, P.K. (2004) Effectiveness of a teoae-based screening program. Can a patient-tracking system effect- tively be organized using modern information technology and central data management? European Archives of Otorhinolaryngology, 261(4), 191-196. [7] Hall III, J. (1992) Handbook of auditory evoked responses. Allyn and Bacon, Needham Heights. [8] Wicke, J.D., Goff, W.R., Wallace, J.D. and Allison, T. (1978) On-line statistical detection of average evoked potentials: Application to evoked response audiometry (ERA). Electroencephalography and Clinical Neuro- physiology, 44(3), 328-343. [9] Woodworth, W., Reisman, S. and Fointaine, A.B. (1983) The detection of auditory evoked responses using a matched filter. IEEE Transactions on Biomedical Engi- neering, 30(7), 369-376. [10] Mason, S.M. and Adams, W. (1984) An automated microcosmputer based electric response audiometry system for machine scoring of auditory potentials. Clinical Physics and Physiological Measurement, 5(3), 219-222. [11] Shangkai, G. and Loew, M.H. (1986) An autoregressive model of the BAEP signal for hearing threshold testing. IEEE Transactions on Biomedical Engineering, 33(6), 560-565. [12] Strauss, D.J., Delb, W., Plinkert, P.K. and Schmidt, H. (2004) Fast detection of wave V in ABRs using a smart single sweep analysis system. Proceedings of the 26th Annual International Conference of the IEEE Engi- neering in Medicine and Biology Society, IEEE Xplore Press, 1, 458-461. [13] Abdullah, A., Hazim, M.Y.S., Almyzan, A., Jamilah, A.G. and Roslin, S., et al. (2006) Newborn hearing screening: Experience in a Malaysian hospital. Singapore Medical Journal, 47(1), 60-64. [14] Clemens, C.J., Davis, S.A. and Bailey, A.R. (2000) The false-positive in universal newborn hearing screening. Pediatrics, 106(1), e7. [15] Wilson, W.J. and Aghdasi, F. (1999) Fast Fourier transform analysis of the auditory brainstem response: Effects of stimulus intensity and subject age, gender and test ear. AFRICON, IEEE, 1, 285-290. [16] American Speech-Language-Hearing Association (1987) Short latency auditory evoked potentials. ASHA Practice Policy. [17] Neely, S. and Liu, Z. (1998) ABRAV: Auditory brainstem response average. http://www.boystownhospital.org/Media/ Research/abravtm.pdf [18] Delgado, R.E. and Ozdamar, O. (1994) Automated auditory brainstem response interpretation. IEEE Engi- neering in Medicine and Biology Magazine, 13(2), 227- 237. [19] Dajani, H.R., Purcell, D., Wong, W., Kunov, H. and Picton, T.W. (2005) Recording human evoked potentials that follow the pitch contour of a natural vowel. IEEE Transactions on Biomedical Engineering, 52(9), 1614- 1618. [20] Boston, J.R. (1981) Spectra of auditory brainstem responses and spontaneous EEG. IEEE Transactions on Biomedical Engineering, 28(4), 334-341. [21] Wilson, W.J. and Aghdasi, F. (2001) The importance of pre-analysis windowing on auditory brainstem response fast Fourier transform analysis. Scandinavian Audiology, 30(1), 3-12. [22] Wilson, W.J. (2004) The relationship between the auditory brain-stem response and its reconstructed waveforms following discrete wavelet transformation. Clinical Neurophysiology, 115(5), 1129-1139. [23] Bell, S.L., Smith, D.C., Allen, R. and Lutman, M.E. (2004) Recording the middle latency response of the auditory evoked potential as a measure of depth of anaesthesia. British Journal of Anaesthesia, 92(3), 442-445. [24] Wilson, W.J. and Aghdasi, F. (1999) Discrete wavelet analysis of the auditory brainstem response: Effects of subject age, gender and test ear. AFRICON, IEEE, 1, 291-296. [25] Beltran, N. and Cornejo, J.M. (2003) Simultaneous transient evoked otoacoustic emissions and auditory brainstem response for auditory evaluation. Proceedings of the 25th Annual International Conference of the IEEE Engineering in Medicine and Biology Society. IEEE Xplore Press, 4, 3222-3224; [26] Strauss, D.J., Delb, W. and Plinkert, P.K. (2004) Objective detection of the central auditory processing disorder: A new machine learning approach. IEEE Tran- sactions on Biomedical Engineering, 51(7), 1147- 1155. [27] Malarvili, M.B., Kamarulafizam, I., Hussain, S. and Helmi, D. (2003) Heart sound segmentation algorithm based on instantaneous energy of electrocardiogram. Computers in Cardiology, 30, 327-330. [28] Rushaidin, M.M., Salleh, S.-H., Swee, T.T., Najeb, J.M. and Arooj, A. (2009) Wave V detection using instan- taneous energy of auditory brainstem response signal. American Journal of Applied Sciences, 6(9), 1669-1674, 2009. |