Journal of Modern Physics, 2012, 3, 1683-1691
http://dx.doi.org/10.4236/jmp.2012.330206 Published Online October 2012 (http://www.SciRP.org/journal/jmp)
Numerical Investigation of the Plasma Formation in
Distilled Water by Nd-YAG Laser Pulses of
Different Duration
Laila H. Gaabour1, Yosr Ezz El Din Gamal1, G. Abdellatif2*
1Department of Physics, Girl’s Faculty of Science, King Abdul-Aziz University, Jeddah, KSA
2Physics Department, Faculty of Science, Cairo University, Giza, Egypt
Email: Galila@sci.cu.edu.eg, galila@sci.cu.edu.eg
Received August 20, 2012; revised September 19, 2012; accepted September 26, 2012
ABSTRACT
Water breakdown studies by Nd-YAG laser pulses of duration 100 fs, 30 ps and 6 ns at wavelength 1064 nm are pre-
formed to investigate the physical mechanisms which couple the laser energy into the medium. Calculations are carried
out applying a modified kinetic model of water breakdown previously developed by Kennedy (1995) to investigate the
correlation between threshold intensity of breakdown and laser pulse length. The modifications considered the introduc-
tion of diffusion and recombination loss processes which might take place under the experimental conditions applied in
these calculations. The validity of the model is tested by comparing the calculated threshold intensities and the experi-
mentally measured ones where good agreement is shown. The study of the time evolution of the electron density clari-
fies the correlation between the pulse length and dominant ionization mechanism. The analysis of the spatial distribu-
tion of the electron density along the radial and axial distances of the focal spot showed that the size of the formed
plasma increases with the increase of the pulse length. On the other hand, studies of self-focusing effect illustrated that
under the investigated experimental conditions the effect of this process has an effective contribution only at laser
pulses of the order of femtosecond scale when the laser beam is focused by a lens of a focal length 8.0 cm. This result
in turns assures that using femtosecond pulses in ophthalmic microsurgery could be a safe tool from the retinal damage.
Keywords: Laser Induced Breakdown; Water Breakdown; Electron Density; Self Focusing; Modeling of Plasma
Formation; Laser Medicine
1. Introduction
Laser induced optical breakdown in aqueous media re-
presents a challenging topic in applied physics. It re-
ceived considerable attention for many years because it
has various applications in medicine and biolog as well
as it plays significant rules in the mechanism of plasma
mediated ablation and photo-disruption. These represent
the most important interactions between short laser pul-
ses and tissue. Accordingly, it has great interest in medi-
cal applications especially in ophthalmic microsurgery
and laser lithotripsy [1].
Although this phenomenon is extensively investigated
both experimentally and theoretically [2-8], the mecha-
nisms responsible for the threshold dependence on laser
duration are still an open question. Experimental studies
of this phenomenon revealed that, there are two main
mechanisms that can lead to ionization and plasma for-
mation namely; cascade ionization and multiphoton
ionization [9,10]. Cascade or sometimes called avalanche
Ionization occurs with long pulse durations (~nanosec-
onds) and requires an initial quasi-free seed electron in
the focal volume. This process tends to be impurity de-
pendent and requires a quite condensed medium to allow
many collisions within the long pulse duration. With ul-
tra short pulse duration (picoseconds or femtoseconds)
pure multiphoton ionization of the medium occurs where
each molecule is independently ionized by the electric
field, without the need of particle-particle interaction or
seed electrons. This breakdown is thus independent of
impurities in the medium and can be applied consistently
to a variety of tissues. Moreover, the breakdown pheno-
menon is found to be more stable with the ultra short
pulses while it is unstable with the nanosecond laser
pulse scales [11]. Several theoretical models have been
proposed to explain the physical phenomenon involved
in the breakdown of a medium. These models describe
the breakdown threshold intensity which determines the
onsite of ionization and plasma formation considering
C
opyright © 2012 SciRes. JMP
L. H. GAABOUR ET AL.
1684
these two mentioned mechanisms. Although these mod-
els could reasonably investigate the experimental meas-
urements that carried out on gases and solids in aqueous
media [12,13], however, these models still did not give
well understanding about the breakdown phenomenon.
Accordingly, in the present work a modified model
previously developed by [4] based on the solution of a
rate equation is proposed to investigate the plasma for-
mation mechanism in distilled water induced by laser
pulses of duration 100 fs, 30 ps and 6 ns at wavelength
1064 nm [14]. The model takes into account the genera-
tion of electrons due to the combined effect of both multi-
photon ionization and cascade ionization processes.
Moreover, loss processes due to electron diffusion and
recombination are also considered in this analysis.
As a part of our study is the understanding and mo-
deling the eye damage produced by exposure to laser
pulses with different lenses. The aim of this study is to
model the breakdown and plasma formation caused by
different pulse duration in the area from the cornea to the
retina. The result gained from this analysis is to find out
the effect of self focusing which occurs during the inter-
action and propagation of the laser pulses. Measurements
of the nonlinear effect and laser induced breakdown thre-
shold for water indicate that water is a reasonable stimu-
lant for the vitreous humor of the eye. In addition, water
displays a nonlinear Kerr effect and self-focusing can
occur at megawatt peak input powers. Indeed, these self-
focusing leads to water breakdown which could explain
the anomaly of the retinal damage caused by femtosec-
ond pulses in the ophthalmic microsurgery [15]. There-
fore, in this analysis we also present an investigation of
the nonlinear effect associated with the propagation of
laser radiation in a distilled water.
2. Theoretical Formulations
2.1. Basic Equation
In the present model the breakdown threshold is firstly
considered to be independent of the laser beam diameter,
i.e. the plasma formation is only time-dependent. Accor-
dingly for a Gaussian laser pulse the temporal variation
of the laser intensity is written as:
 

2
2
4
0e
t
I
tIA B





 
(1)
where A (A = 4.5208) and B (B = 0.7788) are constants,
I(0) is the laser peak intensity and (2τ) is the laser pulse
width (FWHM).
Secondly, in studying plasma propagation along the
axial distance of the focal volume, the variation of the
laser intensity is taken as a function of both space z and
time t and is written as:
2
max
2
,exp4ln2
π
Pt
Itz wz









(2)
where Pma x is the maximum laser power and w(z) is the
beam radius at any position z, which is given by
12
2
02
1
R
z
wz wz




(3)
2
0
π
R
znw
where w0 is the beam waist and
is the
Rayleigh length of the laser beam.
The focal volume is determined using the geometric
optics consideration and has a cylindrical shape given by

2
2
0
π21
2
d
VfD
 (4)
where d is the beam spot size, f is the focal length of the
focusing lens, θ is the beam divergence and D0 is the
unfocused beam diameter. The breakdown criterion is
taken to be the attainment of a critical electron density of
1019 - 1020 cm3 which agrees quite well with the ex-
perimental measurements given in [7].
Following to these parameters, the general form of the
rate equation that describes the variation of electrons
density under the combined effect of both multi-photon
ionization and cascade ionization mechanisms in laser
induced breakdown of water is written as:
2
dd
dd
mpa casDR
tt


 (5)
where
is the free electron density, cas
, D and R
represents the ionization, diffusion and recombination
rates respectively. The first two terms on the right hand
side of this equation represent electron generation through
multiphoton absorption d
dmpa
t
and cascade ionization
(cas
d
). The remaining terms account for electron diffu-
sion out of the focal volume (
) and the recombina-
tion loss (Rρ2). For accurate computation in this model
we take into account the depletion of water molecular
due to ionization by subtracting the generated electron
density from the molecular density. The water data re-
quired to solve Equation (5) is given in the following
section.
2.2. Water Data
2.2.1. Multiphoton Ionization Rate
Following to [3] and other authors [4,14], in this model
the water is treated as an amorphous semiconductor with
a band gap energy (equivalent to the ionization energy
ΔE = 6.5 eV) [16]. To ionize a water molecule K photons
are required, where K is the smallest integer greater than
the ratio ΔE/h
and sometimes called the degree of non-
Copyright © 2012 SciRes. JMP
L. H. GAABOUR ET AL. 1685
linearity of multiphoton ionization, h is Plank’s constant
and
denoting the laser frequency. Consequently, the
approximate expression for the multiphoton ionization
rate in condensed media given by [17] is written as:

32
0
d2
d9π16
exp 22
2
2
e
K
mph
m
I
tnc
KI K

m E
E

 


 








22
0
exp d
x

(6)
with


exp
x
xyy

 
In this equation ω is the angular frequency of laser
light, I represents the laser intensity,
eh e h is the reduced exciton mass, e is
the electron charge, n is the refractive index of water, c is
the velocity of light, ε0 is permittivity of free space and
ΔE is the ionization potential of water.
mm
mmm
2.2.2. Cascade Ionization Rate
The assumed existing free electrons which are generated
by multiphoton ionization can gain energy from the laser
field through inverse Bremesstruhling absorption (IBA)
in colliding with the water molecules. After several IBA
events, the kinetic energy of the free electrons could ex-
ceed the ionization energy ΔE. Then these electrons can
collide and ionize another molecule creating new low
energy free electrons. Following [4], the cascade ioniza-
tion rate per electron is given by:
22
mm
m
M
22
0
e
1
1
cas
m
I
cnm E



(7)
where τm is the mean free time between electron-heavy
particle collisions, M is the mass of a medium molecule,
(for water M = 3.0 × 1026 Kg), m is the electron mass.
The first term of this equation is related to the energy
gain by electrons from the laser electric field where as
the second term describes the energy transfer from electrons
to water molecules during elastic collisions. For water the
mean free time between momentum transfer collisions
(τm) has not yet been measured, therefore we adopted the
estimated value used in [4,14] which is taken as 1 fs.
2.2.3. Diffusion Loss
The expression of diffusion rate per electron which de-
scribes the decrease of the electron density along the ra-
dial and axial distances of the cylindrical volume with
radius w0 and length zR is given by [4,14]:
22
1
R
z










0
2.4
3
mE
Dmw
(8)
From this relation it is clear that the smaller the spot
size the higher rate of diffusion loss. This in turn results
in a higher breakdown threshold when the laser pulse
exceeds the diffusion time. For pulse duration less than
nanosecond diffusion time is greater than the laser pulse
causing diffusion losses to be less probable.
2.2.4. Recombination Rate Coefficient
The recombination rate coefficient R is taken as the em-
pirical value obtained by [2] through measurement of the
decay plasma luminescence to be 2 × 109 cm3·s1. For
nanosecond pulses recombination losses during the laser
pulse are quite important, while their effect might be
negligible for shorter pulses.
2.3. Method of Calculations
Considering these rates, Equation (1) is solved numeri-
cally to obtain the threshold irradiance required to pro-
duce breakdown in water for a given pulse duration, us-
ing a Runge-Kutta fourth order technique with adaptive
time step. Optical breakdown is assumed to occur when
the free electron density obtained during the laser pulse
exceeds the given critical value (1019 - 1020 cm3). The
solution procedure for the plasma formation in water in-
duced by laser pulses in each time step can be summa-
rized as:
The free electron density is obtained first at the center
of the focal volume;
The spatial distribution of the free electron density is
identified as non-breakdown and breakdown regions.
Then the corresponding plasma length is determined.
2.4. Nonlinear Effect
For completeness a study is carried out to investigate the
effect of self-focusing on the breakdown of water under
the experimental conditions considered in this analysis.
This study has an important application in ophthalmo-
logic microsurgery of a human eye. Accordingly, the di-
mensions of the focal spot are adjusted to fit the human
eye configuration. The critical power for self focusing
collapse in the absence of plasma generated is calculated
using the formula [18].
2
2
3.77
8π
c
o
Pnn
(9)
where n2 is the nonlinear refractive index of water and is
given by 20
32nB
, B0 is the Kerr constant. n2 is
found to be 8.334 × 1016 cm2/W when the B0 = 4.7 × 10⁷,
at laser wavelength 1064 nm and n0 is the linear refrac-
tive index (for water its value is 1.33) [19].
Computations are performed to determine the laser
power required for breakdown as a function of both laser
pulse length and focal length (input spot radius w0). Its
Copyright © 2012 SciRes. JMP
L. H. GAABOUR ET AL.
1686
value is then compared with the obtained critical power
value using the Equation (9).
results in an observable deviation between the calculated
and measured threshold intensity in particular at the lon-
ger laser pulse as shown by curve (2). Diffusion losses
seems to have a negligible contribution to the threshold
intensity since, its absence did not show any variation on
the threshold intensity as illustrated by curve (3). This
result revealed that over the laser pulse length examined
experimentally, recombination losses have significant
contribution only at 6 ns scale. The slow variation of the
threshold intensity observed over the pulse duration
range 500 ps indicates that breakdown takes place
mainly by multiphoton ionization process. While the pro-
nounced dependence of the threshold intensities at pulse
duration 500 ps, confirms the domination of collisional
ionization process over the longer pulse duration.
3. Results and Discussion
Equation (1) is solved numerically under the experiment-
tal conditions given in [14] to investigate the breakdown
of distilled water by Nd-YAG laser of wavelength 1064
nm at different pulse duration. Adopting the breakdown
criterion which requires the attainment of an electron
density of the order of 1019 - 1020 cm3 at the end of the
laser pulse, a computer program is under taken to calcu-
late the effect of: 1) laser pulse duration on the threshold
intensity; 2) ionization mechanisms; 3) self focusing, as
well as 4) the spatial distribution of the electron density
along the radial and axial distances of the focal spot i.e.
plasma propagation.
3.1. Effect of Pulse Duration
Computations are carried out to investigate the meas-
urements of the breakdown threshold of distilled water as
a function of pulse duration [14]. In doing so, Equation
(5) was iteratively solved for different threshold inten-
sities until the maximum electron density during the laser
pulse equaled the critical electron density for optical
breakdown. To examine the effect of loss processes on
the threshold intensity, calculations are preformed in the
presence and absence of each loss process. Figure 1
represents this relation where curve (1) refers to all proc-
esses, while curves (2) and (3) stand for the absence of
recombination and diffusion respectively. For an easy
comparison the experimentally measured values of [14]
are also presented on the same figure (solid squares). It is
clear from this figure that, there is a reasonable agree-
ment between the calculated and measured threshold
intensities (Ith) over the whole range of pulse duration
considered in this analysis when losses are taken into
account (curve 1). Omission of recombination losses
10-13 10-12 10-11 10-10 10-9 10-8
10-13 10-12 10-11 10-10 10-9 10-8
108
109
1010
1011
1012
1013
108
109
1010
1011
1012
1013
=1064nm
EXP at(Noack,Vogel,1999)
(1) All Processes
(2) No Recombination
(3) No Diffusion
Threshold Intensity (W/cm2)
Pulse duration (sec)
(1),(3)
(2)
Figure 1. Comparison between calculated and measured
threshold intensities as a function of pulse duration for dis-
tilled water.
3.1.1. Effect of Ionization Mechanisms
In the present work, studying the time evolution of the
free electron density characterizes the interplay of multi-
photon ionization in the presence of recombination losses
during the breakdown process. Figure 2 represents this
relation during the laser pulse under the combined con-
tribution of multiphoton ionization and cascade ioniza-
tion processes as well as the individual effect of mul-
tiphoton ionization calculated at the central point of the
focal volume (z0, r0). These are referred as curves (1) and
(2) respectively in this figure for the laser pulses a) 6 ns,
b) 30 ps, and c) 100 fs.
From Figure 2(a) it is observed that the electron den-
sity starts to grow after a period of 0.2 ns with an elec-
tron density not exceeding 10 cm3 as shown by curves
(1) and (2). Beyond this time, curve (1) suffers a sudden
increase reaching a value of 1020 cm3 at a time of 0.3 ns.
Then its value remains almost constant up to 5.5 ns
where it shows a slight decrease. While curve (2) (no
cascade ionization) showed a gradual increase reaching
to a value of 107 cm3 at the peak of the laser pulse, then
it continue with this value up to its end. This behavior
suggests that for nanosecond pulses at infra red wave-
lengths, the breakdown threshold in distilled water are
determined by the intensity required to producing the
first free electrons by multiphoton absorption.
At that intensity the rate of cascade ionization is so
high that the breakdown proceeds almost instantaneously
to the critical electron density (1020 cm3). This explains
the sudden increase of the electron density during the
early stages of the laser pulse shown by curve (1) in this
figure.
In Figure 2(b) (30 ps), however, the electron density
during the early stages of the laser pulse showed similar
behavior where it started with an electron density of one
electron per cm3 at about 2 ps for both curves (1) and (2),
then curve (1) showed a gradual increase up to the end of
the laser pulse, while curve (2) started with a slower in
Copyright © 2012 SciRes. JMP
L. H. GAABOUR ET AL. 1687
0123456
0123456
10-5
10-1
103
107
1011
1015
1019
10-5
10-1
103
107
1011
1015
1019
(ii)
(i)
1064nm
=6 ns
Electron density (cm-3)
Time (ns)
(a)
MP I+ CI
MPI
(a)
0510 15 20 25 30
0510 15 20 25 30
100
104
108
1012
1016
1020
100
104
108
1012
1016
1020
(ii)
(i)
1064nm
=30 ps
Electron density (cm-3)
Time ( ps)
MPI+CI
MPI
(b)
(b)
020406080100
020406080100
106
1010
1014
1018
1022
106
1010
1014
1018
1022
(ii )
(i )
1064nm
=100 fs
Electron density (cm-3)
Time (fs)
(c) MPI+C I
MPI
(c)
Figure 2. Evolution of free electron density, (i) combined
effect of MPI and CI, (ii) MPI alone.
crease followed by an almost constant value at about 107
cm3 up to its end. From this figure it is clear that cas-
cade-ionization contributes effectively to the breakdown
of distilled water at this laser pulse length. This gradual
increase of the electron density indicates the slow rate of
cascade ionization during the first half of the laser pulse.
This may be attributed to the competition between the
two ionization mechanisms during this time which hin-
ders the electron density growth. The increase shown by
curve (1) during the second half of the laser pulse gives
an evidence for the contribution of cascade ionization.
On the other hand, in Figure 2(c) for the femtosecond
laser pulse, curves (1) and (2) showed different behavior
where they start with high values during the early stages
of the laser pulse (108 cm3) followed by a constant value
up to their end. The omission of cascade ionization
(curve 2) showed only a slight decrease of the electron
density during the second half of the laser pulse. This
result supports the important role played by multiphoton
ionization process to the breakdown of distilled water at
the ultra short laser pulse (100 fs). This figure clarifies
the important role played by the cascade ionization proc-
ess in enhancing the electron density to reach the break-
down limits. Moreover, it showed also that for infra red
wavelengths most free electrons are produced by cascade
ionization even for the short pulse duration. Recombina-
tion losses occur near the end of the laser pulse (where a
high electron density is achieved) as shown by the slow
drop of the electron density illustrated by curve (1) Fig-
ure 2(a) for nanosecond pulses. Its influence becomes
negligible for the ultra short pulses Figures 2(b) and (c)
since its rate becomes slower compared to the laser pulse
length.
3.1.2. Spatial Distribution of the Electron Density
along the Radial and Axial Distances of the
Focal Spot: Plasma Length
Taking the spatial distribution of the laser intensity as a
Gaussian shape, calculations are preformed to obtain the
distribution of the electron density in the cylindrical focal
volume with axial distance zR and radial distance w0. The
aim of this analysis is to determine the actual size of the
breakdown region (plasma length) as a function of the
laser pulse length. The calculations are carried out at the
threshold intensity for breakdown at three values along
the axial distance namely; z1, z2 and z3. At each value of z
the electron density is determined at three values along
the radial axis of the focal volume (r1, r2 and r3) for the
three laser pulses. Figures 3-5 represent this relation for
6 ns, 30 ps, and 100 fs respectively. In these figures a, b,
and c correspond to the values for the axial distances z1,
z2 and z3 at which the electrons density are calculated.
From Figure 3 (6 ns), it is clear that the evolution of
electron density along the axial distance (z1, z2 and z3)
takes the same trend during the laser pulse, where it
shows a fast increase at the early stages followed by an
almost constant value with a slight decrease at its end.
Moreover, the values of the electron density at the end of
the pulse undergo slow gradient along both the axial and
radial distances. Table 1 shows these values together
with the electron density calculated at the central focal
Copyright © 2012 SciRes. JMP
L. H. GAABOUR ET AL.
1688
(a)
(b)
(c)
Figure 3. Spatial distribution of the electron density for
laser pulse of 6 ns at three different locations along the axial
distance (a) z1 cm, (b) z2 cm and (c) z3 cm.
point (z0, r0). This result reveals that the breakdown re-
gion almost cover the focal volume. At 30 ps pulse (Fig-
ure 4) different behavior is shown where the electron
density along both the axial and radial distances showed
a noticeable cut off resulting in a very small breakdown
region just surrounding the center of the focal volume (z0,
r0). The calculated electron density along the axial dis-
tance (from z0 to z3) and radial values (from r0 to r3) are
illustrated in Table 2. At the shorter pulse length (100 fs)
Table 1. Electron density at the end of the pulse along both
the axial and radial distances (z0, r0) at 6 ns.
Electron density (cm3)
z3 z2 z1 z0
R
7.64 × 10¹⁷
1.53 × 10¹⁸ 2.16 × 10²⁰ 2.40 × 10²⁰
r0
6.50 × 10¹⁷
1.35 × 10¹⁸ 1.93 × 10²⁰ 2.16 × 10²⁰
r1
1.19 × 10¹⁷
3.78 × 10¹⁷ 6.50 × 10¹⁷ 7.64 × 10¹⁷
r2
2.34 × 10¹³
1.18 × 10¹⁵ 6.24 × 10¹⁵ 1.00 × 10¹⁶
r3
0510 15 20 25 30
100
104
108
1012
1016
1020
100
104
108
1012
1016
1020
0510 15 20 25 30
r1=2.5 x 10⁻⁵cm
r2=1.5 x 10⁻⁴cm
r3=2.5 x 10⁻⁴cm
(a)
30 ps
r3
r2
r1
z1=3.5208 x10⁻⁴cm
Electron density (cm-3)
Time (ps)
(a)
0510 15 20 25 30
100
104
108
1012
1016
1020
100
104
108
1012
1016
1020
0510 15 20 25 30
r1=5 x10⁻⁵cm
r2=1.5 x10⁻⁴cm
r3=2.5x10⁻⁴cm
(b)
30 ps
r3
r2
r1
z2=7.0416 x10⁻⁴cm
Electron density (cm-3)
Time (ps)
(b)
0510 15 20 25 30
0510 15 20 25 30
100
104
108
1012
1016
1020
100
104
108
1012
1016
1020
r1=5 x10⁻⁵cm
r2=1.5 x10⁻⁴cm
r3=2.5x10⁻⁴cm
(c)
30 ps
r2
r1
z3=1.1736 x10⁻³cm
Elec tro n d e n sity (c m-3 )
Time (ps)
(c)
Figure 4. The same relation but for laser pulse of 30 ps.
Copyright © 2012 SciRes. JMP
L. H. GAABOUR ET AL. 1689
Figure 5 presents the time history of the electron density
at the different locations along the axial and radial dis-
tances.
From this figure it is clear that the electron density is
almost homogenously distributed in a volume surround-
ing the central region of the focal volume. The calculated
electron densities at the different locations along the ax-
ial and radial distances are given in Table 3. Figures 3-5
depicted precisely the spatial distribution of the peak free
electron density for the three laser pulses. It appears
(a)
(b)
(c)
Figure 5. The same relation but for laser pulse of 100 fs.
Table 2. Electron density at the end of the pulse along both
the axial and radial distances (z0, r0) at 30 ps.
Electron density (cm3)
z3 z2 z1 z0 R
1.42 × 10³ 6.52 × 10¹⁰ 1.41 × 10¹⁷ 1.13 × 10²⁰ r0
1.18 × 10³ 4.28 × 10¹⁰ 7.30 × 10¹⁶ 5.05 × 10¹⁹ r1
3.94 × 100 5.47 × 10⁵ 1.87 × 10⁹ 6.52 × 10¹⁰ r2
7.03 × 10⁻⁴
3.94 × 100 2.85 × 10² 1.42 × 10³ r3
Table 3. Electron density at the end of the pulse along both
the axial and radial distances (z0, r0) at 100 fs.
Electron density (cm3)
z3 z2 z1 z0 R
5.50 × 10¹³
1.99 × 10¹⁷ 8.71 × 10¹⁸ 3.34 × 10¹⁹ r0
4.86 × 10¹³
1.74 × 10¹⁷ 7.52 × 10¹⁸ 2.87 × 10¹⁹ r1
6.64 × 10¹³
1.83 × 10¹⁵ 6.00 × 10¹⁶ 1.99 × 10¹⁷ r2
2.87 × 10⁸ 6.64 × 10¹¹ 1.81 × 10¹³ 5.50 × 10¹³ r3
that the maximum value of the peak free electron density
occurs at the focus point. At a glance the results shown in
these figures can be used for predicting the maximum
plasma length. Moreover, the obtained results may clar-
ify that once optical breakdown occurs the focal volume
will be divided into a breakdown and non-breakdown
regions as shown in Figure 6. This figure represents the
contour distribution of the electron density in the area
surrounding the central focal point. Due to the symmet-
rical shape of the cylindrical focal volume, the contours
are taken for just a quarter.
It is shown that at 6 ns the breakdown region extended
beyond the central point along both axial and radial dis-
tances producing comparatively sizable plasma. For 30
ps, however, the breakdown region is confined to a very
small size exactly at the central focal point surrounded
with non breakdown region. At the shorter pulse length
(100 fs) different behavior is shown where the formed
plasma is elongated on the axial distance producing a
pipe shape breakdown region surrounded by non break-
down zone.
3.2. Effect of Self Focusing
To test roughly the effect of self-focusing which is likely
takes place during the interaction of high power laser
with liquids, computation are carried out to investigate
the experimental measurements given in [14]. In doing so,
the threshold power is calculated in terms of the given
spot size diameter (2w0 = 5.0 μm) and the calculated
threshold intensity for the three laser pulses examined
Copyright © 2012 SciRes. JMP
L. H. GAABOUR ET AL.
1690
(a)
(b)
(c)
Figure 6. Contour representation for the electron density
along the axial and radial distances of the focal volume for
(a) 6 ns; (b) 30 ps and (c) 100 fs.
experimentally. Estimating the critical power for self fo-
cusing using Equation (9), it is found to be 1.53 MW.
Table 4 illustrates the calculated threshold power (Pth)
at the three laser pulse lengths. From this table it is clear
that these powers are much lower than the critical power
for self focusing. Therefore, this phenomenon is unlikely
to occur under the give experimental conditions. This
might be attributed to the small spot size which corre-
Table 4. Threshold power versus pulse duration, for fo-
cused spot radius 2.5 × 104 cm.
Laser pulse length 100 fs 30 ps6 ns
Calculated threshold power (MW) 0.44 0.03 0.007
sponds to short focal length of the focusing lens (~4.0
cm).
An attempt is made to check the exact dependence of
the focal length of the focusing lens on the threshold
power for each laser pulse length. Knowing the beam
divergence of the laser source (θ =1.148 × 10⁴ rad.), it
was possible to determine the threshold power corre-
sponding to focusing lens with focal lengths vary be-
tween 1 - 10 cm. Figure 7 presents a relation between
the estimated values of the threshold power as a function
of the focal length at 6 ns (curve 1), 30 ps (curve 2), and
100 fs (curve 3). Curves (1 and 2) showed very low val-
ues for the threshold power over the whole focal length
range. For the ultra short laser pulse (curve 3) different
behavior is shown, where the value of the threshold
power showed a slight increase up to 5.0 cm followed by
a faster increase reaching a high value exceeding the
critical power for self focusing (1.53 MW) at 10.0 cm. In
this study the critical power corresponds to a focal length
of 8.0 cm as indicated in this figure. This result confirms
the negligible contribution of the self focusing at the
three laser pulses considered in this analysis when the
laser beam is focused with a lens of focal length not ex-
ceeding 8.0 cm.
4. Conclusion
In this study a modified numerical model based on a rate
equation is applied to investigate the transit evolution of
plasma in distilled water generated by focused short laser
pulses. The study takes into account first, a Gaussian
shape for the temporal distribution of the laser intensity
and hence the electron density in the cylindrical focal
volume. The rate equation is solved numerically using a
fourth order Runge-Kutta method with adaptive time step
control. The threshold intensities of the various laser
pulses which are tested experimentally by Noack and
Vogel [14] are computed and compared with the experi-
mentally measured ones. Good agreement is obtained
which confirms the validity of the modified model. Cal-
culations are also preformed to simulate the start up and
growth of the electron density. This was carried out for
nano, pico and femto laser pulses. The results illustrated
the effect of ionization mechanisms. It is also found that
recombination losses act pronouncedly at the nanosecond
domain. Secondly, the rate equation is solved numeri-
cally taking into account a Gaussian shape for the tem-
poral and spatial distribution of the laser intensity in the
Copyright © 2012 SciRes. JMP
L. H. GAABOUR ET AL.
Copyright © 2012 SciRes. JMP
1691
7891011
[6] A. Takita and Y. Hayasaki, “Dynamics of Femtosecond
Laser-Induced Breakdown in Water,” Proceedings of
SPIE, Vol. 7201, 2009.
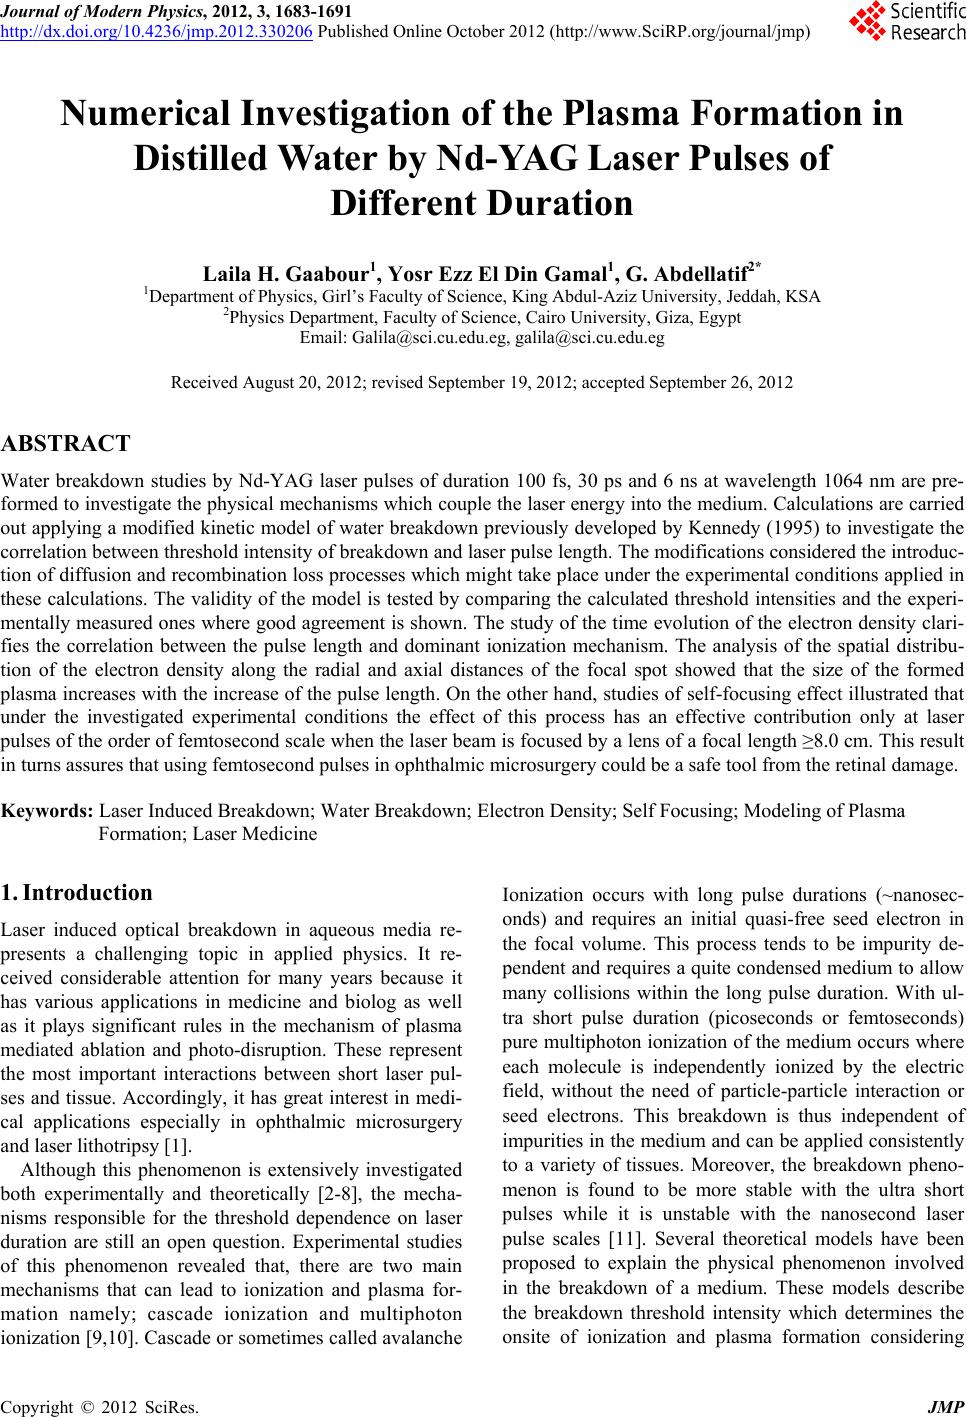
123456
1234567891011
0
1
2
0
1
2
(1) 6 ns
(2) 30 ps
(3) 100 fs
1064nm
Pth(MW)
Focal leng th (c
6ns
30ps
100fs
m)
(3)
(2)
(1)
[7] J. Zhou, J. K. Chen and Y. Zhang,Numerical Modeling
of Transient Progression of Plasma Formation in Biol-
ogical Tissues Induced by Short Laser Pulses,” Applied
Physics B: Lasers and Optics, Vol. 90, No. 1, 2008, pp.
141-148. doi:10.1007/s00340-007-2843-z
[8] A. Sollier, L. Berthe and R. Fabbro, “Numerical Mo-
deling of the Transmission of Breakdown Plasma Gene-
rated in Water during Laser Shock Processing,” European
Physical Journal Applied Physics, Vol. 16, 2001, pp. 131-
139.
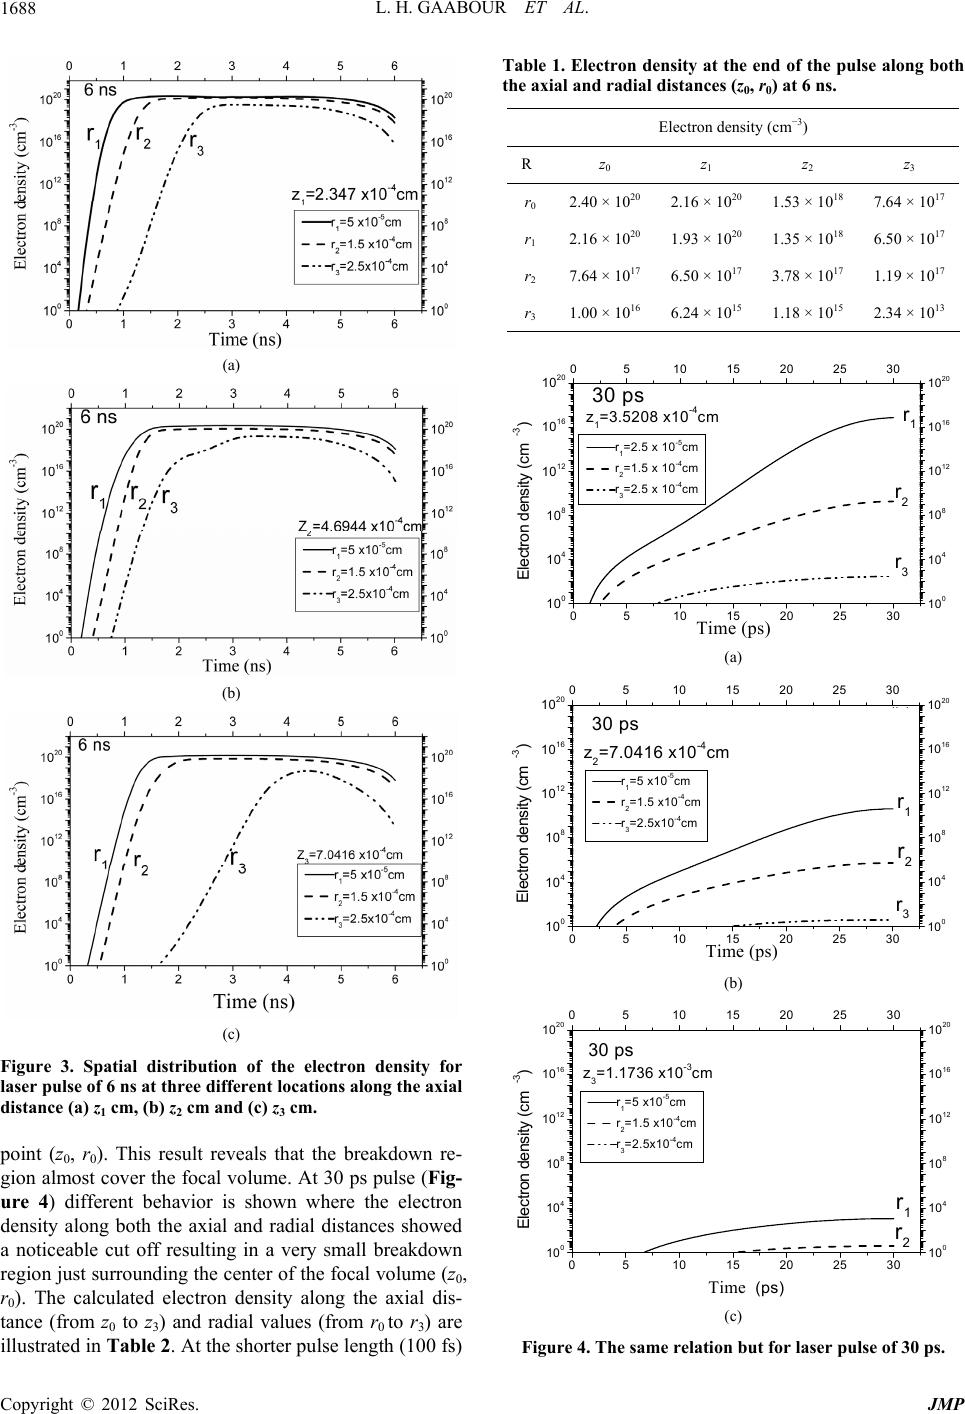
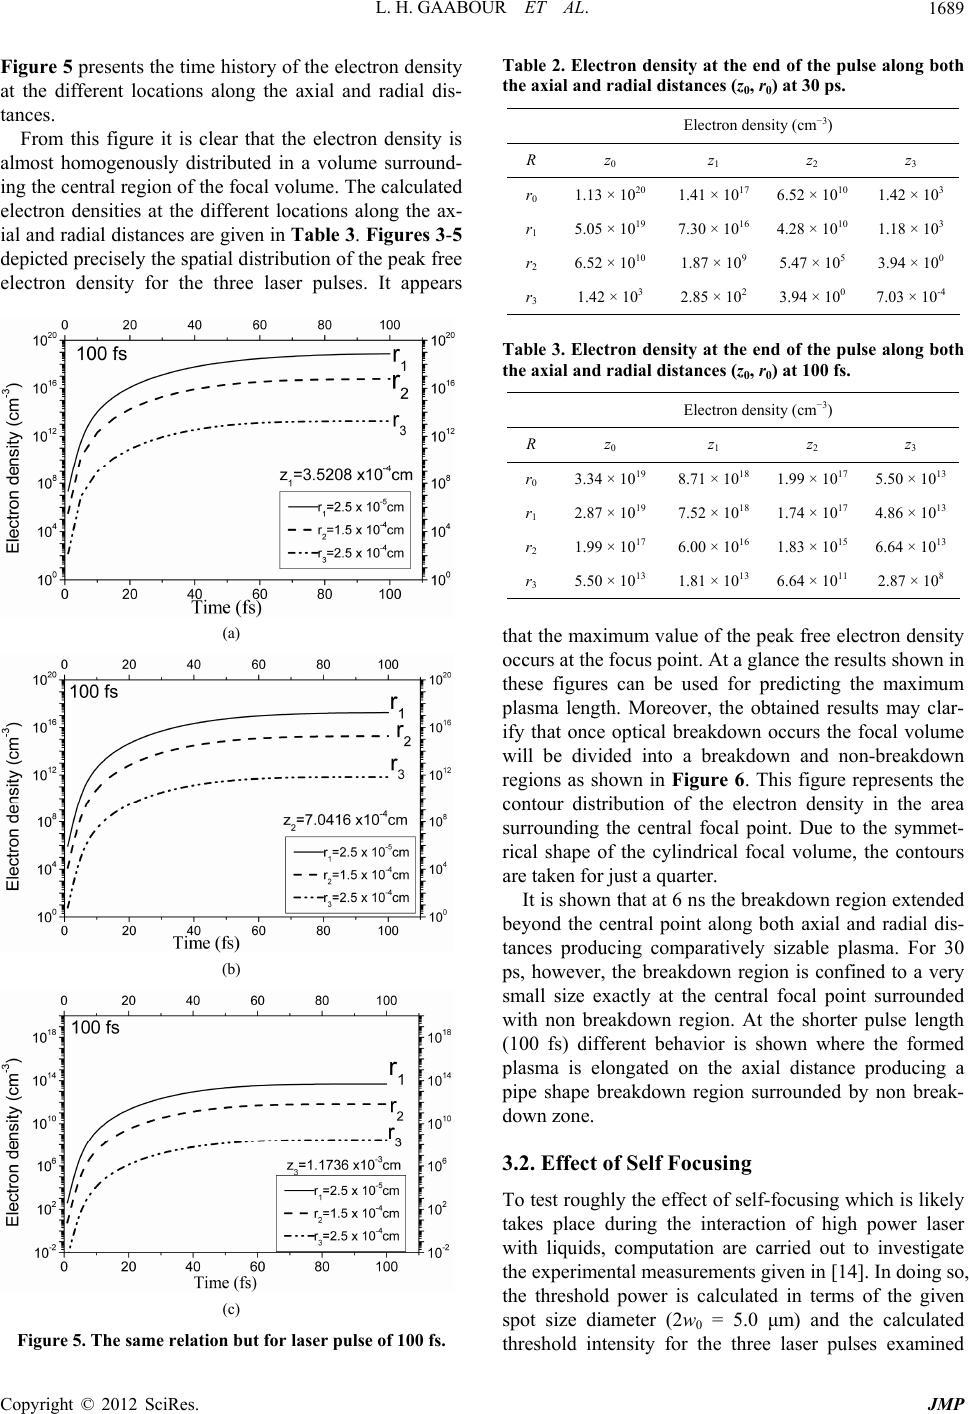
Figure 7. Threshold power versus focal length for (1) 6 ns,
(2) 30 ps, and (3) 100 fs.
[9] D. X. Hammer, R. J. Thomas, G. D. Noojin, B. A. Rock-
well, P. K. Kennedy and W. P. Roach, “Experimental In-
vestigation of Ultrashort Pulse Laser-Induced Breakdown
Thresholds in Aqueous Media,” IEEE Journal of Quan-
tum Electronics, Vol. 32. No. 4, 1996, pp. 670-678.
doi:10.1109/3.488842
focal volume. The beam waist is assumed to vary along
the axial distance. The results of these calculations re-
vealed deep understanding about the temporal evolution
and spatial distribution of the free electron in the focal
volume. The highest electron density is obtained at the
centre focal point (z0, r0). The maximum volume of the
plasma is determined from the electron density distribu-
tion along the axial and radial distances and its value
showed an increase with increasing the laser pulse. More-
over, the shape of the formed plasma varies with the laser
pulse length. In addition, investigation of the effect of
self focusing over the studied pulse length indicated that
this process may play important role only for the femto-
second pulses when a focusing lens is used with focal
length 8.0 cm. No evidence of this effect is observed at
30 ps and 6 ns pulse lengths. Accordingly, laser sources
operating at the later pulse lengths as well as 100 fs pul-
ses focused with a lens of focal length less than 8.0 cm
can be used safely for ophthalmic microsurgery.
[10] F. Docchio, P. Regondi, M. R. C. Capon and J. Mellerio,
“Study of the Temporal and Spatial Dynamics of Plasmas
Induced in Liquids by Nanosecond Nd:YAG Laser Pulses.
1: Analysis of the Plasma Starting Times,” Applied Optics,
Vol. 27, No. 17, 1988, pp. 3661-3668.
doi:10.1364/AO.27.003661
[11] M. Bass and H. H. Barrett,Avalanche Breakdown and
the Probabilistic Nature of Laser-Induced Damage,” IEEE
Journal of Quantum Electron, Vol. 8, No. 3, 1972, pp.
338-343. doi:10.1109/JQE.1972.1076971
[12] C. Grey-Morgan,Laser-Induced Breakdown of Gases,”
Reports on Progress in Physics, Vol. 38, No. 5, 1975, pp.
621-665. doi:10.1088/0034-4885/38/5/002
[13] C. B. Schaffer, N. Nishimura, E. N. Glezer and E. Mazur,
“Ultrafast Laser-Induced Microexplosions: Explosive Dy-
namics and Submicrometer Structures,” Proceedings of
SPIE on Commercial Applications of Ultrafast Lasers,
Vol. 3269, 1998, p. 36. doi:10.1117/12.312339
REFERENCES [14] J. Noack and A. Vogel, “Laser-Induced Plasma Forma-
tion in Water at Nanosecond to Femtosecond Time Scales:
Calculation of Thresholds, Absorption Coefficients, and
Energy Density,” IEEE Journal of Quantum Electron,
Vol. 35, No. 8, 1999, pp. 1156-1167.
doi:10.1109/3.777215
[1] A. Vogel, “Non-Linear Absorption: Intraocular Micro-
surgery and Laser Lithotripsy,” Physics in Medicine and
Biology, Vol. 42, 1997, p. 895.
doi:10.1088/0031-9155/42/5/011
[2] F. Docchio, “Lifetimes of Plasmas Induced in Liquids
and Ocular Media by Single Nd:YAG Laser Pulses of
Different Duration,” Europhysics Letters, Vol. 6, No. 5,
1988, p. 407.
[15] J. A. Powell, J. V. Moloney, A. C. Newell and R. A. Alba-
nese,Beam Collapse as an Explanation for Anomalous
Ocular Damage,” Journal of the Optical Society of Ame-
rica B, Vol. 10, No. 7, 1993, pp. 1230-1241.
doi:10.1364/JOSAB.10.001230
[3] C. A. Sacchi, “Laser-Induced Electric Breakdown in
Water,” Journal of the Optical Society of America B, Vol.
8, No. 2, 1991, p. 337. [16] F. Williams, S. P. Varma and S. Hillenius, “Liquid Water
as a Lone-Pair Amorphous Semiconductor,” Journal of
Chemical Physics, Vol. 64, No. 4, 1976, p. 1549.
doi:10.1063/1.432377
[4] P. K. Kennedy, “A First-Order Model for Computation of
Laser-Induced Breakdown Thresholds in Ocular and Aqu-
eous Media: Part I-Theory,” IEEE Journal of Quantum
Electron, Vol. 31, No. 12, 1995, p. 2241. [17] L. V. Keldysh, “Ionization in the Field of a Strong Ele-
ctromagnetic Wave,” Soviet Physics JETP, Vol. 20, 1965,
p. 1307.
[5] Q. Feng, J. V. Moloney, A. C. Newell, E. M. Wright, K.
Cook, P. K. kennedy, D. X. Hammer, B. A. Rockwell and
C. R. Thompson, “Theory and Simulation on the Thre-
shold of Water Breakdown Induced by Focused Ul-
trashort Laser Pulses,” IEEE Journal of Quantum Ele-
ctron, Vol. 33, No. 2, 1997, p. 127.
[18] Y. R. Shen, “The Principle of Nonlinear Optics,” Wiley,
New York, 1984.
[19] E. U. Condon and H. O. Dishaw, “Handbook of Physics,”
2nd Edition, Mac Grow Hill, New York, 1967.